ISSN (e): 2250-3021, ISSN (p): 2278-8719
Vol. 10, Issue 1, January 2020, ||Series -IV|| PP 43-48
Optimization of Process parameters for Tensile strength and
Nugget diameter in Resistance Spot welding
Prof.B.S.Gawai, Prof.R.R.Gadge, Prof.S.D.Kurhekar
Mechanical Engineering departmnet Sanmati Engineering college Washim, India
Mechanical Engineering departmnet Sanmati Engineering college Washim, India
Mechanical Engineering departmnet Sanmati Engineering college Washim, India
Received 02January 2020; Accepted 16 January 2020
Abstract:
The welding current, welding cycle and Pressure are the essential factors that are controlled so as to give the fundamental mix of Heat and pressure to form the weld. The impact of different parameters on Weld quality of Hot rolled E-34 material is decide by utilizing Minitab 16 software and using Design of experiment. Response surface methodology is chosen to design the experiments. The highly significant factor was determined by Analysis of Variance. In the analysis, it was observed that predicted and experimental results were in good agreement and the coefficient of determination were found to be 0.967and 0.955for Tensile strength and Nugget diameter implies adequacy of derived model. The objective of research to find out progression in welds strength and also reduces different welding defects.Keywords:
Resistance Spot Welding (RSW) ,Response Surface Method (RSM), Tensile Strength, Nugget Diameter, Analysis of Variance (ANOVA).I.
INTRODUCTION
It is a productive joining process broadly utilized for the creation of sheet metal assemblies. Resistance welding is gathering of welding forms which produce blend of metals with the heat got from opposition offered by the work piece to the progression of electrical flow through the parts being joined. In this process, heavy electric current is passed through the metals to be joined .this causes local heating to increase temperature to plastic state over limited area of contact. Mechanical pressure is applied to join the meats completely. No additional filler metal is required. The current is passed through the electrodes which incorporate very low resistance in the circuit and the resistance at the joints of metals is very high. Thus maximum heating is produced at the point of contact where weld is to be made .Resistance welding is use welding to sheet metals of all engineering metals in Steel cabinets ,boxes, canes and furniture automobile industry, air craft industry, and pipe and tubing production.
II.
LITERATURE
REVIEW
The present paper research work related to optimization of process parameter of Resistance spot welding machine and reducing defects in process. The Literature review is given as:
S.M. Hamidinejad et.al. [1] Carried out the modeling and process analysis of resistance spot welding on galvanized steel sheets used in car body manufacturing. Dawei Zhao et.al [2] Investigate and optimized process parameter like welding time, welding current and Electrode force for improvement in failure energy and spot weld quality of spot welded titanium alloy. L. Han et.al. [3] Concluded experimental Correlation Study of Mechanical Strength of Resistance Spot Welding of AA5754. Aluminium Alloy. Nizamettin Kahraman [4] has carried out outcome of experimental investigations to assess the performance of commercially pure (CP) titanium sheets (ASTM Grade 2) were welded by resistance spot welding at different welding parameters and under different welding environments. S. Aslanlar [5] has experimentally study the change in Nucleus size ratio for tensile peel strength and Tensile shear strength were investigate and optimum welding condition for parameters like weld current and time were find out. M. Vural et.al. [6] have aimed to analyze the Effect of welding nugget diameter on the fatigue strength of the resistance spot welded joints of different steel sheets.
Material:
Material used in this study is Hot rolled E-34 steel sheet. Material is cut in samples of dimensions 100×20×2 mm.
Table 1. Chemical Composition of HR E-34
Element %C %Mn %S %P %Si %Al %Nb %Ti %V Iron
Composition
0.1 0.7 0.03 0.03 0.2
0.02-0.06 0.055 0.045 0.095 Balance
III.
DOE
DOE (Design of experiment) is use to know the Nature of any system. Experiments were carried out with the help of DOE method. By using DOE, it can predict the result of output maximum or output minimum. In DOE, Response surface Methodology is used for mathematical modeling. Box –Behnken design was used to set experimental runs. The Input process parameters were weld Current, Weld time, Pressure for research work. Nugget diameter and Tensile strength were output parameters. For every experimental run parameter were fit and alter with respect design table. Parameter ranges are decided on the basis of Literature review. Recommended and machine feasibility and specifications given by BAJAJ Materials department Bajaj auto Ltd,Akrudi.
Resistance Spot Welding Machine Specifications
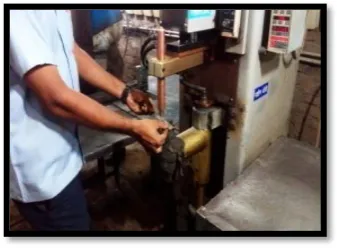
75 KVA Spot welding machine is employed for experimentation .Weld, current, pressure used for responses like nugget diameter and strength of weld. Following figure 1 shows set up of resistance spot welding.
Fig. 1: Resistance Spot welding Machine set up
Experimentation
Welding is carried out with resistance spot welding machine with Supply 415 Volt, Frequency -50 HZ with water cooled Chromium copper electrodes. Specimens are prepared of size 100×20×2 mm and trial taken by spot welding process with above mentioned parameters. Later on same specimens are tested for tensile strength on UTM machine
Weld strength = Breaking Load/ Nugget shearing Area= P/2πDt
Where D is Nugget diameter & t= Thickness of specimen, P=Breaking Load
IV.
RESULTS
AND
DISCUSSION
Regression Analysis of Nugget Diameter
The mathematical model depicted by equation x is obtained by performing regression analysis on generated data during experimentation.The regression equation is
Nugget diameter = 2.56 + 0.0075 Weld Cycle + 0.330 Current - 0.390 Pressure
Model Adequacy Test for Nugget Diameter
Table 2: Pre ANOVA Model Summary Statics of Nugget Diameter
Predictor Coef SE Coef T P
Constant 2.5603 0.4761 5.38 0.000*
Weld Cycle 0.0075 0.01738 0.43 0.674*
Current 0.33 0.02318 14.24 0.000*
Pressure -0.39 0.06954 -5.61 0.000*
* Denotes significant terms
Table 3: ANOVA Model Summary Statics of Nugget Diameter
Source DF Contribution Adj SS Adj MS
F-Value P-Value Remark
Model 3 95.52% 2.2662 0.7554 78.12 0
Linear 3 95.52% 2.2662 0.7554 78.12 0
Weld
cycle 1 0.08% 0.0018 0.0018 0.19 0.674
Less Significant
Current 1 82.62% 1.9602 1.9602 202.7 0 Most
Significant
Pressure 1 12.82% 0.3042 0.3042 31.46 0 More
Significant
Error 11 4.48% 0.10637 0.00967
Lack-of-Fit 9 2.54% 0.06031 0.0067 0.29 0.922
Pure Error 2 1.94% 0.04607 0.02303
Total 14 100.00%
Interpretation of Residual Graph
Graph 1: Residual Plots for Nugget Diameter
Analysis of Nugget Diameter
The responses can be expressed graphically called surface plot or contour plots. Surface and contour plot can be obtained by taking responses in suitable plane against variables. Figure 5 depicts a 3-dimensional surface which shows the effect of current and Weld cycle time on the value of Nugget Diameter under the pressure 4.5.
Fig.2: Surface Plot showing Effect of Current and Pressure on Nugget Diameter
Regression Analysis of Tensile Strength
The mathematical model depicted by equation x is obtained by performing regression analysis on generated data during experimentation. The generated regression equation for Tensile strength is given by Tensile Strength = 160 + 3.91 Weld Cycle - 6.59 Current + 19.5 Pressure
Residual Pe rc en t 0.2 0.1 0.0 -0.1 -0.2 99 90 50 10 1 Fitted Value Re si du al 6.0 5.5 5.0 4.5 0.1 0.0 -0.1 -0.2 Residual Fr eq ue nc y 0.10 0.05 0.00 -0.05 -0.10 -0.15 -0.20 -0.25 6.0 4.5 3.0 1.5 0.0 Observation Order Re si du al 15 14 13 12 11 10 9 8 7 6 5 4 3 2 1 0.1 0.0 -0.1 -0.2
Normal Probability Plot of the Residuals Residuals Versus the Fitted Values
Histogram of the Residuals Residuals Versus the Order of the Data
Residual Plots for Nugget Diameter
Nugget Dia 4.5 5.0 4.0 4.5 Pressure 4.0 4.5
Nugget Dia5.5 6.0 12 5.0 5.0 14 13 12 15 Current Hold Values Weld cycle 10
Surface Plot of Nugget Diameter Vs Current,Pressure
Pressure C u rr e n t 5.0 4.8 4.6 4.4 4.2 4.0 14.7 14.2 13.7 13.2 12.7 12.2 Hold Values Weld cycle 10
Nugget
5.0 - 5.2 5.2 - 5.4 5.4
Dia
- 5.6 5.6 - 5.8 5.8 - 6.0 > 6.0 < 4.8 4.8 - 5.0
Model adequacy test for Tensile Strength
Table 4: Pre ANOVA Model Summary Statics of Tensile Strength
Predictor Coef SE Coef T P
Constant 159.63 12.11 13.18 0*
Weld Cycle 3.9069 0.4421 8.84 0*
Current -6.5855 0.5895 -11.17 0*
Pressure 19.481 1.769 11.01 0*
*Denotes Significant Term
S = 2.50113 R-Sq = 96.7% R-Sq (adj) = 95.8% R-Sq (pred) = 93.12%
Table 5: ANOVA Model Summary Statics of Tensile Strength
Source DF Contribution Adj SS Adj MS F-Value P-Value Remark
Model 3 96.72% 2028.06 676.019 108.06 0
Linear 3 96.72% 2028.06 676.019 108.06 0
Weld
cycle 1 23.29% 488.44 488.438 78.08 0
Less Significant
Current 1 37.23% 780.64 780.639 124.79 0 Most
Significant
Pressure 1 36.20% 758.98 758.98 121.33 0 More
Significant
Error 11 3.28% 68.81 6.256
Lack-of-Fit 9 3.14% 65.78 7.309 4.82 0.184
Pure
Error 2 0.14% 3.04 1.518
Total 14 100.00% 2096.87
Analysis of Tensile Strength
Fig.3: Surface Plot an Contour Plot d showing Effect of Pressure and weld cycle on Tensile strength
Fig.4: Surface Plot showing Effect of Current and weld cycle on Tensile strength
T ensile strength
180 190 200 4.0 4.5 Pressure 4.0 4.5
T ensile strength200 210
12 10Weld cycle
8 5.0
Hold Values Current 13.5
Surface Plot of Tensile Strength Vs Weld cycle,Pressure
Pressure W e ld c y c le 5.0 4.8 4.6 4.4 4.2 4.0 12 11 10 9 8 Hold Values Current 13.5 Tensile
190 - 200 200 - 210 > strength
210 < 180 180 - 190
Contour Plot of Tensile Strength Vs Weld cycle,Pressure
T ensile Strength
180 190 200 12 14 Current
12 13 14
T ensile Strength200 210 8 15 15 10 8 12 Weld cycle Hold Values Pressure 4.5
Surface plot of Tensile Strength Vs Weld cycle,Current
Current W e ld c y c le 14.7 14.2 13.7 13.2 12.7 12.2 12 11 10 9 8 Hold Values Pressure 4.5 Tensile
190 - 200 200 - 210 > strength
210 < 180 180 - 190
V.
CONFIRMATION
TEST
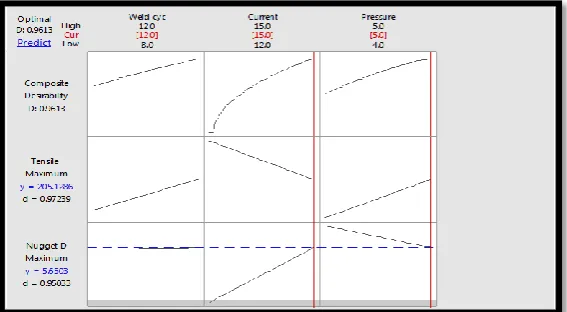
Confirmation test is performed in order to verify the difference between optimized values predicted by RSM’s D-optimization Method and the values obtained through conducting experiment by using parameters level setting for optimal performance of both the responses. Table 6 shows the results obtained through experimentation and prediction by model, also prediction error in terms of % is calculated. It is observed that experimentally obtained values are in close proximity with predicted values of both the responses.
Graph 2: Optimization Plot for Nugget Diameter and Tensile Strength
Table 6: Result of the Confirmation Experiment
Sr.No.
Actual Factors Nugget Dia.
Pred. Error %
Tensile Strength
Pred. Error %
(mm) (N/mm2)
Weld
cycle Current Pressure Predicted Actual Predicted Actual
1 12 15 5 5.65 5.68 0.53 205.12 206.62 0.73
The feasible solution obtained accepted for production trail run. Trail done on successive product lot and survey done regarding qualitative issues of weld obtained by resistance spot welding.
VI.
CONCLUSIONS
For the approach of investigation and optimization of responses like Nugget Diameter and Tensile Strength in the Resistance Spot Welding process of Hot Rolled E-34 material .The generated empirical models yield to the following conclusions:
1) The outcomes of Analysis of variance and coefficient of determination for Nugget Diameter = 0.95 and
for Tensile Strength = 0.96 represent that the fitted regression models is moderately determine the responses.
2) Optimum results have been found by using response surface method for tensile strength and nugget
diameter are at weld cycle of 12 cycles, current of 15 KA, and pressure of 5 kg/cm2,so by using this combination
of input parameter we can reduce various types of defects and error produce during Resistance spot welding operation.
3) Rationalization of machining parameters is done for the responses in the resistance Spot Welding
machine process of Hot Rolled E-34 material. Since by using proper combinations of input parameter values we can overcome various defects in welding and process is improved.
4) The Percentage contribution of Weld strength and Nugget diameter for Weld current, Pressure and
weld cycle is found as 37.23%,36.2%,23.29% and 82.62%, 12.82%, 0.08% respectively.
ACKNOWLEDGMENT
REFERENCES
[1]. S.M. Hamidinejad, F. Kolahan , A.H. Kokabi ,“ The modeling and process analysis of resistance spot
welding on galvanized steel sheets used in car body manufacturing”, Materials and Design 34 (2012),759–767.
[2]. Dawei Zhao et.al Investigate and optimized process parameter like welding time, welding current and
Electrode force for improvement in failure energy and spot weld quality of spot welded titanium alloy.
[3]. L. Han et.al. Concluded experimental Correlation Study of Mechanical Strength of Resistance Spot
Welding of AA5754. Aluminium Alloy.
[4]. Nizamettin Kahraman has carried out outcome of experimental investigations to assess the performance
of commercially pure (CP) titanium sheets (ASTM Grade 2) were welded by resistance spot welding at different welding parameters and under different welding environments.
[5]. S. Aslanlar has experimentally study the change in Nucleus size ratio for tensile peel strength and
Tensile shear strength were investigate and optimum welding condition for parameters like weld current and time were find out.
[6]. M. Vural et.al. have aimed to analyze the Effect of welding nugget diameter on the fatigue strength of the
resistance spot welded joints of different steel sheets.