www.pharmascholars.com
289
Research Article
CODEN: IJPNL6
FORMULATION AND COMPARITIVE OPTIMIZATION OF MULTIPLE LIPID
DRUG CARRIERS OF VALSARTAN FOR ORAL CONTROLLED RELEASE
T. L. Vaishnavi*, Sowjanya Battu, V. Uma Maheshwara Rao
Dept of Pharmaceutics, CMR College of Pharmacy, Kandlakoya(V), Medchal , Hyd,A.P.
*Corresponding author e-mail: [email protected]
ABSTRACT
In the present study, an attempt was made to formulate, comparatively evaluate and optimize multiple lipid drug carriers of valsartan for oral controlled release. Two lipid drug delivery systems i.e. Niosomes and Liposomes were studied for the delivery of the anti-hypertensive drug valsartan. They were formulated as suspensions.Ether injection and rotary evaporator method were chosen for the formulation of physically and chemically stable niosomes and liposomes of valsartan.In-vitro evaluation studies for the prepared multiple drug delivery carriers of valsartan were performed. The in-vitro evaluation studies performed were evaluation for physical appearance, particle size by scanning electron microscopy (SEM), drug content , entrapment efficiency and in-vitro drug release. Optimization of the best lipid drug delivery system and the best method of preparation was done based on the results of In-Vitro
drug release and entrapment efficiency values. Finally, an attempt was made to improve the bioavailabilty of the administered drug, reduce side effects and improve patient compliance by optimizing the best formulation through lipid drug delivery technology.
Keywords: Niosomes, Liposomes, Valsartan, Cholesterol, Lecithin.
INTRODUCTION
Valsartan belongs to angiotensin II antagonist category and is used as a choice for patients with heart failure who are unable to tolerate angiotensin converting enzyme (ACE) inhibitors in the management of hypertension.Valsartan undergoes extensive first-pass metabolism. To enhance the aqueous solubility, dissolution rate, to by-pass hepatic first-pass metabolism and to improve the oral bioavailability of valsartan there is a need to develop lipid drug delivery system for valsartan like liposomes, niosomes, solid lipid nanoparticles etc. Niosomes aremicroscopic lamellar structures of size range between 10 to1000 nm and consists of biodegradable, non-immunogenic and biocompatible surfactants1. Niosomes or nonionic surfactant vesicles are microscopic lamellar structures formed on admixture of nonionic surfactant of the alkyl or dialkylpolyglycerol ether class and cholesterol with subsequent hydration in aqueous media2. Structurally,
liposomes are concentricbleedervesiclesin which an aqueous volumeis entirely enclosed by a membraneous lipid bilayer.Membranes are usually made of phospholipids,which are molecules that have a hydrophilic headgroup and a hydrophobic tail group3.
MATERIALS AND METHODS
Materials Used: Valsartan was obtained from Dr. Reddy Laboratories Ltd Hyderabad. Cholesterol was purchased from SD Fine Chemicals Ltd Mumbai. Span 20 was obtained from Rolex Chemical Industries Mumbai. Methanol, Diethyl ether, Chloroform, Disodium Hydrogen Phosphate, Potassium Dihydrogen Phosphate, Sodium Chloride were obtained from SD Fine Chemicals Ltd Mumbai. Lecithin was purchased from Hi Media Lab Pvt Ltd Mumbai.
Instruments Used: Rotary Evaporator, Magnetic Stirrers, Electronic Balance, Cooling Centrifuge, UV
International Journal of Pharmacy
www.pharmascholars.com
290
Visible Spectrophotometer, Fourier Transform Infra Red, Scanning Electron Microscope
METHODOLOGY OF THE CURRENT STUDY
Formulation of Niosomes by Ether Injection Method: Niosomes containing valsartan were prepared by modified ether injection technique using nonionic surfactant (span 20) and cholesterol at different concentrations. Cholesterol and surfactant were dissolved in diethyl ether mixed with methanol containing weighed quantity of valsartan. The resulting solution was slowly injected using a 24 gauge needle at a rate of 1ml/min into of hydrating solution phosphate buffer (pH 7.4).The solution was stirred continuously on magnetic stirrer and temperature was maintained at 60-65ºC. As the lipid solution was injected slowly into aqueous phase, the differences in temperature between phases cause rapid vaporization of ether, resulting in spontaneous vesiculation and formation of niosomes. Different batches of niosomes were prepared4.
Formulation of Niosomes by Rotary Evaporator Method: In this method cholesterol and span 20 were dissolved in chloroform, and the drug valsartan was dissolved in methanol. Both drug and cholesterol mixture were mixed to obtain the lipid phase. The lipid phase was taken in the round bottom flask of rotary evaporator and the organic solvent was evaporated at room temperature, using rotary vacuum evaporator at room temperature under application of vaccum. The thin layer of lipid phase was formed on the round bottom flask. The aqueous phase phosphate buffer solution pH 7.4 was added to the round bottom flask at 60-650Cand shaken till suspension of niosomes is obtained.
Formulation of Liposomes by Ether Injection Method: The same procedure was employed as used in niosomes but lecithin was used instead of surfactant. Different batches of liposomes were prepared.
Formulation of Liposomes by Rotary Evaporator Method: The same procedure was employed as used in niosomes but lecithin was used instead of surfactant. Different batches of liposomes were prepared.
EVALUATION OF FORMULATIONS
Physical Appearance: The formulations were analysed for their physical appearance.
Particle Size &Shape Analysis By SEM: The surface morphology of the prepared formulations was examined under by using Scanning electron microscope (SEM) (Jeol, JSM-6360, Japan)5.
Estimation of Drug Content: Formulation equivalent to 40mg of valsartan was taken into a standard volumetric flask. Then they were lysed with100ml of propane-1-ol by shaking. Then 5ml of this was subsequently diluted with phosphate buffer (pH 7.4). The absorbance was measured at 250 nm and drug content was calculated from the calibration curve .
Determination of Entrapment Efficiency: Percent entrapment efficiency (EE) was determined by centrifugal method. formulation was centrifuged (18000 rpm) for 40 min at 5oC in order to separate unentrapped drug. The supernatant was taken and diluted with PBS PH7.4. The drug concentration in the resulting solution was assayed spectrophotometrically at 250 nm.
In-Vitro Drug Release Studies: The release of
valsartan from niosomal formulations was determined by using membrane diffusion technique. The niosomal formulation equivalent to 40 mg of valsartan was placed in a glass tube of diameter 2.5 cm with an effective length of 8 cm which was tied with previously soaked cellulose membrane, which acts as a donor compartment. The glass tube was placed in a beaker containing 100 ml of phosphate buffer (pH 7.4), acting as a receptor compartment. The whole assembly was fixed in such a way that the lower end of tube containing suspension was just touching (1-2 mm depth) the surface of diffusion medium. The temperature of receptor medium was maintained at 37 ± 50C and was agitated at the speed of 100 rpm using magnetic stirrer. Aliquots of 5ml sample were withdrawn periodically and after each withdrawal same volume of medium was replaced. The collected samples were analyzed at 250 nm in double beam UV-VIS spectrophotometer using Phosphate Buffer (pH 7.4) as blank 6.
Optimization Procedure: Among the 20 formulations prepared optimization of the best formulation and the best method of preparation was done based on the In-vitro drug release and EE % results.
www.pharmascholars.com
291
RESULTSCHARACTERIZATION STUDIES FOR
PREPARED FORMULATIONS
Physical Appearance: The Niosomal and Liposomal formulations prepared were evaluated for physical appearance and found to be white suspensions in appearance.
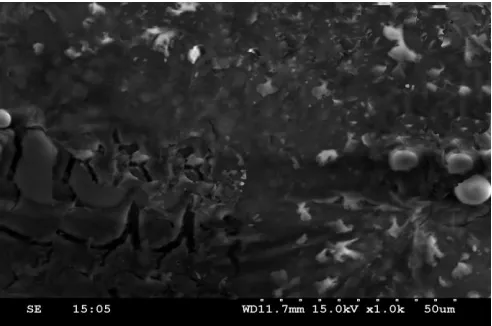
Particle Size and Shape Analysis by SEM: The particle sizes of prepared formulations were analyzed using Scanning Electron Microscopy (SEM). The particle size was found to be in micrometers range. The SEM image is shown in the below figure.
Estimation of Drug Content: The % drug content values for the prepared formulations were calculated.
Determination of Entrapment Efficiency: The % EE values of the prepared formulations were calculated.
In-Vitro Drug Release Studies: The % CDR values
of the prepared formulations were calculated. The zero order plots of the prepared formulations are shown in the below figures.
Drug Release Kinetics: The drug release kinetic data of the formulations were determined.
DISCUSSION
CHARACTERIZATION STUDIES FOR
PREPARED FORMULATIONS
Physical Appearance: The Niosomal and Liposomal formulations prepared were white suspensions.
Particle Size and Shape Analysis by SEM: The SEM reports of NE 3 showed uniform size and nearly spherical shape and results of all the other formulations were satisfactory.
Estimation of Drug Content: The results revealed that all the formulations showed satisfactory drug content. Formulation NE3 showed the highest drug content.
Determination of Entrapment Efficiency: The results revealed that all the formulations showed good entrapment efficiency values while % EE values for formulationsNE3, NR3, LE3, LR3 were
found to be appreciating than other formulations. NE3 formulation showed the highest % EE value.
In-Vitro Drug Release Studies: For all the 20 formulations there was no initial burst release but the release was constant in a controlled manner for a period of time upto 48 hrs. The best formulation is the one which provides good morphology (size and shape), high drug content, entrapment efficiency and controlled and prolonged drug release. Formulation NE 3 was considered to be the best formulation as the drug content, entrapment efficiency and the percent drug release were high for NE 3. This is the niosomal formulation containing comparatively high amount of surfactant prepared by ether injection method. The results of in-vitro drug release revealed that the drug was released in a controlled manner from all the formulations and NE 3 showed maximum drug release at the end of 48th hour. Hence from all the above results of morphology, drug content, entrapment efficiency and in-vitro drug release studies, it is proved that formulation NE 3 is the best and optimized formulation.
Drug Release Kinetics: The order of drug release was found to be zero order, in which the regression value was found to be close to 1. From the Higuchi model shows linear regression and it can be found that the release follows diffusion kinetics mechanism. The n value of Peppa’s equation was found to be greater than 1. From this it is concluded that the drug release follows super case II transport with zero order release. The results were tabulated below.
CONCLUSION
From all the above parameters and results, it was concluded that niosomes of valsartan prepared by ether injection method, Formulation code NE 3 has shown a promising formula for delivering the drug by which the bioavailability of the drug can be improved, side effects can be reduced,first pass hepatic metabolism of the drug can be avoided and finally the patient compliance can be improved.
ACKNOWLEDGEMENTS
www.pharmascholars.com
292
Table No: 1–Formulation table for NiosomesS No Ratio of
Drug:Surfactant:Cholesterol
Drug (mg)
Surfactant(mg) Span 20
Cholesterol(mg)
1 1:1:1 40 40 40
2 1:2:1 40 80 40
3 1:3:1 40 120 40
4 1:1:2 40 40 80
5 1:1:3 40 40 120
Table No: 2 Formulation table for Liposomes
S No Ratio of
Drug:Lecithin:Cholesterol
Drug (mg) Lecithin (mg) Cholesterol(mg)
1 1:1:1 40 40 40
2 1:2:1 40 80 40
3 1:3:1 40 120 40
4 1:1:2 40 40 80
5 1:1:3 40 40 120
Table No: 3 Results for drug content estimation of niosomes prepared by ether injection method
S No Amount of Drug (mg) % Drug Content (±SD) n=3
NE1 39.423 98.557± 0.557 NE2 39.166 97.915± 0.333 NE3 39.935 99.837± 0.0700 NE4 39.358 98.395± 0.079 NE5 39.102 97.755± 0.575
Table No: 4 - Results for drug content estimation of niosomes prepared by rotary evaporator method
S No Amount of Drug (mg) % Drug Content (±SD) n=3
NR1 39.743 99.357 ± 0.566 NR2 39.423 98.557± 0.901 NR3 39.935 99.837± 0.747 NR4 39.807 99.517± 0.588 NR5 39.743 99.357± 0.514
Table No: 5 - Results for drug content estimation of liposomes prepared by ether injection method
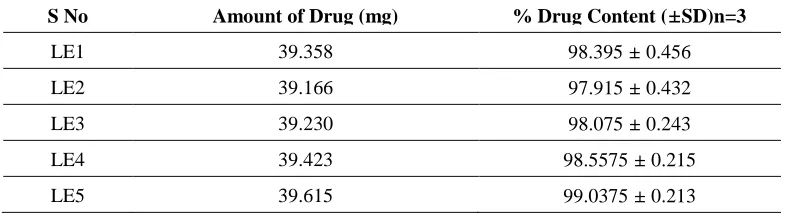
S No Amount of Drug (mg) % Drug Content (±SD)n=3
www.pharmascholars.com
293
Table No: 6 - Results for drug content estimation of liposomes prepared rotary evaporator methodS No Amount of Drug (mg) % Drug Content (±SD)n=3
LR1 39.166 97.915 ± 0.245 LR2 39.294
98.235 ± 0.434 LR3 39.743 99.3575 ± 0.342 LR4 39.166 97.915 ± 0.321 LR5 39.230
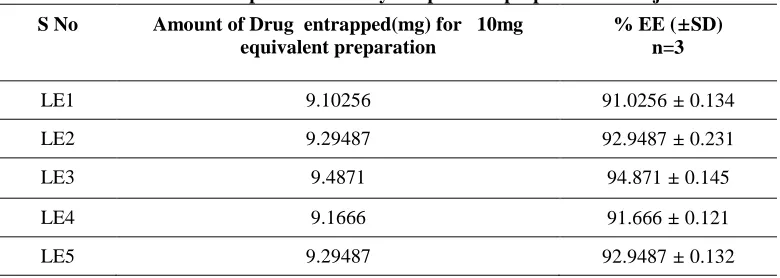
98.075 ± 0.326 Table No: 7 - Results for entrapment efficiency of niosomes prepared ether injection method
S No Amount of Drug entrapped(mg) for 10mg equivalent preparation
% EE (±SD) n=3
NE1 9.4871 94.871± 0.658 NE2 9.615 96.15± 0.684 NE3 9.7435 97.435± 0.0113 NE4 9.10256 91.0256± 0.349 NE5 9.2307 92.307± 0.0624
Table No: 8 - Results for entrapment efficiency of niosomes prepared rotary evaporator method
S No Amount of Drug entrapped(mg) for 10mg equivalent preparation
% EE (±SD) n=3
NR1 9.35 93.5± 0.598 NR2 9.48 94.8± 0.4909 NR3 9.615 96.15± 0.167 NR4 8.974 89.74± 0.296 NR5 9.0384 90.384± 0.265
Table No: 9- Results for entrapment efficiency of liposomes prepared ether injection method
S No Amount of Drug entrapped(mg) for 10mg equivalent preparation
% EE (±SD) n=3
www.pharmascholars.com
294
Table No: 10 - Results for entrapment efficiency of liposomes prepared rotary evaporator methodS No Amount of Drug entrapped(mg) for 10mg equivalent preparation
% EE (±SD) n=3
LR1 8.9743 89.743 ±0.342
LR2 9.1666 91.666 ±0.254
LR3 9.42307 94.2307 ±0.234
LR4 9.10256 91.0256 ±0.247
LR5 9.23076 92.3076 ±0.143
Table No 11 –Invitro release data for NE1, NE2, NE3, NE4 and NE5 Time
(Hr)
% CDR
NE1
% CDR
NE2
% CDR
NE3
% CDR
NE4
% CDR
NE5
0 0 0 0 0 0
2 4.45 6.45 6.45 4.22 3.22
4 8.34 9.56 9.56 7.23 6.23
6 10.11 12.11 15.23 10.25 9.25
8 14.43 16.34 18.25 14.43 12.43
12 24.21 24.5 26.95 22.43 19.55
16 32.23 34.16 34.11 30.23 26.65
20 39.55 40.11 42.56 36.55 33.43
24 47.78 48.2 50.34 43.56 42.03
28 53.66 58.11 60.12 51.4 47.85
32 62.45 64.78 68.45 60.44 54.9
36 69.76 72.78 75.64 68.05 60.23
40 77.74 79.5 83.54 74.43 68.43
44 83.5 87.67 92.36 82.54 75.43
48 91.54 94.67 98.55 88.21 82.25
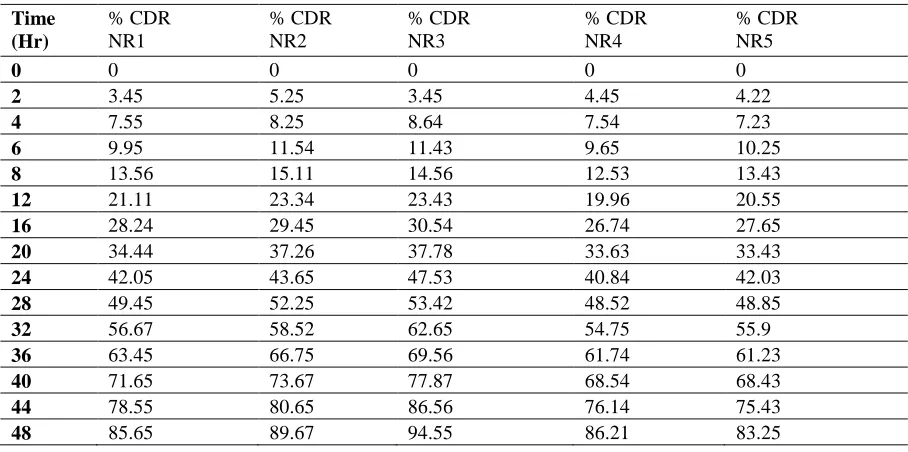
Table 12 –Invitro release data for NR1, NR2, NR3, NR4 and NR5
Time (Hr)
% CDR NR1
% CDR NR2
% CDR NR3
% CDR NR4
% CDR NR5
0 0 0 0 0 0
2 3.45 5.25 3.45 4.45 4.22
4 7.55 8.25 8.64 7.54 7.23
6 9.95 11.54 11.43 9.65 10.25
8 13.56 15.11 14.56 12.53 13.43
12 21.11 23.34 23.43 19.96 20.55
16 28.24 29.45 30.54 26.74 27.65
20 34.44 37.26 37.78 33.63 33.43
24 42.05 43.65 47.53 40.84 42.03
28 49.45 52.25 53.42 48.52 48.85
32 56.67 58.52 62.65 54.75 55.9
36 63.45 66.75 69.56 61.74 61.23
40 71.65 73.67 77.87 68.54 68.43
44 78.55 80.65 86.56 76.14 75.43
www.pharmascholars.com
295
Table 13 –Invitro release data for LE1, LE2, LE3, LE4 and LE5Time (Hr)
% CDR LE1
% CDR LE2
% CDR LE3
% CDR LE4
% CDR LE5
0 0 0 0 0 0
2 4.25 3.45 4.24 4.24 3.73
4 6.46 6.15 8.54 6.99 6.87
6 9.65 9.54 12.86 11.25 9.94
8 13.53 12.45 16.55 15.63 13.83
12 20.84 20.46 22.45 21.79 20.84
16 27.82 27.85 29.45 28.57 27.85
20 35.15 33.84 36.83 35.78 33.93
24 42.94 42.54 45.43 42.69 42.03
28 49.64 48.95 52.55 49.34 47.75
32 56.15 55.74 59.63 57.28 55.99
36 62.26 64.54 68.64 63.15 61.93
40 69.56 71.65 75.22 69.96 69.45
44 76.65 78.64 83.34 76.64 75.83
48 84.54 86.77 89.65 85.11 82.25
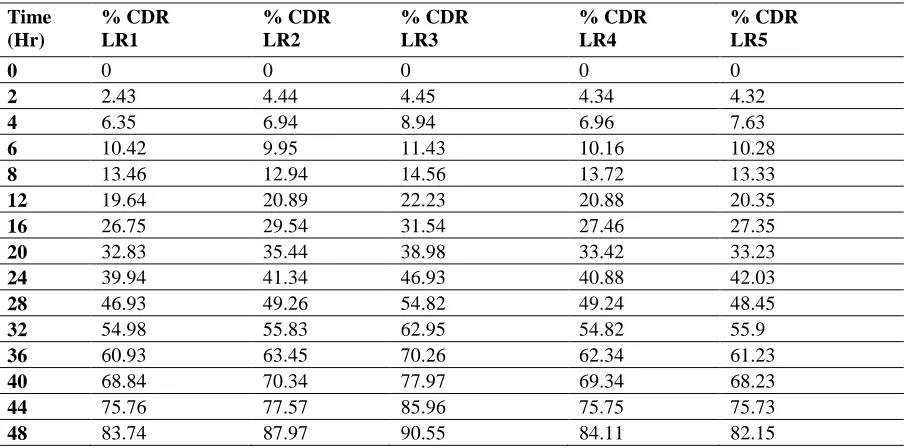
Table 14–Invitro release data for LR1, LR2, LR3, LR4 and LR5
Time (Hr)
% CDR LR1
% CDR LR2
% CDR LR3
% CDR LR4
% CDR LR5
0 0 0 0 0 0
2 2.43 4.44 4.45 4.34 4.32
4 6.35 6.94 8.94 6.96 7.63
6 10.42 9.95 11.43 10.16 10.28
8 13.46 12.94 14.56 13.72 13.33
12 19.64 20.89 22.23 20.88 20.35
16 26.75 29.54 31.54 27.46 27.35
20 32.83 35.44 38.98 33.42 33.23
24 39.94 41.34 46.93 40.88 42.03
28 46.93 49.26 54.82 49.24 48.45
32 54.98 55.83 62.95 54.82 55.9
36 60.93 63.45 70.26 62.34 61.23
40 68.84 70.34 77.97 69.34 68.23
44 75.76 77.57 85.96 75.75 75.73
48 83.74 87.97 90.55 84.11 82.15
Table No: 15 - Regression Coefficient values for Niosomal formulations prepared by Ether Injection Method
S No Zero Order Higuchi Crossmeyer Peppas Peppas slope value
CODE R2 R2 R2 n value
www.pharmascholars.com
296
Table No: 16 - Regression Coefficient values for Niosomal formulations prepared by Rotary EvaporatorMethod
S No Zero Order Higuchi Crossmeyer Peppas Peppas slope value
CODE R2 R2 R2 n value
NR1 0.9997 0.8489 0.9555 1.1743 NR2 0.9994 0.8818 0.8875 1.1938 NR3 0.9994 0.8717 0.9433 1.2036 NR4 0.9984 0.8649 0.9325 1.1661 NR5 0.9996 0.8784 0.9357 1.1684
Table No: 17- Regression Coefficient values for Liposomal formulations prepared by Ether Injection Method
S No Zero Order Higuchi Crossmeyer Peppas Peppas slope value
CODE R2 R2 R2 n value
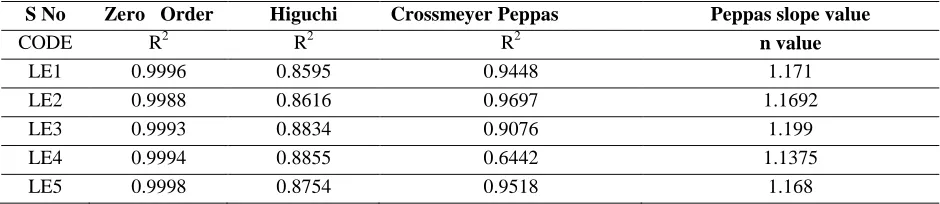
LE1 0.9996 0.8595 0.9448 1.171 LE2 0.9988 0.8616 0.9697 1.1692 LE3 0.9993 0.8834 0.9076 1.199 LE4 0.9994 0.8855 0.6442 1.1375 LE5 0.9998 0.8754 0.9518 1.168
Table No: 18- Regression Coefficient values for Liposomal formulations prepared by Rotary Evaporator
Method
Fig No: 1 Photographs of the Prepared Formulations
S No Zero Order Higuchi Crossmeyer Peppas Peppas slope value
CODE R2 R2 R2 n value
www.pharmascholars.com
297
Fig No 2: SEM Reports for NE 3 formulationFig No 3: Zero order plots of NE 1, NE 2, NE 3, NE 4 and NE 5
REFERENCES
1. Handjani-vila RM, Dispersion of lamellar phases of nonionic lipids in cosmetic products, Int J Cosmetic Sci, 1979; 1: 303.
2. M. Malhotra, N.K Jain, Indian Drugs, 1994; 31(3): 81.
3. Stryer S, Biochemistry, Kimball's Biology Pages, Cell Membranes, 1981; 213.
4. S. Srinivas, Y, Anand Kumar, A.Hemanth, M.Anitha, Preparation and Evaluation of Niosomes containing Aceclofenac, Digest Journal of Nanomaterials and Biostructures, 2010; 5 (1): 249 – 254.
5. Samyuktha Rani. B, VedhaHari B.N, Niosomal Formulation of Orlistat, Formulation and In-Vitro Evaluation, International Journal of Drug Development & Research, 2011; 3(3).