An IPS for Web Applications
A
ngelo
Biscotti, G
ianluca
Capuzzi, E
gidio
Cardinale, F
rancesco
Pagliarecci, L
uca
Spalazzi
Universit`a Politecnica delle Marche — I-60131 Ancona - ItalyEmail: [email protected],{capuzzi, cardinale, pagliarecci, spalazzi}@diiga.univpm.it
Abstract—This work presents an IPS for web applications that combines anomaly detection, misuse detection, and a prevention module. This approach provides us a solution that produce a number of false positives and false negatives less than traditional solutions. The proposed system is also able to update the misuse and anomaly model according to feedback received by the security manager. Finally, in our system the anomaly model has been specifically designed for web applications. We implemented and experimented our system in a real service company. From the results arises an improvement with respect to other state-of-the-art WEB-IDSs.
Index Terms—Intrusion Detection Systems, Intrusion Pre-vention Systems, Web Applications
I. INTRODUCTION
Web servers and web applications are often under attack by malicious software or intruders. The most part of web applications or web server-extentions are not structured with a secure criteria, so the number of attacks to them is increasing. As a consequence, well known Network and Host based Intrusion Detection Systems (N-IDS and H-IDS) (e.g., see [1], [2]) are not appropriate in this situation. We need Intrusion Detection and Prevention Systems at Application level (A-IDS and A-IPS) that are specifically designed to reveal and prevent intrusions to web applications. Concerning intrusion detection, in literature there are three possible approaches:
- Misuse Detection - current requests are compared with malicious requests stored (as signatures) into a knowledge base. Unfortunately, it is really difficult to mantain up-dated the signatures because of the high number of new vulnerabilities daily discovered. This produces a lot of false negatives (FN).
- Anomaly Detection - current requests are compared with the (previously stored) normal behavior in order to reveal anomalies. This approach has the disadvantage that it is difficult to establish what is the normal behavior and, thus, it produces a lot of false positives (FP).
- Misuse+Anomaly Detection - in order to avoid the above problems, misuse detection may be complemented with anomaly detection. This should reduce both FP and FN. In literature, such possibility has been analyzed by E. Tombini et al. [3]. This work points out as for web application it is better to have the misuse-based module at the first stage and the anomaly-based component at the second stage. Indeed, the solution with the anomaly-based element at the first block has three advantages: it filters a high percentange of true negative, it has a low computational cost (the misuse component is used
only for a restricted number of cases), it has few false positives thanks to the misuse component. Nevertheless, this solution has an high number of disadvantages for a web-application, that is our target: we have a relative high number of false negatives because of attacks not revealed by the anomaly component are not processed by the sec-ond module; an event detected as dangerous by the misuse component is processed again by the anomaly module; events that are not correctly recognized are classified at the highest level of danger. On the other hand, the second solution that uses the misuse-based component at the first block presents the following advantages: great reactivity, since the misuse based component filters the attacks in an efficient way; a good solution for conflicts about events not well recognized by the anomaly and misuse modules: in the first case they are classified like true positive and in the second case like false positive; a low number of false negatives; and the anomaly based component doesn’t need to process again an event classified dangerous by the first module. This solution has only two disadvantages: the relative high number of false positives and a high computational cost. Nevertheless, these problems can be easily minimized. The number of false positive may be reduced by means of an appropriate configuration of the anomaly based component. Moreover, the computational cost is critical only for in-line systems, while for on-line systems may be acceptable a little delay.
Concerning misuse detection systems, their study began with J. Anderson’s work in 1980s on categorizing threats [4]. He proceeded to suggest ways to detect these threats by associating the threats with abnormal and known suspicious patterns in the audit trail. This is based on the assumptions that misuse behavior exhibits distinguishable patterns from normal usage behavior and that these pat-terns are reflected in the audit trail. Since then, several misuse detection systems have been proposed (e.g., see [1], [2]).
F i r e w a l l P r e v e n t i o n
S y s t e m A d m i n i s t r a t o r A n o m a l y
D e t e c t o r M i s u s e
D e t e c t o r
U p d a t e
E M
M
A M
i
u u u
A Ms u
Ai F P
F N
W e b - I P S
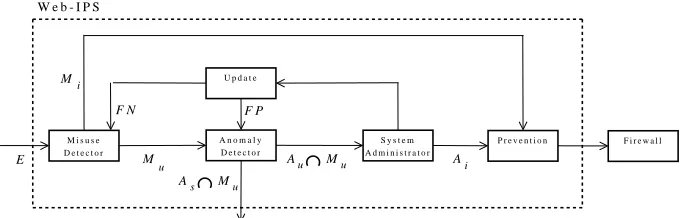
Fig. 1. System architecture.
to system applications. H. Feng, et al. [9] improved the static analysis for intrusion detection using PDA (push-down automaton). A limitation of all the above works consists of the fact that they deal with static applications: applications that do not change their behavior. This makes relatively easy identifying anomalies. In the case of web applications, we have dinamic entities and their behavior is strictly depending on the interaction with the users. In this respect, it is noteworthy the work by C.Kruegel, et al. [10] where the authors proposed statistical and probabilistic techniques.
Concerning the integration of anomaly based and misuse based techniques, Cisco Systems [11] and Real Secure [12] adopted this approach in their commercial systems, but the anomaly component plays a marginal role in such systems that still are basically misuse detection applications.
Finally, intrusion prevention systems integrates an intru-sion detection component with a module that can react, in real-time, to block or prevent intrusions [13]. Intrusion prevention systems (IPS) evolved in the late 1990s to resolve ambiguities in passive network monitoring by placing detection systems in-line. Early IPS were IDS that were able to implement prevention commands to firewalls and access control changes to routers (e.g., see [2]). The brief analysis reported above has had two conse-quences to this work: First, we have adopted an architec-ture in three stages: Stage 1 consists of a misuse detection module; Stage 2 consists of an anomaly detection module; Stage 3 consists of a prevention module. Second, we have mainly focused on anomaly detection algorithms and carefully designed the corresponding module since it is the most critical part of the system. Third, we have a specific module for updating both the anomaly model and the misuse model (i.e., updating the signature base) according to the feedback received by the security manager. This allows us to improve the sensitivity of the system and to reduce the number of false alarms. The paper is structured as follows: Section II provides an overview to system architecture. Sections III and IV describe the misuse and anomaly detection model, respectively. The prevention model is presented in Section V. Section VI reports some experimental results. Finally, some conclusions are discussed in Section VII.
II. OVERALLDETECTIONMODEL
Our system analyzes on-line a temporal series of HTTP requests as logged by most common web server (for example, Apache [14]). The analysis deals with both GET and POST requests to HTML pages, server-side programs, or active documents. The system architecture is depicted in Figure 1. The system input is a requestR, extracted from web server access log file. A request R
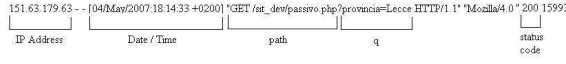
can be expressed in several ways depending on custom web server logging directives. In our work, we assumed that requests were logged in the Common Log Format (CLF) or Extended Common Log Format (ECLF). In these formats the most important features logged by web server are the IP source address, the date and the time of the request, the path to the desired web page (path), and sometimes an optional query string (q). The query string is used to eventually pass parameters to the referenced script and it is identified by the character ”?”. A generic query string normally consists of an ordered list of n pairs of parameters with their corresponding values, so q can be expressed as q = (p1, v1),(p2, v2), ...,(pn, vn) wherepi∈P (P is the set of all parameters) andvi is a string. Another important feature is the status code of the request. Figure 2 shows an example of a request logged by a web server in ECLF format, where elements used in the analysis are underlined.
Let E be the set of events, i.e. the set of requests R
conse-Fig. 2. A web server access log entry.
quence, our system can be configured in such a way to let system administrator manually interpret these events. When she/he considers the request a false positive, the anomaly model is updated, the misuse model is updated (by adding a new signature), otherwise. When an alarm is returned, either by the misuse component or by the anomaly component, the prevention component tries to automatically apply some prevention rules in order to block the communication with client that generated the intrusive event. This means changing rules of a firewall.
III. MISUSEDETECTIONMODEL
The misuse detection component is used to detect known malicious HTTP requests and report them as attacks. For example, the presence in the request of the word ”SELECT” or ”WHERE” could be used to detect an attempted incorrect use of SQL commands to retrieve sensible data. The misuse detection process uses a list of regular expressions, which items represent manifestations of the most common attacks. These regular expression are used to match against the analyzed request and an alarm is returned when a match occurs. We used the Java regex package to implement the mechanism of pattern matching, which is conformant with Level 1 of Unicode Technical Standard #18: Unicode Regular Expression Guidelines [15], plus RL2.1 Canonical Equivalents. Currently, the basic list contains about 70 regular expressions, but con-sider that the system administrator can add new signatures (new regular expressions) as explained in Section II. The new regular expression is automatically generated from the request without stopping system execution. Regular expressions are compiled at run-time, before the matching process starts. The list of regular expressions is specified into a text file, in an XML-based format. For example, see the following expression:
<signatures>
<expression name="Cross-site Scripting">.*(script)+.* </expression>
<expression name="Directory Trasversal">.*(\.\./)+.* </expression>
<expression name "SQL Injection">.*
(select|insert|update|delete|union|--)+.* </expression>
[...]
</signatures>
At this time, the automatic generation of a signature is made simply adding the tagged request at the end of the list of regular expressions.
IV. ANOMALYDETECTIONMODEL
The anomaly detection component provides a model of the ”normal behavior” of users and applications. The basic assumption is that, in case of intrusive actions, the behavior of users or applications differs substantially
from normal behavior and this difference can be ex-pressed quantitatively. The behavior of software entities in web applications is very dinamic and it is strictly connected with user interaction, which often governs the visualization process of data and informations through the choice of a set of values associated to some parameters. Additionally, each web application is different from others in terms of number and type of parameters to elaborate. Our approach was initially based on the model proposed by C.Kruegel, et al. [10], which uses several different evaluations about requests, parameters and their relation-ship to detect anomalous entries. An evaluation is a set of statistical procedures used to evaluate a certain feature of a request. A feature can be related to a single parameter of a query string (e.g. the string length of a particular parameter value), to all the parameters (e.g. the order of parameters in a query string), or to some relationships between a request and others related to a specific web page or script r (e.g. number of requests in a time slot). Our model differs from Krueger et al. model since we used only six feature evaluations and different statistical tools.
• Length of parameter values
• Distribution of characters in parameter values
• Presence of enumeration–type parameters
• Presence/absence of a given parameter in a request • Parameter order in a request
• Access frequency to a web resource
The model operates in three distinct steps: learning, tuning, and detection.
Learning. The learning phase works for establishing the normal behavior on the base of a training set. In other words, the goal is the definition of a profile (P) for each web page/script. The six features are evaluated on a “sufficiently” large set of normal access requests to a web page/script (first 1000 in our implementation) in order to build the related profile. For this purpose we used historical access log data files, gathered from the system administrator of a small Italian company. For each feature, we estimate the corresponding probability distribution; i.e., what is the probability of observing a certain value for a given feature in a request. The feature evaluations and the corresponding probability distributions contained in a profile are reported in Table I. Notice that the evaluation of feature # 6 is computed considering the requests altogether.
TABLE I WEB PAGE/SCRIPT PROFILE.
e Request Features Measures Probability Distribution # of Requests 1 Length of parameter values Mean (µ), Variance (σ2) Cantelli Inequality 1 2 Distribution of characters in parameter values Mean (Ei) χ2Distribution 1
3 Parameters of type Enumeration Correlation (ρ, g, f) Degenerate Distribution 1 4 Presence/absence of a parameter Parameter Sets (Sq) Degenerate Distribution 1 5 Parameter order in a request Adjacency Matrix (M) Degenerate Distribution 1 6 Access frequency Mean (µ), Variance (σ2) Cantelli Inequality all
score (N S(rP)) of each requestrP in the training set, as follows:
N S(rP) =
6 X
e=1
we·(1−pe(rP)) (1)
Concerning the above formula, we have to take into account the following remarks. First, when rP contains several parameters pr1, . . . , prn, for e = 1, . . . ,4, we have pe(rp) = min
n
i=1pe(rp, pri), where pe(rp, pri) is the probability for the single parameterpri. This allows us to avoid that a malicious user hides a single invalid input into a series of valid inputs. Second, p6(rP) is computed taking into account all the requests received in the last 24 hours before request rP. Third, when we have a script without parameters, the profile P contains only two evaluations:e= 4 ande= 6.
Finally, for each web page/script (profile P), we set the initial anomaly score threshold, as follows:
T0(P) = max
rP N S(rP) (2)
Detection. Intuitively, in the detection phase we compute the anomaly score of a given request and compare it with the score obtained in the tuning phase: the higher is the anomaly score, the farer away is the behavior from the normal behavior. The anomaly score (AS(qP)) for the current request qP to the web page/script with profileP is computed as follows:
AS(qP) =
6 X
e=1
we·(1−pe(qP)) (3)
The anomaly score is computed taking into account the same remarks reported above for the normal score. After that, the anomaly detection module takes a decision according to the following rule:
• WhenAS(qP)< T0(P),qp is a normal request.
•WhenAS(qP)≥T0(P), an alert is sent to the security
manager.
- If the security manager does NOT validate the request,
qp is an anomaly request (qp∈Ai).
- If the security manager validates the request, thenqpis a normal request and the anomaly model must be modified. This means that a new threshold must be set. The update module sets T1(P) =AS(qP).
LENGTH OF PARAMETER VALUES. The intuitive idea
is: “when a parameter value is too long, it is an anomaly”. Indeed, for example, to overflow a buffer in a target application, an intruder needs to send a large amount of data, depending on the length of the buffer. In the training phase the goal of this evaluation is to approx-imate the actual but unknown distribution of parameter
lengths, so in the detection phase, the system can detect instances that significatively deviate from the observed normal behavior.
Learning: The length of values associated with a certain parameter in a request can be expressed as a random variable. Therefore, it is possible to estimate the corre-sponding mean valueµand varianceσ2associated with it,
by calculating the sample mean and the sample variance for the lengthsl1, l2, . . . , lh of the values in the training set associated with the given parameter (assuming that in the training set we have h requests with that parameter). The cost of this evaluation is proportional to the number of requests analyzed during the learning phase plus a constant term to compute the mean and the variance. Tuning & Detection: In tuning and detection phases, we need to compute the probability of having a certain length l. This process must take into account that, in several cases, the length of a parameter value may have a large variance. Furthermore, a parameter value whose length is less than the mean valueµ, can be considered normal (p(l) = 1). Indeeed, we are looking for anomalous requests in which a large amount of data is injected in one or some values. An estimation method that satisfies the above requirements is provided by the Cantelli Inequality [16].
p(l) =
1 l≤µ
σ2
σ2+(l−µ)2 l> µ
(4)
Equation (4) is an efficient metric to model decreasing probabilities for lengths greater than a given mean value. It establishes an upper bound for such a probability.
DISTRIBUTION OF CHARACTERS IN PARAMETER VAL
often decrease extremely fast. This can be the result of a certain padding character that is repeated many times in a buffer overflow attack or of many occurrences of the dot character in a directory traversal attempt. Therefore we assume that the character distribution of a value is represented by the array of its relative frequencies sorted in descending order.
Learning: For a given parameter, for each value contained in the training set, we count the number of occurrences of each character. Afterward, we compute the mean fre-quency of each character for all the values in the training set and sort the characters in descending order. We group the characters in six intervals defined as follows: [0], [1, 3], [4, 6], [7, 11], [12, 15], [16, 255]1. Thek−th character
in the descending order belongs to interval i = [a, b] if and only if a≤k < b. For each interval i, we compute the mean frequency Fi of characters in the interval. The cost of building this model is linear in the number of parameters that are analyzed during this phase. For each parameter, establishing the character distribution has a cost that is proportional to the length of its value string. Tuning & Detection: In tuning and detectionn phases, we we need to compute the probability of having a certain character distribution. First of all, for each value, we count how many characters of a given interval i we have, we denote this number with Oi. We then compute χ2 as reported in Equation (5).
χ2= 5 X
i=0
(Oi−Ei)2 Ei
(5)
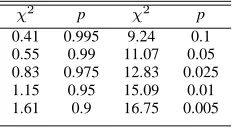
whereEi=Fi·landlis the length of the analyzed value. Afterward, we apply the Pearson χ2 statistical test [16]
to estimate the probability. The probability is read from a predefined table (Table II) using χ2 and the degrees
of freedom. The degrees of freedom are calculated as
(number of intervals - 1) = 5.
TABLE II
PROBABILITY VALUES FOR5DEGREES OF FREEDOM
χ2 p χ2 p
0.41 0.995 9.24 0.1
0.55 0.99 11.07 0.05
0.83 0.975 12.83 0.025
1.15 0.95 15.09 0.01
1.61 0.9 16.75 0.005
PRESENCE OF ENUMERATION–TYPE PARAMETERS. The
intuitive idea is: “when we have a parameter of type enu-meration, we can admit only values in the enuenu-meration, we have an anomaly, otherwise; when the parameter is not of type enumeration, we can admit all the values”. As a consequence, first of all we have to establish whether the parameter is of type enumeration; in other words, whether the values of such a parameter are drawn from a limited set of possible alternatives (i.e., ”checkbox”, ”radio”, or ”select” HTML input types). When a malicious user attempts to use these parameters to pass to the analyzed
1We assume to use the ASCII code, i.e. a 8 bits code.
script values that are not in the trusted set, the intrusion attempt can be detected. When an enumeration type can not be identified for a certain parameter, it is assumed that the parameter values are random and no attacks can be detected by this evaluation.
Learning: The goal of this phase is to establish whether the parameter is of type enumeration; if so, we have to build the set V of legal values for that parameter. Intu-itively, when the set of values observed for that parameter in the training set is (almost) time-invariant (after a short transitory phase), this is a clue that the parameter is of type enumeration. When the set of values is growing proportionally to the number of analyzed requests in the training set, this suggests that the parameter is not of type enumeration. Formally, we proceed as follows: 1) We associate a progressive number x(vi) to each value vi encountered during this phase. 2) We build the set Vh = {v1, v2, ..., vn} of values encountered till the hth request in the training set. 3) Letvthe value contained in thehth
request, we build two auxiliary sequencesf and
gas follows:
fh(x(v)) =x(v) (6)
gh(x(v)) =
gh(x(v)−1) + 1 v∈Vh gh(x(v)−1)−1 v /∈Vh
0 x(v) = 0
(7)
Afterward, for each parameter we compute the correlation parameterρ:
ρ= p Covar(f, g)
V ar(f)·V ar(g) (8)
If ρ < 0, then we have an enumeration type parameter and V = Vlast (i.e., Vh when h is the last request in the training set) is the set of legal values. Ifρ≥0, it is not an Enumeration Type Parameter The cost of building this model is strictly connected to the calculation of the covariance between these two simple functions. This cost depends on the number of analyzed requests.
Tuning & Detection: In tuning and detection, we need to estimate the probability that a given parameter has the current value. For enumeration-type parameters, we use a degenerative distribution, let v the current value,v∈V is considered a normal behavior (p(v) = 1), it is an anomaly otherwise (p(v) = 0), formally:
p(v) =
1 v∈V
0 v∈/V (9)
For non enumeration-type parameters, the system must accept any value, namely:
p(v) = 1 (10)
PRESENCE/ABSENCE OF A GIVEN PARAMETER IN A
REQUEST. The intuitive idea is: “when a mandatory
a parameter must be present, its absence in a request is an anomaly; 2) when a parameter must be absent, its presence in a request is an anomaly; 3) any other situation can be considered a normal behavior.
Learning: the goal of this phase is to estabilish whether a script has mandatory parameters and, if so, to create a model of acceptable subsets of parameters that appear simultaneously in a query string. This is done simply by storing each distinct subset SrP = {pi, ..., pk} of parameters for each request rP in the training set. As a consequence, each subset SrP contains the parameters that appear simultaneously in request rP. Afterward, the system adopts the following decision rules:
1) When all the requestsrP contain parameters (SrP 6=∅, for each rP), the web page/script P “MUST” contain parameters.
2) When only some requests rP contain parameters, P “MAY” contain parameters.
3) When no request contains parameters (SrP = ∅, for each rP),P “MUST” contain “NO” parameters. Tuning & Detection: In tuning and detection phase, we proceed as follows: Let S(qP) the set of parameters in the current requestqP.
• The request MUST contain parameters: if there exists
rP s.t. S(qP) = SrP, then qP is a normal request, otherwise, it is an anomaly.
• The request MAY contain parameters: each request is a normal request.
• The request MUST contain NO parameters: if
S(qP) =∅, then qP is a normal request, otherwise, it is an anomaly.
PARAMETER ORDER IN A REQUEST. The intuitive idea
is: “legal requests often contain the same parameters in the same order, we have an anomaly otherwise.”. Indeed, hand-crafted requests, as the requests by a malicious user, may have parameters in an arbitrary order.
Learning: The order relationship among all the k param-eters of a legitimate query string are determined during this phase. We assume that a parameter pt of a script precedes another parameterpsif and only if there exists SrP such thatpt, ps∈SrP andptcomes beforepsin the parameter list of queries where they appear together. In order to store this relationship, we use a matrix M of (s x s) elements, where s is the total number of parameters associated with the analyzed script and Mij = 1 if pi precedes pj, 0 otherwise. MatrixM is built as follows: 1) The initial value is set to 0, i.e.,Mij = 0for eachi, j. 2) For each requestrP in the training set, letp1, p2, ..., pn be the sequence of parameters in rP, for each i, j such that0 < i≤j ≤n, we set Mij = 1. Notice that, often we have Mts 6= Mst, but sometimes, when pt and ps appears in both the orders in different requests, we have
Mts=Mst. The cost of building this profile is not high, because the total number of parameters processed by a generic script is usually relatively small.
Tuning & Detection: In tuning and detection phases, the system checks whether the parameters of a request
sat-isfy the order constraints determined during the learning phase.
Let qP be the current request, let p1, p2, ..., pn be the sequence of parameters inqP.
•If for eachi, j such that0< i≤j≤n,Mij = 1, then it is a normal request (p(qP) = 1).
•If there existsi, jsuch that0< i≤j≤nandMij= 0, then it is an anomaly (p(qP) = 0).
ACCESS FREQUENCY TO A WEB PAGE OR SCRIPT. The
intuitive idea is: “when a web page/script receives too much/too less requests, it is an anomaly.”. Indeed, differ-ent web pages/scripts normally are invoked with differdiffer-ent frequencies. Monitoring a specific web page or script in a sufficiently long time interval, one can observe that the access frequency remains relatively constant. It is possible to distinguish between two types of access frequencies for each web page or script. The first one is the frequency based on accesses from the same client (we used the IP address). The second one is the frequency based on accesses from all the clients. When a malicious user attempts a DoS (Denial of Service) exploit for a certain script, the number of accesses observed in a short time interval from that client can increase drastically. Similarly, the frequency of all accesses can grow fast in case of DDos (Distributed DoS). Furthermore, when an attacker probes the system looking for vulnerabilities or tries to guess parameter values, it sends several requests in a short time interval. Therefore, any change in access frequencies with respect to frequencies observed in the learning phase can indicate an intrusion. Learning: The objective of this phase is to build a model of normal access frequencies for each web page or script. To determine the expected normal access frequencies, the time period between the first and the last request in the training data set is divided into consecutive time intervals of a fixed size (60 seconds in our implementation). Afterward, for each interval, we count how many accesses there are for each client (sender IP address) and how many accesses there are globally (from all the clients). The access frequency for each IP and the overall access frequency can be considered as random variables, with their own means and variances (µI P, σ2I P andµ, σ
2respectively). These values represent
the normal requests to the web page or script. The cost of building this profile is proportional to the number of requests that are analyzed during the training period. Tuning & Detection: In tuning and detection we have to estimate the probability that the access frequency in the current time interval. Therefore, time is divided into intervals of the same lenght usedin the learning phase (i.e., 60 sec.). LetqP be the current request.
We compute:
• f1 (the frequency in the current time interval of
accesses to P from the same sender of the current request) and
• f2 (the frequency in the current time interval of
accesses toP from any sender).
Fig. 3. Repeated failed access prevention process.
• P r(f1)(the probability of having a frequencyf1
es-timated by means of the Cantelly Inequality applied toµI P andσ2I P) and
• P r(f2)(the probability of having a frequencyf2
es-timated by means of the Cantelly Inequality applied toµ andσ2)
Afterward, we can compute the overall probability as follows:
p6(qp) =
2 X
i=1
ui·P r(fi) (11)
where ui are weights initially set to 1/2 that can be adjusted by the security manager.
V. PREVENTIONMODEL
The intrusion detection system described above is equipped with a rule generation engine, in order to automatically stop the communication between the in-truder and the analyzed web server in cooperation with a firewall. This software module starts its execution af-ter the occurrence of certain events and if this process completes succesfully, an access deny rule for this client will be added to firewall access rules. We used two event generator models to drive the rule generation process, the evaluation of repeated failed accesses to the server (HTTP response status code≥400) and the evaluation of a parameter value type and length (e.g., buffer overflow attempts).
REPEATED FAILED ACCESS. The repeated failed access
scenario checks if there are multiple client errors, includ-ing failed authentication attempts, from a particular client or subnet. This type of activity is a strong indication that a malicious user is attempting to probe the web server to gain information for future attacks. In order to perform this type of evaluation, we need to count the number of subsequent wrong requests and define two other evaluation parameters: the maximum number of repeated failed accesses (threshold) that are allowed and the time interval (timeout) above which the intrusion attempt can be considered terminated. This process can be represented as a statechart, as depicted in Figure 3. When a wrong request is perfomed by a certain client, a new instance identified by the IP address of this client is created. If a timeout occurs the instance is removed,
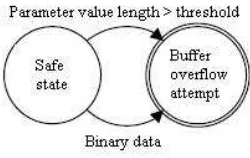
Fig. 4. Buffer overflow prevention process.
otherwise any subsequent wrong request increments the count of failed accesses and resets the time counter. If the threshold is overreached, a deny rule is generated and added to the firewall. IP spoofing cannot be handled with this process.
BUFFER OVERFLOW ATTEMPT. The presence of binary
data in a request or an extremely long request are strong indications of an attempt to exploit a buffer overflow. When one of these two situations have been detected, a deny rule is generated and added to the firewall. This process can be represented as a statechart, as well, see Figure 4. Notice that when a buffer overflow exploits a vulnerability in the web server code, it may be possible that a log entry would never be created and the attack would go undetected.
VI. EXPERIMENTALRESULTS
System evaluation has been performed by gathering on-line (in two different experiments) real data from the main web server of an Italian company, SIMobile s.r.l. (www.simobile.it). The IPS has been configured and integrated with the web architecture (e.g., operating system, web server, DBMS), by installing it as a service.
LEARNING& TUNING. The learning and tuning phases
have been performed off-line, by means of analyzing a database of historical legitimate HTTP/HTTPS requests. We used them to model the normal system behavior. In our experiments, the weightwe of Equation (1) has been set to1/6 = 0,167. Table III shows relevant data about the learning set.
TABLE III LEARNING SET DATA
Time interval Log size # of requests # of profiles
165 days 16 MByte 87284 260
DETECTION. We experimented the detection phase for
55 days and evaluated systems by means of appropriate metrics. The system has been evaluated by analyzing on-line the HTTP/HTTPS traffic towards the monitored web server. The weight we of Equation (3) has been set to
TABLE IV LEARNING SET DATA
Sensitivity (Sen) T PT P+F N
Specificity (Spe) T NT N+F P
Positive predictive value (PPV) T PT P+F P
Negative predictive value (NPV) T NT N+F N
Prevalence (Prev) T P+F NT P++F NF P+T N
False Positive Rate (FPR) T NF P+F P = 1−specificity
False Negative Rate (FNR) F NF N+T P = 1−sensitivity
Obviously, the test has an high degree of effectiveness when the false positive/negative rate is close to 0. Table V reports the results of one of the two experiments. The
TABLE V EVALUATIONS RESULTS
Monitoring days 55 alerts 28 Sen 1
Request logged 18894 TP 17 Spe 0,997
Suspicious events 28 TN 3655 FPR 0,003
Intrusive events 17 FP 11 FNR 0
FN 0 PPV 0,607
Prev 0,0046 NPV 1
number of false negatives can not be calculated automat-ically since it represents the cases when the system fails to identify a potential intrusive behavior. Therefore, the number reported in Table V has been computed day by day, with the help of the system administrator, whose task was to identify potentially strange requests not signaled by the system (about 18894 / 55 = 343 requests per day).
VII. CONCLUSIONS
In this work, we considered the security problem of web-applications and the application of Intrusion Prevention Systems to this kind of systems. We proposed a model that improves the previous model proposed by [10]. In this model, we combined an anomaly detection ap-proach with a misuse detection apap-proach and a prevention model. Indeed, the best way to reveal web application attacks is to use the precision of signature based systems with the flexibility of anomaly detection systems and to solve problems coming from the combination of two approaches. Concenrning anomaly detection, we obtained a great advantage combining different evaluation systems to cover the great number of attack typologies. The model proposed does not need any specific configuration, but only a training period. We implemented this model in a IPS that we experimented in a real context. Table
TABLE VI
IPS COMPARISON
Sistem Sensitivity FP/ # logs DATA
Our IPS 100% 0,02% - 0,06 % Real Data
[10] 100% 0,002% - 1,45% Simulated
[19] n.a. 0,069% Real Data
VI shows that our results are comparable with the main reference work [10] in terms of false positives, even if in the worst cases, the system proposed in [10] has the ratio FP/ # logs worse than our system. Nevertheless, notice that their results came from a simulation, whereas we
applied our IPS to a real company network. Furthermore, the Positive Predictive Value is about 60 %, that is a tipical value of PPV for IDS/IPS, as described in [18] and [17]. False positives in particular, occured in the first days of monitoring and then decreased, as consequence of adjusting detection thresholds.
REFERENCES
[1] P. A. Porras and P. G. Neumann, “EMERALD: Event monitoring enabling responses to anomalous live disturbances,” in Proc. 20th NIST-NCSC National Information Systems Security Conference, 1997, pp. 353–365.
[2] M. Roesch, “Snort: Lightweight intrusion detection for networks,” in Proceedings of the 13th Conference on Systems Administration (LISA-99). Berkeley, CA: USENIX Association, Nov. 7–12 1999, pp. 229–238.
[3] E. Tombini, H. Debar, L. Me, and M. Ducasse, “A Serial Combi-nation of Anomaly and Misuse IDSes Applied to HTTP Traffic,” in Proceedings of the Twentieth Annual Computer Security Appli-cations Conference, December 2004.
[4] J. Anderson, “Computer Security Threat Monitoring and Surveil-lance,” James P. Anderson Co., Fort Washington, Pennsylvania, Tech. Rep., April 1980.
[5] D. Denning, “An intrusion detection model,” IEEE Transactions on Software Engineering, vol. 2, no. 13, pp. 222–232, 1987. [6] A. Ghosh, J. Wanken, and F. Charron, “Detecting anomalous
and unknown intrusions against programs,” in Proceedings of the Annual Computer Security Application Conference (ACSAC), vol. AZ, December 1998, pp. 259–267.
[7] L. Portnoy, E. Eskin, and S. Stolfo, “Intrusion detection with unlabeled data using clustering,” in Proceedings of ACM CSS Workshop on Data Mining Applied to Security, Philadelphia, PA, November 2001.
[8] T. Lane and C. Brodley, “Temporal sequence learning and data reduction foranomaly detection,” in Proceedings of the ACM Conference on Computer and Communications Security, San Fran-cisco,. ACM Press, 1998, pp. 150–158.
[9] H. Feng, J. Giffin, Y. Huang, S. Jha, W. Lee, and B. Miller, “Formalizing sensitivity in static analysis for intrusion detection,” in Proceedings of the IEEE Symposium on Security and Privacy, Oakland, CA,, 2004.
[10] W. Robertson, G. Vigna, C. Kruegel, and R. Kemmerer, “Using Generalization and Characterization Techniques in the Anomaly-based Detection of Web Attacks,” in Proceeding of the Network and Distributed System Security Symposium (NDSS), San Diego, CA, 2006.
[11] Cisco, “Cisco intrusion prevention system,”
http://www.cisco.com/en/US/products/sw/secursw/ps2113/index.html, Tech. Rep.
[12] IBM, “Ibm internet security sytems
proven-tia network intrusion preventionsystem,”
http://www.iss.net/products/product sections/Intrusion Prevention.html, Tech. Rep.
[13] B. Foo, M. Glause, G. Modelo-Howard, Y.-S. Wu, S. Bagchi, and E. Spafford, Information Assurance: Dependability and Security in Networked Systems. Morgan Kaufmann Publishers, 2007, ch. Intrusion Response Systems: A Survey.
[14] A. S. Foundations, “Apache http server log files,”
http://httpd.apache.org/docs/2.2/logs.html, Tech. Rep.
[15] M. Davis, “Unicode technical standard 18, unicode regular expres-sions,” http://www.unicode.org/unicode/reports/tr18, Tech. Rep. [16] L. Devroye, Non-Uniform Random Variate Generation.
Springer-Verlag, New York, 1986.
[17] A. Cardenas, J. Baras, and K. Seamon, “A framework for the evaluation of intrusion detection systems,” in IEEE Symposium on Security and Privacy. Berkeley/Oakland, California: IEEE Press, 21-24 May 2006.
[18] G. Gu, P. Fogla, D. Dagon, and W. Lee, “Measuring Intrusion Detection Capability: An Informmation-Theoretic Approac.” in ACM Symposium of InformAction, Computer and Communications Security(ASIACCS06), March 2006.