ISSN (e): 2250-3021, ISSN (p): 2278-8719
Vol. 07, Issue 09 (September. 2017), ||V2|| PP 69-77
Performance evaluation of alternatives using multiple attribute decision
making methods
Darji V. P
1*Rao R V
21*, 2
Department of Mechanical Engineering, S. V. National Institute of Technology, Surat 395 007, Gujarat, India
Abstract: The best alternative selection in the field of manufacturing is a critical task for decision maker(s). Finally, comparisons are made with the results obtained by the previous researchers using different decision making methods from relevant literature.
--- --- Date of Submission: 06-09-2017 Date of acceptance: 25-09-2017 ---
---I. Role of decision making in manufacturing
For the manufacturing industry, production performance is very important in the highly competitive environment. Superior production performance often leads to competitiveness. Performance indicators reflect the competitiveness of a firm, and thus must be carefully identified in the evaluation process. Doyle (1994) presented that the traditional financial performance indicators, such as firm revenue, market share, and return on investment (ROI), are widely accepted as representative measures of firm performance. Wheelwright (1978) identified efficiency, dependability, quality and flexibility as the important attributes for manufacturing performance evaluation. Corbett and Claridge (2002) discussed that for manufacturing companies, the competence is much affected by its manufacturing capabilities. Manufacturing capability is a company‟s ability to deliver product to customers on time.
The following sections describe two important case studies to demonstrate and validate the applicability and usefulness of the decision making methods.
1.1 Selection of manufacturing plant: Case study 1
Several studies had investigated key indicators for manufacturing performance identified performance measures for world class operations encompassing efficiency, productivity, quality, material management, advanced technology, facility control, flexibility, price/cost leadership, and global competitiveness. In the present study the evaluation of manufacturing plant is carried out by considering the data used by Yu and Hu (2010). The case company, founded in 1971, was the world‟s largest manufacturer of switch power supplier and DC brushless fans, as well as a major source of power management solutions, components, visual displays, industrial automation, networking products, and renewable energy solutions.
The five manufacturing plants under the management of power system I and power system II were: switch power (A1), telecom power (A2), AC/DC converters (A3), uninterruptible power systems (A4) and AC/DC adapters (A5). Taking into consideration the key performance index for manufacturing plants, the company selected five dimensions to be the main evaluation attribute for the performance evaluation of their manufacturing plants. These factors described by Yu and Hu (2010) are given below:
Productivity (C1) reflects the input resource utilization of a firm, which is obtained by dividing the production outputs by the number of input resources. Productivity has important implications for organizations. For non profit organizations, higher productivity translates into lower cost. For a profit-oriented organization, productivity is an important factor in determining the competitiveness of the company.
1.1.1 Data pertaining to the selection problem
Production amount (C2) is the monetary value of the products produced per hour by manufacturing plants. Normally, the higher the production amount, the greater is the revenue of a firm. The production amount may also be regarded as an alternative measure for the throughput. The case company opted to use production amount because the products of different plants vary in size, production time, and price. Thus production amount seems to be a more appropriate measure. Production costs represent the capital devoted to the production process in a manufacturing firm, including labors cost, materials cost and overhead.
Inventory amount (C4) measures the inventory level of a manufacturing firm in monetary term. Effective inventory management may reduce inventory-related cost and increase turnover rate which in turn increases manufacturing flexibility.
Quality cost (C5) (quality) represents various costs associated with quality issues. These costs can be classified into three categories: internal failure cost, external failure cost, and prevention cost. In general, the production performance may increase when quality cost decreases. C1, C2 are beneficial attributes whereas C3, C4, C5 are taken as non-beneficial attributes. The five manufacturing plants are evaluated using various methods and results are compared. Table 1 shows the performance rating for five plants.
Table 1. Aggregate performance rating for manufacturing plants (Yu and Hu, 2010)
Attribute C1 C2 C3 C4 C5
A1 0.4799 0.4765 0.5420 0.5734 0.3015
A2 0.4679 0.4360 0.4655 0.4207 0.3372
A3 0.4642 0.4524 0.3406 0.4222 0.3952
A4 0.4109 0.4029 0.4490 0.3539 0.5223
A5 0.4080 0.4647 0.4057 0.4113 0.5238
Weights 0.2535 0.2579 0.2041 0.1500 0.1345
C1: productivity; C2: production amount; C3: production cost; C4: inventory amount and C5: quality cost. A1: switch power manufacturing plant; A2: telecom power manufacturing plant; A3: AC/DC converters manufacturing plant: A4: uninterruptible power systems plant and A5: AC/DC adapters manufacturing plant.
1.1.2 Computational steps of EVAMIX method for case study 1
The method EVAMIX proposed by (Voogd, 1982, 1983; Nijkamp et al., 1990; Martel and Matarazzo, 2005; Chatterjee et al., 2011) is considered in this paper. A set of materials listed in Table 1 are distinguished based on ordinal and cardinal nature of the attribute values. The normalization for both beneficial and non-beneficial are carried out. Then dominance score of each alternative pair of manufacturing plant is calculated.
The differences of each alternative for each ordinal and cardinal attribute are carried out with respect to other alternatives. Then the dominance scores of each alternative pair, (i,i')for all the ordinal and cardinal attributes, standard dominance score, and overall dominance score is determined for each pair of alternative manufacturing plants. Finally, the appraisal score for alternative is computed using additive interval technique. Higher the appraisal score better is the performance of the manufacturing plant and tabulated in Table 2.
Table 2 Appraisal scores of alternative manufacturing plants
Manufacturing plants Si Rank
A1 0.478201 1
A2 0.155532 4
A3 0.274933 2
A4 0.022152 5
A5 0.220015 3
1.2 Computational steps of Extended TODIM method for case study 1
The extended TODIM method (Fan et al., 2013) is applied for best manufacturing plant selection. The format of crisp attribute values are transformed into the format of random variables with cumulative distribution functions. 12 F = 4679 . 0 4799 . 0 , 1 , 0 x x
Then the gain and loss matrices are determined and normalized. The dominance degree matrices concerning seven attributes are constructed and the overall dominance degree is calculated.
0 0.2240 -2.0739 -2.4982 -2.7267 -0.0301 0 2.0618 -2.4861 -2.7175 -0.2789 0.2773 0 1.3928 -1.7703 -0.3360 -0.3344 0.1873 0 1.0927 -0.3667 0.3655 0.2381 0.1470 0
In the above calculations, maximum weight Wr is 0.2579 and 1. This helps to understand that the losses will contribute with their real value to the global value. It can also be explained like that the non-beneficial attributes are globally to their real value. The overall dominance degree matrix is built and the overall values of the alternatives are calculated.
= 0 1.2684 -4.7976 -3.6676 -4.7968 -2.5014 -0 6.6946 -5.2321 -5.9380 -0.3779 -0.0184 0 1.4623 -3.0519 -2.1745 -0.9346 -2.3391 -0 2.7634 -2.9662 -2.7196 -3.5925 -2.2884 -0
The overall value of each alternative material is obtained and given by: ξ (A1) = 0.5387, ξ (A2) = 0.7859, ξ (A3) = 1, ξ (409M) = 0 and ξ (A5) = 0.3807. Table 3 shows the ranking order for each alternative manufacturing plants.
Table 3 Overall values of alternative manufacturing plants
Manufacturing plants Overall values Rank
A1 0.5387 3
A2 0.7859 2
A3 1 1
A4 0 5
A5 0.3807 4
According to the overall values, the ranking order of the five manufacturing plants is determined. The most suitable plant is A3, next is A2 and A4 is not found suitable for some specific type of production.
1.3 Computational steps of OCRA method for case study 1
In order to obtain ranking using OCRA method described by Chatterjee and Chakraborty (2012) the decision matrix is formed as shown in Table 4.
Table 4 Maximum value, minimum value and weights for case study 1 Manufacturing
plants C1 C2 C3 C4 C5
A1 0.4799 0.4765 0.542 0.5734 0.3015 A2 0.4679 0.436 0.4655 0.4207 0.3372 A3 0.4642 0.4524 0.3406 0.4222 0.3952 A4 0.4109 0.4029 0.449 0.3539 0.5223
Max. Value 0.4799 0.4765 0.542 0.5734 0.5238
Min. Value 0.408 0.4029 0.3406 0.3539 0.3015
Weights 0.2535 0.2579 0.2041 0.15 0.1345
Following the step wise calculations suggested by Chatterjee and Chakraborty (2012), the aggregate performance of the input or non-beneficial attributes are calculated. Based on the values obtained for the aggregate performance, the linear performance rating is obtained. Similarly for the beneficial attributes the aggregate performance and linear performance rating is determined, the overall preference rating for each
alternative manufacturing plants is calculated. The overall preference rating (Pi) is calculated and the values calculated are show in Table 5.
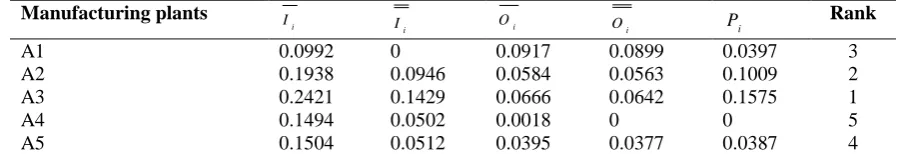
Table 5 Computational details of ranking of manufacturing plants
Manufacturing plants
i
I
i
I Oi Oi Pi
Rank
A1 0.0992 0 0.0917 0.0899 0.0397 3
A2 0.1938 0.0946 0.0584 0.0563 0.1009 2
A3 0.2421 0.1429 0.0666 0.0642 0.1575 1
A4 0.1494 0.0502 0.0018 0 0 5
A5 0.1504 0.0512 0.0395 0.0377 0.0387 4
The alternatives are ranked according to the values of the overall preference rating. The alternative with the highest overall performance rating receives the first rank i.e., manufacturing plant A3. The manufacturing plants A2, A1, A5 and A4 are ranked at second, third, fourth and last positions.
1.4 Computational steps of ARAS method for case study 1
Table 6 Optimality function values of manufacturing plants
Manufacturing plants Si Si(max) Ui R
A1 0.1995 0.9335 3
A2 0.2031 0.2138 0.9505 2
A3 0.2138 1 1
A4 0.1888 0.8833 5
A5 0.1947 0.9108 4
The ranking order resulted to select the A3 plant is most suitable for the selected component production. The last preference is given to manufacturing plant number A3.
The ranking obtained using different MADM methods in work are compared and shown in Table 12.
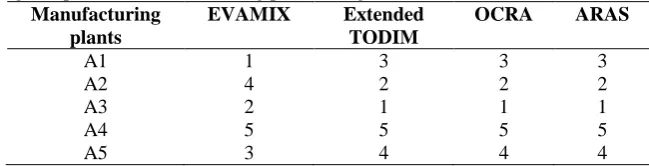
Table 12 Ranking comparison of manufacturing plants using different MAMD methods
Manufacturing plants
EVAMIX Extended
TODIM
OCRA ARAS
A1 1 3 3 3
A2 4 2 2 2
A3 2 1 1 1
A4 5 5 5 5
A5 3 4 4 4
It reveals from Table 12, that although the ranking for some of the alternatives is same as that suggested by few methods, it is not same for all the methods. So, in this case the ranking of the alternatives is not clear. The rankings obtained by the proposed extended TODIM, OCRA and ARAS are exactly matching with each other and also matching with the voting method proposed by Yu and Hu (2010). The first rank given by different MADM methods in the present paper and the different methods proposed by Yu and Hu (2010) is same. The spearman‟s rank correlation coefficient suggests A3 as the first choice. The final average rank of manufacturing plants is A3 > A2 > A1 > A5 > A4.
1.2 Case study 2: Supplier company selection for a given application
This example illustrates a real industrial case study based on supplier selection for the machinery of milk pasteurization process of a diary located in Gujarat, India. The dairy is in establishment stage of its own pasteurization plant. The pasteurization process increases the shelf life of milk. The dairy management is interested to select the best supplier from the available range of suppliers. The details of supplier companies for pasteurization process machinery are given below:
Supplier company1: This is emerged as a front-runner in the manufacture and supply of complete range of equipment for application in dairy, beverage, brewery and thermal management as well as packaging industries. The company's more than three decades of proven expertise, backed by five most modern manufacturing units and a qualified and trained manpower has positioned it as a trusted single-roof solution provider together with automation, equipment design and manufacture right up to installation and commissioning.
Supplier company 2: This company ventured into manufacturing of critical process equipment and systems with its own technical expertise and international association. Being a niche company in Project Engineering and Process Equipment manufacturing, it views on improving the efficiency of the machines by using upgraded systems and advanced technology. As a team it provides „precision engineered craftsmanship‟ of high tech processing equipment with prompt after sales service and technical assistance in the field of separation, homogenization, heat exchangers, cheese processing equipment and aseptic technology since 1998.
Supplier company 3: This is the world's leading food processing and packaging solutions company, working closely with the customers and suppliers. It provides safe, innovative and environmentally sound products that each day meets the needs of hundreds of millions of people.
Supplier company 5: This company is operating for nearly two decades, this supplier is one of the most well-known manufacturers and suppliers of dairy equipments. They have developed a wide range in compliance to the diverse needs of various industries such as beverage, dairy, bio-pharmaceutical and food processing industries. This has been possible solely because of their fully integrated manufacturing set up and latest process technology used in production. All the equipment and machines undergo extensive testing on various quality parameters such as durability, noise and vibration levels and others to ensure that these meet the specific functionality standards at client‟s end.
Supplier company 6: This group is a leader in heat transfer, separation and fluid handling. This firm is committed to play a vital role in areas that are crucial for society by saving energy and protecting the environment. Their service network is wide spread in India and abroad. Their technologies are extensively used in the fight for a better environment on land and at sea. The key technologies excel in energy-efficient heat exchangers, separators that separate liquids and removes particles from liquids and gases and equipment that safely transports and regulates fluids.
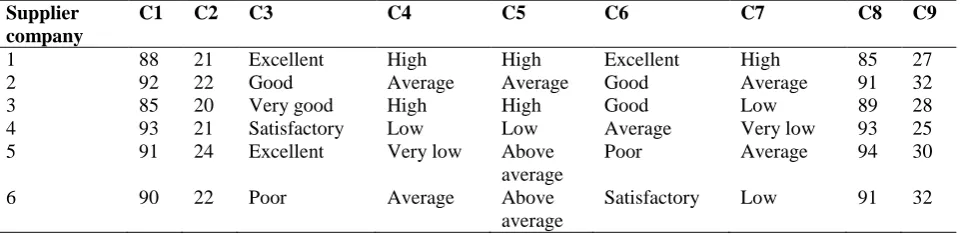
The data pertaining to the alternatives are collected and shown in Table 8.62. These are expressed in both crisp and linguistic terms. Nine attributes are short listed. These are: regeneration efficiency (C1), power consumption (C2), food safety and hygienic design (C3), maintenance cost (C4), availability of spares (C5), service after sales (C6), durability of machine (C7), through-put efficiency (C8) and cost of equipment (C9). Out of these nine attributes regenerative efficiency, food safety and hygienic design and through-put efficiency are most important attributes pertaining to the selection of best supplier.
The linguistic terms are converted into appropriate fuzzy number and then into crisp data using five point scale proposed by Chen and Hwang (1992). Later this scale was extended by Rao (2007) and validated by using various decision making situations in the manufacturing environment. C1, C3, C5, C6, C7 and C8 are beneficial attributes and C2, C4 and C9 are non-beneficial attributes. The crisp data for the suppliers of milk pasteurization machine selection are then presented in Table 13.
The weights are calculated using AHP method (Rao, 2007) and given in the last row of Table 13. The value of λmax is 10.1335, CI is 0.1417, RI is 1.45 and consistency ratio is equal to 0.0977. Consistency ratio of the pairwise comparison is less than 0.1. So the weights are consistent and they are used in the selection process.
Table 13 Supplier companies‟ data for milk pasteurization machine
Supplier company
C1 C2 C3 C4 C5 C6 C7 C8 C9
1 88 21 Excellent High High Excellent High 85 27
2 92 22 Good Average Average Good Average 91 32
3 85 20 Very good High High Good Low 89 28
4 93 21 Satisfactory Low Low Average Very low 93 25 5 91 24 Excellent Very low Above
average
Poor Average 94 30
6 90 22 Poor Average Above
average
Satisfactory Low 91 32
C1: regeneration Efficiency; C2: power/Utility consumption (kW); C3: food safety and hygienic design; C4: maintenance cost; C5: availability of spares; C6: service after sales; C7: durability of machine; C8: through-put efficiency; and C9: cost (Lac).
Table 14 shows the crisp data for the present cse study.
Table 14 Crisp data for supplier companies for pasteurization machinery
Supplier company
C1 C2 C3 C4 C5 C6 C7 C8 C9
1 88 20 0.895 0.695 0.695 0.895 0.695 85 27 2 92 22 0.495 0.495 0.495 0.695 0.495 91 32 3 85 21 0.695 0.695 0.695 0.695 0.295 89 28 4 93 21 0.295 0.295 0.115 0.495 0.115 93 25
5 91 24 0.895 0.115 0.295 0.115 0.495 94 30
6 90 22 0.115 0.495 0.295 0.295 0.295 91 32
Weights 0.1757 0.2346 0.1182 0.1182 0.0987 0.0650 0.0507 0.0664 0.0725
1.2.1 Ranking results of AHP/EVAMIX method for case study 2
Table 15 Appraisal scores of supplier companies
Supplier company Si Rank
1 0.3342 1
2 0.1098 5
3 0.2608 3
4 0.2924 2
5 0.1337 4
6 0.0498 6
The EVAMIX method suggests supplier company 1 as the best choice and supplier company 6 as the last choice to order the pasteurization equipment.
1.2.2 Ranking results of extended TODIM method for case study 2
Following the computational steps of extended TODIM method, the ranking order is obtained and presented in Table 16.
Table 16 Overall values of supplier companies
Supplier company Overall values Rank
1 1 1
2 0.8878 2
3 0.6109 5
4 0.6481 3
5 0.6475 4
6 0 6
The extended TODIM method suggests the supplier company 1 as the best choice and supplier company 6 as the last choice.
1.2.3 Ranking results of OCRA method for case study 2
The complete ranking process of OCRA method is tabulated in Table 17.
Table 17 Computational details and ranking of supplier companies
Supplier
company i
I
i
I Oi Oi Pi
Rank
1 0.0497 0 2.0023 1.6517 1.4723 1
2 0.2290 0.1793 1.2312 0.8806 0.8806 4 3 0.0585 0.0088 1.5042 1.1536 0.9831 3 4 0.4666 0.4169 0.4226 0.0720 0.3096 5 5 0.6019 0.5522 1.1432 0.7925 1.1655 2
6 0.2290 0.1793 0.3506 0 0 6
OCRA method suggests supplier company 1 as the first and supplier company 6 as the last. The results obtained using these methods are consistent for the best and worst choices.
1.2.4 Ranking results of ARAS method for case study 2
The ranking is obtained by following the steps of ARAS method, ranking is done. The final ranking is shown in Table 18.
Table 18 Ranking of supplier companies by ARAS method
Supplier company
Si Si(max) Ui Rank
1 0.1918 0.9720 2
2 0.1637 0.8297 4
3 0.1733 0.1973 0.8784 3
4 0.1441 0.7302 5
5 0.1973 1 1
The ranking order is slightly changed by ARAS method. If we closely look to the data, the maintenance cost of machinery supplied by the supplier 5 is less compared with the maintenance cost given by the supplier 1. The decision maker has given more importance to the regenerative efficiency and through-put efficiency. The values of these attributes are also high for the specifications provided by supplier 5 compared with supplier 1. Hence, the ranking is justified by suggesting supplier 5 as the best choice and supplier 1 is ranked to second position. Still the ranking is agreed for the last choice of supplier (i.e., supplier 6).
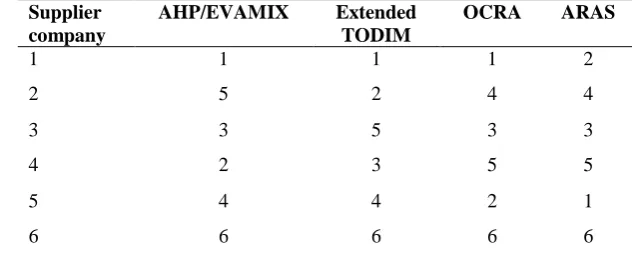
Table 19 shows the ranking comparison of milk pasteurization equipment supplier companies using different MADM methods presented in this paper.
Table 19 Raking comparison of supplier companies using different MADM methods
Supplier company
AHP/EVAMIX Extended
TODIM
OCRA ARAS
1 1 1 1 2
2 5 2 4 4
3 3 5 3 3
4 2 3 5 5
5 4 4 2 1
6 6 6 6 6
It may be observed that the ranking for the five methods of the same alternatives is same for few methods. It can be seen that four MADM methods have good extent for similarity in results. The ranking is Supplier company 1 > Supplier company 5 > Supplier company 3 > Supplier company Supplier company 2 > Supplier company 4 > Supplier company 6..
2. Summary for the results of MADM methods
The MADM methods proposed in this paper are validated using two case studies of the selection problems of the manufacturing environment. The uniqueness of the proposed decision making methods presented in this paper is that they offer general procedures those are applicable to diverse selection problems encountered in the manufacturing environment that incorporate vagueness and a number of selection attributes. The methods are capable of handling the subjective as well as objective type attribute data. The decision making methods reported here can simultaneously consider any number of quantitative and qualitative selection attributes and helps to obtain the preference index which evaluates and ranks alternatives for a given selection problem. The methods are logical and convenient to implement. These methods can be extended to any other decision making problems of the industrial environment.
References
[1]. Chatterjee, P., Athawale V. M. and Chakraborty, S., 2011. Material selection using complex proportional assessment and evaluation of mixed data methods. Materials and Design, 32, 851-860.
[2]. Chatterjee, P. and Chakraborty, S., 2012. Material selection using preferential ranking methods. Materials and Design, 35, 384-393.
[3]. Corbett, L. and Claridge, G., 2002. Key manufacturing capability elements and business performance. International Journal of Production Economics, 40(1), 109-131.
[4]. Doyle, P., 1994. Setting business objectives and measuring performance. European Management Journal, 12, 123-132.
[5]. Fan, Z. P., Zhang, X., Chen, F. D. and Liu, Y., 2013. Extended TODIM method for hybrid multiple attribute decision making problems. Knowledge-Based Systems, 42, 40-48.
[6]. Martel, J. M. and Matarazzo, B., 2005. Other outranking approaches. In: F. J. Salvatore, G. M. Ehrgott, Eds., Multiple criteria Decision Analysis: State of the Art Surveys, Springer, New York, 197– 262.
[7]. Nijkamp, P., Rietveld, P. and Voogd, H., 1990. Multicriteria Evaluation in Physical Planning. North Holland, Amsterdam, 65–100.
[8]. Rao R. V. and Padmanabhan, K. K., 2007. Rapid prototyping process selection using graph theory and matrix approach. Journal of Materials Processing Technology, 194, 81-88.
[10]. Voogd, H., 1982. Multicriteria evaluation with mixed qualitative and quantitative data. Environment and Planning Bulletin. 9, 221-236.
[11]. Wheelwrite, S., 1978. Reflecting corporate strategy in manufacturing decisions. Business Horizons, 21(5), 57-66.
[12]. Yu, V. F. and Hu, K. J., 2010. An integrated fuzzy multi-criteria approach for the performance evaluation of multiple manufacturing plants. Computers and Industrial Engineering, 58, 269-277.
[13]. Zavadskas, E. K., Turskis, Z. and Vilutiene, T., 2010. Multi criteria analysis of foundation instalment alternatives by applying Additive Ration Assessment (ARAS) method. Archives of Civil and Mechanical Engineering, 10(3), 123-141.