Optimization of Turbulence Image Chromatic Data
based on Surface Construction and RANSAC
Estimation
Zhongwei Liang
a,ba,School of Mechanical & Automotive Engineering, South China University of Technology. Guangzhou, P.R. China b,
School of Mechanical & Electrical Engineering, Guangzhou University. Guangzhou, P.R. China Email: [email protected]
Bangyan Ye
aand Xiaochu Liu
ba,School of Mechanical & Automotive Engineering, South China University of Technology. Guangzhou, P.R. China b,School of Mechanical & Electrical Engineering, Guangzhou University. Guangzhou, P.R. China
Email: [email protected] b [email protected]
Abstract—For the purpose of meeting the requirement for image chromatic information storage, data processing and transmission in turbulence precise detection, this paper presents a new data optimization method of turbulence image chromatic data based on energy optimization surface construction and multi-order Random Sample Consensus (RANSAC) estimation. Though extracting turbulence image’s chromatic data in color-space, we compute image pixel’s normal vector, multi-order derivative vector and partial derivative vector, thus an energy optimization surface of chromatic data can be structured; subsequently, by expanding the order RANSAC estimation, the multi-order RANSAC illustration of the layered chromatic vector surface can be realized, which contributes to the chromatic data optimization of turbulence image in different dimensional RANSAC estimation levels. Optimization experiment and performance comparison prove that an effective and reliable optimization results of turbulence image chromatic data can be obtained, an efficient method for studying the chromatic data and vector surface of turbulence image in different dimensional estimation level is also presented.
Index Terms—Turbulence image; Energy optimization surface; Multi-order Random Sample Consensus Estimation (RANSAC); Optimization of chromatic data
I. INTRODUCTION
With the application of three-dimensional (3D) information recognition in turbulence image and those of collaborative detecting technology, a great amount of image chromatic vectors has been emerged and needs to
be processed; simultaneously, many physical features, such as complicated topography, chromatic vector stepping and sharply concave-convex, result to the increment of chromatic information complexity, aggrandize of data quantity in vector model construction and appearance of new difficulty in information storage and data transmission for turbulence image detection; in addition, for the sake of detecting the indispensable turbulence chromatic features, we must extract and examine chromatic vector selectively. Therefore the mechanism research of chromatic vector optimization provides an effective approach to the analysis of turbulence image detection in different angles and levels.
Study of vector optimization for images and surfaces has been widely used in many scientific areas from image information compressing to surface fitting structuring. Meng Han and Guangjun Zhong [1], Jun Liu and Qifu Wang [2] studied on the compressing algorithm for three-dimensional (3D) B-spline mesh and compression based on local coordinate second-order prediction respectively; Min Shi, Shengli Xie [3] proposed a prediction-based vector quantization method for image coding; Chunlin Song, Rui Feng [4] proposed a fractal wavelet image compression approach, obtained a competitive ratio for image compression; Mingli Zhang and Sanyuan Zhang [5] proposed a multi-layered geometry image denotation of point cloud surfaces, thus described the surface control points and edge vectors in different level; Xiuxia Liang, Caiming Zhang [6] used the topology complexity-based method to approximate the iso-surface with tri-linear interpolated triangular patch; I. Brilakis [7] has conducted the content-based integration of construction site images in AEC/FM model based systems, S. Lee and L. Chang [8] achieved the automated recognition of surface defects by processing the digital color images, which results to a good experimental result; J. Neto and D. Arditi [9] used the color information for detecting structural components in digital pictures; S. Sadek and A. Al-Hamadi [10] proposed a new method for image classification based on multi-level neural networks...etc. Despite all those above Manuscript received Nov 1, 2011; revised Dec 1, 2011; accepted Dec
7, 2011.
Project number: The author acknowledge the funding of National Natural Science Foundation of China (50875089), National Natural Science Foundation of China (50875052), Foundation for Distinguished Young Talents in Higher Education of Guangdong, China (LYM09110), and the Research Project of Guangzhou University (10A068) and Xinmiao Project of Guangzhou University (LZW2-2091) are also appreciated for supporting the work.
mentioned achievements illustrated in reference [1~10] have already been made in the field of data optimization, these findings can only be principally classified into such areas as image compression or surface approximation, with little attention has been paid on optimization of image chromatic vector; study and research on this area is still in its infancy, few scholars have keep their eyes open on optimization mechanism of image chromatic vector and intrinsic rule of image redundant vector.
The optimization algorithm of image chromatic vector involves many subjects such as image processing, surface constructing and mathematical modeling; we conceive that it will be a difficult problem for proposing a suitable vector-optimization method of turbulence image chromatic information. The existing relevant algorithms (image compression, surface approximation, etc.) can not accurately provide the criterion of chromatic vector optimization and the theory of surface model construction, meanwhile, they have certain essential shortages such as low optimization accuracy and remarkable computing error., for instance, the compression algorithm for 3D mesh presented by ZHONG Guangjun [1] can not realize the complicated topography surface in a micrometer scale; the vector quantization method used by Min Shi [2] can not deal with the difficult problem which requires a huge amount of mathematical calculation and ensuring a convergent coding error; a new experiment conducted by Zhang Mingli and Zhang Sanyuan [3] which concerning about the multi-layered geometry image representation of point cloud surfaces imposes a strict limitation on the regular shapes and continuous vector functions of those target surface models. There are still many other defects can be found when we studying those existing optimization algorithms, as demonstrated in [5], [7] and [8], and all those proposed traditional methods have their own respective applicable conditions and obvious technical limitations as well. Thus further investigation needs to be made on this field.
In this paper, we focus on a new data optimization method of turbulence image chromatic data based on energy optimization surface construction and multi-order Random Sample Consensus (RANSAC) estimation. As RANSAC is an abbreviation for "Random Sample Consensus". It is an iterative method to estimate parameters of a mathematical model from a set of observed data which contains outliers. It is a non-deterministic algorithm in the sense that it produces a reasonable result only with a certain probability, with this probability increasing as more iterated computations are allowed [5]. Though extracting turbulence image’s chromatic data in color-space, we compute image pixel’s normal vector, multi-order derivative vector and partial derivative vector, thus an energy optimization surface of chromatic data can be structured; subsequently, by expanding the order RANSAC estimation, the multi-order RANSAC illustration of the layered chromatic vector surface can be realized, which contributes to the chromatic data optimization of turbulence image in different dimensional RANSAC estimation levels.
The paper is structured as follows. Section I outlines
the concept and necessity of turbulence image chromatic data optimization method. Section II describes algorithm analysis which involves structuring of energy optimization surface, Multi-order RANSAC estimation. Section III presents the experimental process and results. Section IV evaluates the optimization results and Section V concludes the paper.
II.ALGORITHMANALYSIS
A. Structuring of Energy Optimization Surface
Firstly we determine the spatial transition vectors between IC topography control curves and their neighborhood surfaces around each image chromatic feature point by image light stream vector. For the purpose of selecting the feature points, many particular vertexes with a symbolizing significance can be chosen as chromatic feature ones, such as the boundary points, control points, corner points or chromatic-vector limit points in color continuous-variation area. By regarding energy in a minimum physical deformation as the computing target, and applying constrained and external loading for controlling the surface shape, we obtain [11]:
dudv
v
u
Wf
W
W
W
W
W
W
W
E
vv uv
uu
v v u u
surface
∫∫
−
+
+
+
+
+
=
2
(
,
)
2
2
2 22 2 12 2 11
2 22 12
2 11
β
β
β
α
α
α
(1)Where W is a surface outlined in u and v direction, Wu, Wv, Wuu, Wvv are the first and second surface derivative vectors in u, v direction respectively, with Wuv is a mixed derivative vector.
Then surface equation in the form of energy optimization estimation can be transformed into B-spline estimation, with the details is shown as follows:
∑
= =
=
mv jmu i
sv j su i j
i
B
u
B
v
V
v
u
w
, 0
, 0
, ,
,
(
)
(
)
)
,
(
(2)Where V is the control vertex of B-spline surface
) , (u v
w ; mu+1,mv+1 are the amount of surface control vertexes; su and sv are the surface power in u, v direction;
) ( )
( ,
, uB v
Bisu jsv are the B-spline primary estimation, partial
derivative vector of the first and second order
) (u
wu ,wuu(u) can be determined by using Eq. (2). All
these variables are classified into u and v directions respectively.
∑
∑
∑
∑
∑
= =
= =
= = = =
= =
= = = = =
mv j
mu i
sv j su
i j i uv
mv j
mu i
sv j su
i j i vv
mv j
mu i
sv j su
i j i uu
mv j
mu i
sv j su
i j i v
mv j
mu i
sv j su
i j i u
v B u B V v
u w
v B
u B V v
u w
v B u B
V v
u w
v B u B V v
u w
v B u B V v
u w
, 0
, 0
, ,
, , 0
, 0
, ,
, , 0
, 0
, ,
, , 0
, 0
, ,
, , 0
, 0
, ,
,
) ( ' ) ( ' )
, (
) ( ' ' ) ( )
, (
) ( ) ( ' ' )
, (
) ( ' ) ( )
, (
) ( ) ( ' )
, (
(3)
dudv
v
B
u
B
v
B
u
B
v
B
u
B
v
B
u
B
v
B
u
B
v
B
u
B
v
B
u
B
v
B
u
B
v
B
u
B
v
B
u
B
v
B
u
B
v
B
u
B
V
V
E
sv l su k sv j su i sv l su k sv j su i sv l su k sv j su i sv l su k sv j su i sv l su k sv j su i sv l su k sv j su i mv l mu k l k mv j mu i j i
+
+
+
+
+
=
∫ ∫
∑
∑
== = =)
(
'
'
)
(
)
(
'
'
)
(
)
(
'
)
(
'
)
(
'
)
(
'
2
)
(
'
)
(
'
'
)
(
)
(
'
'
)
(
'
)
(
)
(
'
)
(
)
(
'
)
(
)
(
)
(
'
2
)
(
)
(
'
)
(
)
(
'
*
, , , , 22 , , , , 12 , , , , 11 , , , , 22 , , , , 12 , , , , 11 1 0 1 0 , 0 , 0 , , 0 , 0 ,β
β
β
α
α
α
(4)Thus this energy optimization surface denoted by Eq. (1) is transferred into a quadratic estimation of vertex V [12, 13].
It is noteworthy that the method of object energy analysis has already become a classical means for discrete data processing denoted by different kinds of mathematical signal or digital image. Adopting ordinary image-energy methods and establishing energy processing parameters, such as harmonic energy, chrominance energy and frequency-domain energy, are all only used for the single-feature recognition or signal classification in two-dimensional image; simultaneously, the traditional energy methods are concentrating their focus on signal harmonic sampling or frequency-domain discrete transforming. Until recently, there are few researchers applying this method on the establishment of tensor space equations, the construction of image data and three dimensional mathematical models, and the optimization of their chromatic feature surface. Due to the development of computer processing capability on data storage and mathematical problems, surface modeling with energy optimization method breaks the traditional category of continuous spatial-domain geometry computation, and this method provides a new research means for chromatic data processing in a turbulence image.
Through programming we demonstrate part of the constructing algorithm for energy optimization surface by solidworks development language as follows:
skSegment = Part.Manager.Create (0, -0.5, 0.0#, s4, -0.5, 0.0#)
skSegment = Part. Manager.Create (s9(0), -0.5, 0.0#, s8(1), -0.05, 0.0#)
skSegment = Part. Manager.Create (s8(1), -0.05, 0.0#, s9(1), -0.5, 0.0#)
Part.ClearSelection2(True)
skSegment = Part. Manager.Create (0, -0.5, 0.0#, s4, -0.5, 0.0#)
skSegment = Part. Manager.Create (s9(0), -0.5, 0.0#, s10, -0.05, 0.0#)
skSegment = Part. Manager.Create (s10, -0.05, 0.0#, s9(1), -0.5, 0.0#)
Part.ClearSelection2(True) Else
skSegment = Part. Manager.Create (0, -0.5, 0.0#, s4, -0.5, 0.0#)
skSegment = Part. Manager.Create (s9(0), -0.5, 0.0#, s8(0), -0.05, 0.0#)
skSegment = Part. Manager.Create (s8(0), -0.05,
0.0#, s9(1), -0.5, 0.0#)
Part.ClearSelection2(True)
B.Multi-order Ransac Estimation
We assume φ(•) to be Random Sample Consensus (RANSAC) estimation in an orthogonal complement space Wi.
The RANSAC basis
{
φi,m(x)m∈Z}{
,φi,n(y)n∈Z}{
,φi,r(z)r∈Z}
is a standard orthogonal basis in Wi, thus we obtain that [14, 15]:
=
=
=
=
=
=
)
(
)
(
)
(
)
,
,
(
)
(
)
(
)
(
)
,
,
(
)
(
)
(
)
(
)
,
,
(
)
(
)
(
)
(
)
,
,
(
)
(
)
(
)
(
)
,
,
(
)
(
)
(
)
(
)
,
,
(
6 5 4 3 2 1z
y
x
z
y
x
z
y
x
z
y
x
z
y
x
z
y
x
z
y
x
z
y
x
z
y
x
z
y
x
z
y
x
z
y
x
δ
δ
δ
ξ
φ
φ
φ
ξ
ξ
θ
δ
φ
φ
θ
δ
ξ
θ
φ
δ
ξ
δ
θ
φ
ξ
(5)For it is a multi-order RANSAC estimation, then we obtain:
∈
=
∈
=
∈
=
∈
=
∈
=
∈
=
Z
r
n
m
z
y
x
z
y
x
Z
r
n
m
z
y
x
z
y
x
Z
r
n
m
z
y
x
z
y
x
Z
r
n
m
z
y
x
z
y
x
Z
r
n
m
z
y
x
z
y
x
Z
r
n
m
z
y
x
z
y
x
r i n i m i r n m i r i n i m i r n m i r i n i m i r n m i r i n i m i r n m i r i n i m i r n m i r i n i m i r n m i,
,
)
(
)
(
)
(
)
,
,
(
,
,
)
(
)
(
)
(
)
,
,
(
,
,
)
(
)
(
)
(
)
,
,
(
,
,
)
(
)
(
)
(
)
,
,
(
,
,
)
(
)
(
)
(
)
,
,
(
,
,
)
(
)
(
)
(
)
,
,
(
, , , , , , 6 , , , , , , 5 , , , , , , 4 , , , , , , 3 , , , , , , 2 , , , , , , 1δ
δ
δ
ξ
φ
φ
φ
ξ
ξ
θ
δ
φ
φ
θ
δ
ξ
δ
φ
θ
ξ
δ
θ
φ
ξ
(6)Then we assume D {m m'1 j n}
j
j↔ ≤ ≤
= be a
corresponding set for the chromatic vector points of turbulence image, with the 7-point algorithms of elementary image-space matrix, we obtain the unification
set of three constrain solution
F
J(1),
F
J(2),
F
J(3) asfollows: } ) ' , ( ) , ' ( ) ' {( ) ( 2 ) ( 2 ) ( 2 ) ( t m F m d m F m d D m m F S T j J j J j J < + ∈ ↔ = (7)
We let S(FJ0) be the maximum unification set, then
0
J
F
is an elementary matrix determined by the minimum subset of S(FJ0) , thus the RANSAC estimation ofturbulence image chromatic data can be expressed as:
2 ) ( ) ' ( 2 2 ' 2 1 ' 2 2 2 1
)
'
(
)
)
(
)
(
)
(
)
/((
1
0 j j F S mm Tm Tm
m m
Fm
m
F
F
F
F
J jj j j
j j
×
+
+
+
∑
∈ ↔ (8)Where ' 22
2 1 ' 2 2 2
1
,
(
)
,
(
)
,
(
)
)
(
j j j mjT m
T m
m
F
F
F
F
arethe standard RANSAC factors in orthogonal complement space W i , which denotes the corresponding cluster of
= = = =
∑
∑
∑
∑
∈ ∈ ∈ ∈
)] , , ( [ )
(
)] , , ( [ )
(
)] , , ( [ )
(
)] , , ( [ )
(
, , , , , , 2 2 '
, , , , , , 2 1 '
, , , , , , 2 2
, , , , , , 2 1
z y x d
F
z y x c
F
z y x b
F
z y x a
F
j r n m j
r n m W x y x m
T
j r n m j
r n m W x y x m
T
j r n m j
r n m W x y x m
j r n m j
r n m W x y x m
j j j j
ξ
ξ
ξ
ξ
(9)
Where
a
mj,n,r ,b
mj,n,r,j r n m
c
,, , jr n m
d
,, are the RANSAC expanding coefficients in orthogonal complement spacei
W
respectively.With the continuous development of energy surface multi-order analysis, we can see that a multitude number of analysis algorithms, such as the multi-order wavelet decomposing, Mallat frequency-domain layering, parametric decomposing…etc, have appeared and already been utilized in many fields.
Different from other traditional multi-order analysis methods, this new Multi-order RANSAC estimation based algorithm acquires the matrix of corresponding restraint points from surface data which conform to the maximum consistent set, with this feature it realizes the expansion and analysis of chromatic surface data in a multi- dimensional space. Thus it is obviously that RANSAC estimation can eliminate many shortages generated from many ordinary surface analysis algorithms, e.g. mismatching, discretization of iterative calculation results, over-deviation of analysis results, etc, which ensures the accuracy and robustness of surface analysis processes.
Then we show part of the multi-order RANSAC estimation which programmed by solidworks development language as follows:
skSegment = Part.SketchManager.Create (s3 + c(i) + a(i) / 2, 0.0#, 0.0#, s3 + c(i) + a(i) / 2, -a(i) / 2, 0.0#, s3 + c(i) + a(i) / 2, a(i) / 2, 0.0#, -1)
Part.ClearSelection2(True)
0
-a(i)/2
a(i)/2
+
c(i)
+
s3
a(i)/2
+
c(i)
+
1)
-L(i
+
…
+
L(0)
1 1
1
=
=
=
=
Z
Y
X
,
,
0
-a(i)/2
a(i)/2
-b(i)
+
c(i)
+
s3
a(i)
-b(i)
2 2
1 2
=
=
=
+
=
Z
Y
X
X
,
,
skSegment = Part.SketchManager.Create (s3 + c(i) + a(i) / 2, -a(i) / 2, 0.0#, s3 + c(i) + b(i) - a(i) / 2, -a(i) / 2, 0.0#)
Part.ClearSelection2(True)
0
0
a(i)/2
-b(i)
+
c(i)
+
s3
1 11
=
Y
=
Z
=
X
,
,
0
2
/
-a(i)
a(i)/2
-b(i)
+
c(i)
+
s3
2 22
=
Y
=
Z
=
X
,
,
0
2
/
a(i)
a(i)/2
-b(i)
+
c(i)
+
s3
3 33
=
Y
=
Z
=
X
,
,
skSegment = Part.SketchManager.Create (s3 + c(i) + b(i) - a(i) / 2, 0.0#, 0.0#, s3 + c(i) + b(i) - a(i) / 2, -a(i) / 2, 0.0#, s3 + c(i) + b(i) - a(i) / 2, a(i) / 2, 0.0#, 1)
Part.ClearSelection2(True)
0
a(i)/2
a(i)/2
-b(i)
+
c(i)
+
s3
1 11
=
Y
=
Z
=
X
,
,
0 2
/ a(i)
a(i)/2 + c(i) + s3 a(i)) -(b(i)
2 2
1 2
= =
= −
=
Z Y
X X
,
,
skSegment = Part.SketchManager.Create (s3 + c(i) + b(i) - a(i) / 2, a(i) / 2, 0.0#, s3 + c(i) + a(i) / 2, a(i) / 2, 0.0#)
Part.ClearSelection2(True) Part.SketchManager.InsertSketch(True) Part.ClearSelection2(True)
III. OPTIMIZATION EXPERIMENT
We start our analysis from the experiment of turbulence locus in the confined casing of a strengthen grinding machining structure, with the specific structure is shown in the afore-mentioned Fig 1. The three-dimension of this confined casing is 1m×0.8m×0.6 m, the depth of water-based enhanced fluid for experiment is 0.5m. We measure the Reynolds number Re=uh /v is 4500. Thus the experiment process is shown in detail as follows:
Figure 1 The machining structure of strengthen grinding, with the cylindrical space being denoted as the confined space for turbulence motion
Inter ring Outer ring
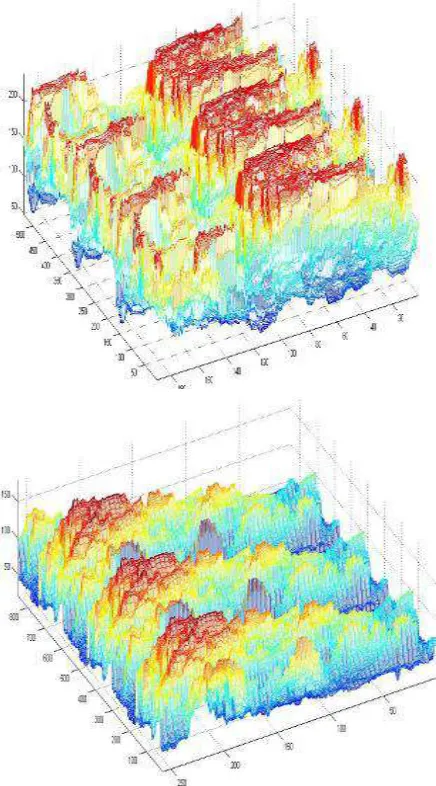
Figure 2 turbulence images
Figure 3 Distribution of turbulence chromatic vector
Firstly we let a roller using for strengthen grinding be auto-rotating at the high speed of 450r/min, simultaneously, it also revolving around its own central axis driven by the planetary gears at 45r/min in the confined space. Driven by centrifugal force and gravity force the water-base enhanced fluid is stirred and a high-speed turbulence can be obtained.
We used DMIRM microscopic system manufactured by German LEICA to capture three-dimensional locus information from given turbulence by digital micro-images. The system consists of three essential components: a precise CCD head, a PC equipped with an image processing board, and 3D triangulation processing software. The CCD head consists of a light source and three CCD cameras (4088×1288 pixels). For the light source is a visible coaxial red LED (220V、20W, 700 nm) combined with a diffraction grating that generates a fixed number of stripes, it can also be called micro-imaging planes, which enable the system to acquire 450,000 pixels in a scene with a single image frame.
The range measurements are computed using triangulation between the binary digital images and the calibrated image plane locations. The CCD is able to acquire image pixel data in 0.01 ms (enabling image acquisition from a continuously moving manipulator) and processes image data in 10 ms, and has a measurement standard deviation of 1/20000 of the field of view. The CCD image head is attached to a DMIRM 3-axis direct-drive configuration manipulator for self-adaptive imaging, thus it can eliminate image distortion caused by inhomogeneous light, keep a rapid reaction and stable performance simultaneously. On the other hand, for the purpose of improving the detection precision of target turbulence to the micron scale (10~50µm), we adopt 200
magnifying power in micro-image shooting and let digital image has the size of 4088×1288 with 256 gray level (0~255), with using the development language of Matlab7.0 and Solidworks to program the kernel analysis and computation module. Other experiment conditions are listed as follows: Celeron 2.26 microprocessor, 256M memory, operation system is Windows XP. With the obtained turbulence details shown in Fig 2, by RGB chromatic spectrum we denote pixel color by three components of primary color: f(i,j)=[R(i,j),G(i,j),B(i,j)].
Wherei=1,2,...,m,j =1,2,...,n, with f( ji, ) denotes
the pixel locates in the coordinate position of (i,j), the
coordinate set of [R(i,j),G(i,j),B(i,j)] denotes the RGB
primary color vectors of
f
( j
i
,
)
. After obtaining the chromatic micro-image of turbulence detail, we extract the distribution of turbulence chromatic vector shown by Fig 3, then compute the tangent vectors Wu,Wv,Wuv of thegiven pixel n(i,j) in three dimensional directions as follows:
) , , ( ,
, 1 2 3
2 2 2 1 2 2 1 1 2 2 1 1 2 2 2 1 1 1 ) , 1 ( ) , ( u u u q p q p p r p r r q r q r q p r q p k j i n n
Wu ij i j
= = = × = + ) , , ( ,
, 1 2 3
3 3 2 1 3 3 1 1 3 3 1 1 3 3 3 1 1 1 ) 1 , ( ) , ( v v v q p q p p r p r r q r q r q p r q p k j i n n
Wv i j i j
= = = × = + ) , , ( ,
, 1 2 3
3 3 2 2 3 3 2 2 3 3 2 2 3 3 3 2 2 2 ) 1 , ( ) , 1 ( uv uv uv q p q p p r p r r q r q r q p r q p k j i n n
Wuv i j ij
= = = × = + +
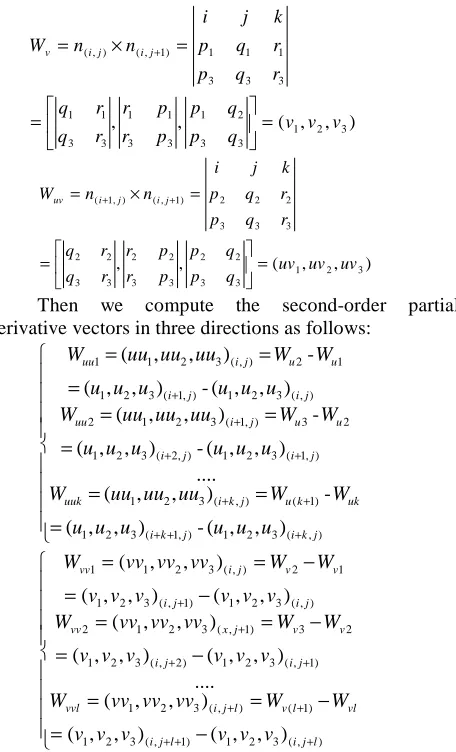
Then we compute the second-order partial derivative vectors in three directions as follows:
= = = = = = = = = + + + + + + + + + ) , ( 3 2 1 ) , 1 ( 3 2 1 ) 1 ( ) , ( 3 2 1 ) , 1 ( 3 2 1 ) , 2 ( 3 2 1 2 3 ) , 1 ( 3 2 1 2 ) , ( 3 2 1 ) , 1 ( 3 2 1 1 2 ) , ( 3 2 1 1 ) , , ( -) , , ( -) , , ( .... ) , , ( -) , , ( -) , , ( ) , , ( -) , , ( -) , , ( j k i j k i uk k u j k i uuk j i j i u u j i uu j i j i u u j i uu u u u u u u W W uu uu uu W u u u u u u W W uu uu uu W u u u u u u W W uu uu uu W − = − = = − = − = = − = − = = + + + + + + + + + ) , ( 3 2 1 ) 1 , ( 3 2 1 ) 1 ( ) , ( 3 2 1 ) 1 , ( 3 2 1 ) 2 , ( 3 2 1 2 3 ) 1 , ( 3 2 1 2 ) , ( 3 2 1 ) 1 , ( 3 2 1 1 2 ) , ( 3 2 1 1 ) , , ( ) , , ( ) , , ( .... ) , , ( ) , , ( ) , , ( ) , , ( ) , , ( ) , , ( l j i l j i vl l v l j i vvl j i j i v v j x vv j i j i v v j i vv v v v v v v W W vv vv vv W v v v v v v W W vv vv vv W v v v v v v W W vv vv vv W
With part of the obtained chromatic vector results in the positions of several key pixels are shown in Table I, then we can obtain their chromatic normal vector
] , ,
[ 1 1 1
) ,
( p q r
nij = , their first-order and second-order partial
derivative vectors Wu=(u1,u2,u3) ,
W
uu=
(
u
11,
u
22,
u
33)
,)
,
,
(
v
1v
2v
3W
v=
, Wvv=(v11,v22,v33), and their mixed partialderivative vector
W
uv=
(
uv
1,
uv
2,
uv
3)
by theabove-mentioned equation.
process of envelope which fitting on the target surface should be achieved simultaneously, which results to the emergence of a tremendous computing amount and storage space of computer.
For solving the above-mentioned problems, we expanding the multi-order scaling RANSAC estimation on the fitted topography surface with Eq. (5) ~ Eq. (9), thus illustrating the obtained RGB chromatic vector surfaces in different estimation level in Fig 6. Through interpreting the optimization process of image chromatic vector data by Table II, it can be seen that the topography complexity of RGB chromatic vector surface degrades gradually with the increasing order of RANSAC expanding level from the first order to the fourth one: the amount of surface control points decreases gradually while chromatic vector array keeps on a stable state of sparsely-located information distribution. When regarding to the mono-control point with a floating coordinate value, it can be seen that the optimization error decreases with fewer bits after data quantization has been made. On the other hand, after expanding the multi-order scaling RANSAC estimation and quantifying the control vertex array, an
obvious increment in the probability of identical data value can be made, on this basis we can realize the optimization of image chromatic vector by the non-homogeneity and limiting tendency of surface vector
RANSAC in the third order RANSAC in the fourth order Figure 6 Multi-order RANSAC estimations of turbulence image
chromatic data
RANSAC in the first order RANSAC in the second order
first
order
second
order
third
order
fourth
order
fifth
order
0.00%
1.00%
2.00%
3.00%
4.00%
5.00%
6.00%
7.00%
8.00%
LZW coding
fractal compression
entropy coding
chromaticity sampling
Shannon-Fano coding
New method
distribution probability, and obtain a more-obviously optimization result as well.
IV. EVALUATIONOFOPTIMIZATIONRESULTS
For the sake of accuracy and validity, we assess the optimization performance of turbulence image chromatic vector by selecting such following indexes as distortion rate, optimization space ratio, algorithm complexity, bit error rate, similarity rate, image energy, peak signal to noise ratio (PSNR), etc. where distortion rate provides the theoretical foundations for lossy data compression; it
addresses the problem of determining the minimal amount of image entropy (or image information) that should be communicated over a channel, so that the input signal can be approximately reconstructed at the output signal without exceeding a given information distortion level; optimization space ratio denotes the comparative ratio between the optimized information amount space with those information amount to be optimized yet, by this index can we learn more about the progress situation of optimization experiment; algorithm complexity focuses on classifying computational problems according to their inherent difficulty, and relating those classes to each other;
f i r s t o r d e r
s e c o n d o r d e r
t h i r d o r d e r
f o u r t h o r d e r
f i f t h o r d e r
0 20000 40000 60000 80000 100000 120000 140000 160000
(c) Algorithm complexity
f i r s t o r d e r
s e c o n g o r d e r
t h i r d o r d e r
f o u r t h o r d e r
f i f t h o r d e r
0 10 20 30 40 50
(b) Optimization space ratio
first
ordr
second
order
third
order
fourth
order
fifth
order
0.00%
1.00%
2.00%
3.00%
4.00%
5.00%
6.00%
7.00%
(d) Bit error rate
first
order
second
order
third
order
fourth
order
fifth
order
0.00%
20.00%
40.00%
60.00%
80.00%
100.00%
(e) Similarity rate
f i r s t o r d e r
s e c o n d o r d e r
t h i r d o r d e r
f o u r t h o r d e r
f i f t h o r d e r
0 0.2 0.4 0.6 0.8 1 1.2
(g) PSNR f i r s t
o r d e r
s e c o n d o r d e r
t h i r d o r d e r
f o u r t h o r d e r
f i f t h o r d e r
0 5000 10000 15000 20000 25000
(f) Image energy
bit error rate and similarity rate are two indexes reflecting the number of received bits of an image data stream over a communication channel that have been altered due to noise, interference, distortion or bit synchronization errors, and it is divided by the total number of transferred bits during a studied time interval as well; image energy quantitative measures the strength caused by different pixel element in one image plane in its light scale, which helps us to establish a new quantitative index illustrating image characteristics; peak signal to noise ratio (PSNR) is an theoretical term for the number ratio between the maximum possible power of an image signal and the power of corrupting noise that affects the fidelity of its representation. Because many image signals have a very wide dynamic range, PSNR is usually expressed in terms of the logarithmic decibel scale, it also most commonly used as a measure of quality of reconstruction of loss image compression codecs in mathematical sense [11-13].
Simultaneously, for the purpose of performance comparison several typical data optimization methods were also be selected in this paper, such as LZW coding, fractal compression, entropy coding, chromaticity sampling, Shannon-Fano coding…… and so on. Where LZW coding is an entropy encoding algorithm used for lossless data compression which refers to the use of a variable-length code table for encoding a source symbol where the variable-length code table has been derived in a particular way based on the estimated probability of occurrence for each possible value of the source symbol; Fractal compression is a lossy compression method for digital images based on fractals. It is best suited for textures and natural images, relying on the fact that parts of an image often resemble other parts of the same image, it also convert these parts into mathematical data called
"fractal codes" which are used to recreate the encoded image; entropy encoding is a lossless data compression scheme that is independent of the specific characteristics of the medium, it creates and assigns a unique prefix-free code to each unique symbol that occurs in the input; chromaticity sampling realize the information compression by extracting those key chromaticity signal from a huge amount of image data, and then reconstructing a simplified image signal plane reflecting those important information by a limited amount of chromatic element data as predetermined; Shannon–Fano coding is a technique for constructing a prefix code based on a set of symbols and their probabilities. In Shannon– Fano coding, the symbols are arranged in order from most probable stage to least probable one, and then divided into two sets whose total probabilities are as close as possible to being equal as required [13-15].
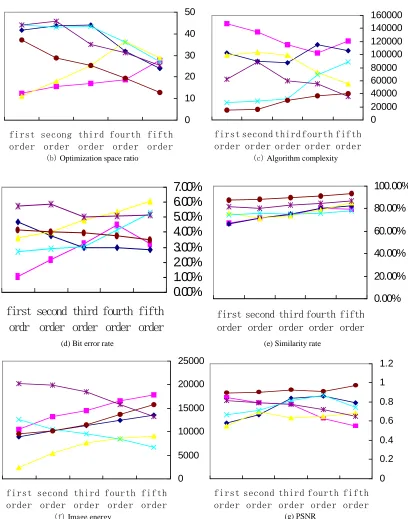
During the evaluation process, we expand the turbulence image chromatic vector from the 1st to the 4th order in an identical external technical environment, with 40 times of iterated computation for the optimization performance index in each order level, the obtained results and data comparisons of image optimization are shown in Table III after data de-noising, equalizing and normalizing, and Fig 7 illustrates the performance comparison between this new algorithm and other typical image data optimization methods, with each method is denoted by one colored-line.
From these figures we can see that with the decrement of expanding order, the optimization space ratio of the new method keeps in a relative-stable level, which contributes to an eligible optimized image result; Simultaneously, from the view of chromatic vector variation principle and developing tendency of different Table I
Part of the key points’ chromatic vectors
No f( ji, ) n (x,y)
W
uW
vW
uuW
vvW
uv1 (164,478) (-24,55,89) (45,77,-102) (33,85,-25) (-34,53,-25) (24,18,21) (43,25,-33) 2 (559,342) (45,67-22) (35,42,660 (64,32,17) (12,44,-34) (-23,40,17) (19,-33,24) 3 (684,227) (35,55,-35) (-33,29,57) (-22,-35,76) (-22,35,-64) (22,-34,-6) (22,31,25) 4 (388,449) (-24,56,-47) (55,40,22) (-35,52,-25) (24,-12,43) (33,-24,46) (-13,24,-5)
Table II
Optimization Process of chromatic vector of turbulence image
Surface Number of surface control
points
Data amount of control points(byte)
Effect of vector optimization
Before optimization 39040×26880 1025k 4589k
First order RANSAC expansion 19520×13440 330k 1980k
Second order RANSAC expansion 9760×6720 267k 976k
Third order RANSAC expansion 4880×3360 134k 478k
Fourth order RANSAC expansion 2440×1680 64k 246k
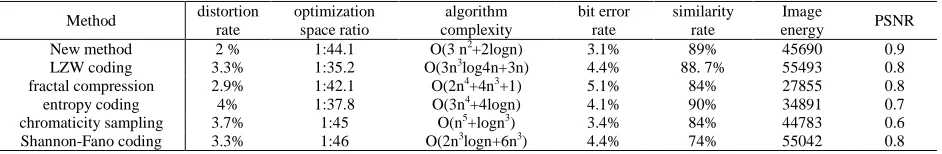
Method distortion
rate
optimization space ratio
algorithm complexity
bit error rate
similarity rate
Image
energy PSNR
New method 2 % 1:44.1 O(3 n2+2logn) 3.1% 89% 45690 0.9
LZW coding 3.3% 1:35.2 O(3n3log4n+3n) 4.4% 88. 7% 55493 0.8
fractal compression 2.9% 1:42.1 O(2n4+4n3+1) 5.1% 84% 27855 0.8
entropy coding 4% 1:37.8 O(3n4+4logn) 4.1% 90% 34891 0.7
chromaticity sampling 3.7% 1:45 O(n5+logn3) 3.4% 84% 44783 0.6
Shannon-Fano coding 3.3% 1:46 O(2n3logn+6n3) 4.4% 74% 55042 0.8
Table III
colored-line, we can concluded that this new algorithm maintains a stable-degrading tendency in such evaluation indexes as algorithm complexity, bit error rate, bit error rate etc, while it keeps an excellent performance in similarity rate, image energy, peak signal to noise ratio (PSNR), which further provides a direct support for the fact that this new algorithm not only has an apparent optimization superiority over other traditional methods, but also keeps a close gap with them in such indexes as optimization space ratio, distortion rate, similarity rate, image energy, peak signal to noise ratio (PSNR) as well. Thus a clear and stable optimized illustration of image chromatic information can be ensured for the following Turbulence image detection.
V. CONCLUSIONS
This paper sought to establish a new data optimization method of turbulence image chromatic data based on energy optimization surface construction and multi-order Random Sample Consensus (RANSAC) estimation. Following major contributions are included in our work to meet the requirements: We extract the turbulence image chromatic data in color-space, and then compute the pixel normal vector, multi-order derivative vector and partial derivative vector, etc, which results to the construction of energy optimization surface of image chromatic data. Through expanding multi-dimensional RANSAC estimation, the multi-dimensional RANSAC illustration of layered chromatic vector surface can be ensured. We assess the optimization performance by mathematical indexes with several typical methods; through analysis and comparison it can be further proved that a clear and stable optimization illustration of turbulence image chromatic data is obtained by this new method. These processes could be successive stages of computational experiment, with the second operating on the output of the first. Thus the requirement of chromatic vector optimization can be met, and an efficient method for extracting the vector surface features and chromatic information in different estimation level can also be provided. Optimization experiment and performance comparison prove that an effective and stable optimization result of image chromatic information can be obtained by this new method, meanwhile a superior performance in data optimization can also be ensured, thus it provides a new idea for the research in turbulence image chromatic information optimization, storage and transmission.
ACKNOWLEDGMENT
The author acknowledge the funding of National Natural Science Foundation of China (50875089), National Natural Science Foundation of China (50875052), Foundation for Distinguished Young Talents in Higher Education of Guangdong, China (LYM09110), and the Research Project of Guangzhou University (10A068) and Xinmiao Project of Guangzhou University (LZW2-2091) are also appreciated for supporting the work.
REFERENCES
[1] HAN Meng, ZHONG Guangjun. “A Compression
Algorithm for 3D Mesh to Use in Network”. Computer Technology and Development, Vol. 17, No. 12, pp. 8-11, 2007.
[2] Liu Jun Wang Qifu Chen Liping. “Compression of B- spline Based on Local Coordinate Second- order Prediction”. China Mechanical Engineering, Vol.19 No.3, pp.304-307, 2008.
[3] Min Shi, Shengli Xie. “A prediction based vector quantization method for image coding”. Journal of South China University of Technology: Natural Science Edition, Vol.34 No.1, pp.18-23, 2006.
[4] Chun-lin Song, Rui Feng, Fu-qiang Liu. “A novel fractal wavelet image compression approach”. Journal of China University of Mining & Technology: English edition, Vol. 17, No.3, pp.121-125, 2007.
[5] Zhang Mingli, Zhang Sanyuan, Ye Xiuzi. “Multi-layered Geometry Image Representation of Point Cloud Surfaces”. Journal of Computer- aided Design and Computer Graphics, Vol. 16, No.12, pp.1662-1667, 2009.
[6] Liang Xiuxia, Zhang Caiming, Liu Yi. “A Topology Complexity Based Method to Approximate Isosurface with Trilinear Interpolated Triangular Patch”. Journal of Computer Research and Development, Vol. 43, No.3, pp. 828-535, 2006.
[7] I. Brilakis, Content Based Integration of Construction Site Images in AEC/FM Model Based Systems, Ph.D.
Dissertation, Civil and Environmental Engineering,
University of Illinois, Urbana-Champaign, IL, 365 pages, 2005.
[8] S. Lee, L. Chang, P. Chen, “Automated recognition of surface defects using digital color image processing”, Automation in Construction. Vol.15, No.4, pp.540–549, 2006.
[9] J. Neto, D. Arditi, “Using colors to detect structural components in digital pictures”, Computer Aided Civil and Infrastructure Engineering. Vol. 17, No.5, pp.61–76, 2002. [10]S. Sadek, A. Al Hamadi, B. Michaelis, U. Sayed, “A new method for image classification based on multi-level neural networks”, World Academy of Science, Engineering and Technology, Vol. 57, No.1, pp.139–142, 2009.
[11]Yang Chun-ling, Kuang Kai-zhi, Chen Guan-hao.
“Gradient-based structural similarity for image quality assessment”. Journal of South China University of Technology: Natural Science Edition, Vol. 34, No.9, pp.22-25, 2008.
[12]Liang Zhongwei, Zhang Chunliang, Ye Bangyan.
“Turbulence image Noise Reverse Determination Based on
Three-dimensional Information Energy Optimization
Modeling and BP Network”. Mechanical Science and Technology for Aerospace Engineering, Vol. 29, No.4, pp. 428-434, 2010.
[13]ZHU Hong, Digital image processing. Beijing: Press of Science, 2005 pp. 246 - 267.
[14]ZHENG Nanning. Computer vision and pattern recognition. Beijing: Press of National Defense Industry, 1998 pp.136-157.
Zhongwei Liang (1979.1~). He is a
Ph D and Associate Professor. He
received the M.S. and Ph.D. degree in mechanical engineering in 2005 and 2008,
from South China University of
Technology, Guangzhou, China.
Currently, he is an Associate Professor and Master's Supervisor of School of mechanical and electrical engineering at Guangzhou University, P.R. China. His major research interests include image processing, reverse engineering, turbulence analysis and free curves and surfaces reconstruction, etc. He is an author and coauthor of more than 20 international journal papers and 20 papers published in proceedings of international conferences. Dr. Liang is a senior member of Chinese Mechanical Engineering Society (CMES), Chinese Institute of Electronics (CIE), China Computer Federation (CCF) and Association for Computing
Machinery (ACM).
Email:[email protected] OR [email protected] Corresponding Address:
(1) School of Mechanical & Automotive Engineering, South China University of Technology. 510640, Guangzhou, P.R. China; (2) School of mechanical and electrical engineering at Guangzhou University, 510006, Guangzhou, P.R. China
Bangyan Ye. (1949-) Ph D. Professor. His major research
interests include advanced manufacturing technology, Computer science and Engineering.
Xiaochu Liu. (1964-) Ph D. Professor. His major research