R E S E A R C H
Open Access
Preference of spectral features in auditory
processing for advertisement calls in the
music frogs
Yanzhu Fan
1,2†, Xizi Yue
1†, Jing Yang
1,2, Jiangyan Shen
1,2, Di Shen
1,2, Yezhong Tang
1and Guangzhan Fang
1*Abstract
Background:Animal vocal signals encode very important information for communication during which the importance of temporal and spectral characteristics of vocalizations is always asymmetrical and species-specific. However, it is still unknown how auditory system represents this asymmetrical and species-specific patterns. In this study, auditory event related potential (ERP) changes were evaluated in the Emei music frog (Babina daunchina) to assess the differences in eliciting neural responses of both temporal and spectral features for the telencephalon, diencephalon and mesencephalon respectively. To do this, an acoustic playback experiment using an oddball paradigm design was conducted, in which an original advertisement call (OC), its spectral feature preserved version (SC) and temporal feature preserved version (TC) were used as deviant stimuli with synthesized white noise as standard stimulus.
Results:The present results show that 1) compared with TC, more similar ERP components were evoked by OC and SC; and 2) the P3a amplitudes in the forebrain evoked by OC were significantly higher in males than in females. Conclusions:Together, the results provide evidence for suggesting neural processing for conspecific vocalization may prefer to the spectral features in the music frog, prompting speculation that the spectral features may play more important roles in auditory object perception or vocal communication in this species. In addition, the neural processing for auditory perception is sexually dimorphic.
Keywords:Auditory processing, Advertisement call, Event related potential (ERP), Spectral characteristic, Temporal characteristic, Frog
Background
Vocal communication plays a crucial role in the survival and reproduction success in vocal animals such as birds, insects and anurans. In general, animal vocal signals en-code diverse information about species, sexual receptiv-ity, location, size and individual identity [1–3]. In the time domain, a natural vocalization typically contains a number of discrete components, appropriately ordered in time, each having specific spectral and temporal char-acteristics [4]. Accordingly, animal vocalizations provide a rich source of information which receivers must
decode for species discrimination and individual recog-nition [5]. Previous studies show that the relationship between vocal signals and auditory processing is often consistent with the matched filter hypothesis [6], which holds that coevolution of signals and sensory systems should result in a good match between signal structure and the tuning of relevant sensory systems. For example, in zebra finches (Taeniopygia guttata), syllable diversity and male performance parameters such as spectral and temporal consistency rather than long song duration or high (directed) song rates are better predictors of which songs a female will find attractive [7].
The vocalization is both species-specific and individu-ally distinct, and it functions in both territory defense and mate attraction [8]. For vocal animals, biotic noise sources from conspecific and heterospecific individuals are usually the major acoustic interference in many
© The Author(s). 2019Open AccessThis article is distributed under the terms of the Creative Commons Attribution 4.0 International License (http://creativecommons.org/licenses/by/4.0/), which permits unrestricted use, distribution, and reproduction in any medium, provided you give appropriate credit to the original author(s) and the source, provide a link to the Creative Commons license, and indicate if changes were made. The Creative Commons Public Domain Dedication waiver
(http://creativecommons.org/publicdomain/zero/1.0/) applies to the data made available in this article, unless otherwise stated.
* Correspondence:[email protected]
†Yanzhu Fan and Xizi Yue contributed equally to this work.
1Department of Herpetology, Chengdu Institute of Biology, Chinese Academy of Sciences, No.9 Section 4, Renmin Nan Road, Chengdu, Sichuan 610041, People’s Republic of China
habitats [9, 10]. It is conceivable that, to reduce mutual masking, the signals of different species may be shifted by selection pressure to different frequency bands or spectral characteristics, so that species eventually avoid spectral overlap and hence occupy distinct acoustic niches [11]. Compared with other songbirds, the vocal repertoire of zebra finches includes more harmonic complexes with over 15 frequency components, and that differences in frequency separation and relative ampli-tude of each component lead to differences in pitch and timbre between individuals [12]. Similarly, the advertise-ment calls in some anuran species possess various
spec-tral features different from each other among
conspecific individuals so that these properties contrib-ute toward individual recognition [13–15]. Thus, the spectral attributes of sounds might play important roles in vocal communication. At the neural level, different frequency components can be represented by activity in different frequency-tuned neural subpopulations or channels, i.e. tonotopic representation of sound [16]. Furthermore, vocalizations usually vary in temporal structure and these temporal properties can also play important roles in vocal communication [17]. Corres-pondingly, another fundamental aspect of auditory pro-cessing is neural synchrony to the temporal structure of sound such as envelope following [18] and frequency fol-lowing [19] found in the instantaneous firing rate of auditory neurons. Interestingly, frequency resolution and temporal resolution for acoustic signals are inversely re-lated to one another, both at the species and individual level in songbirds [20], implying the spectral and tem-poral features may contribute differently in vocal com-munication or perception of auditory object, i.e. the fundamental perceptual unit in hearing [21, 22]. Yet, there is still much that remains unknown about how auditory system represents the differences between these two features.
In anurans, survival and reproductive behaviors de-pend primarily on a listener’s ability to parse acoustic signals that convey species identity and individual infor-mation [23]. Usually, males are highly vocal and gener-ally produce species-specific advertisement calls to attract females for breeding, as well as to deter rivals
[24–26]. For species discrimination, either temporal
in-formation [5, 27] or spectral one [14, 28] may be more important in many anuran species. For individual recog-nition, the fundamental frequency and correlated spec-tral properties in advertisement calls of some species are often the most individually distinct call properties and contribute toward assigning calls to correct individuals [13–15,29–31]. In contrast, female choices in some spe-cies are often mediated by temporal characteristics of calls [5, 32–34]. Interestingly, the temporal and spectral acoustic cues are used for sexual identity recognition
and conveying female attractiveness respectively in Xen-opus laevis [35]. These results suggest that the signifi-cance of temporal and spectral features of vocalizations is asymmetrical and species-specific for vocal communi-cation. Numerous studies suggest that anurans have neural specializations for analyzing the temporal and spectral structures. In addition, anurans typically exhibit
a small vocal repertoire and communicate in
well-defined behavioral contexts making these species well suited for studies of auditory perception [36, 37]. However, it is still unknown how auditory system repre-sents this asymmetrical and species-specific differences in temporal and spectral features of vocalizations ob-served in behaviors.
The Emei music frog (Babina daunchina) is a typical seasonal reproductive species in which males produce advertisement calls either from inside underground nest burrows or from outside burrows in the breeding season
[38–41]. The resonant properties of the nest burrows
modify call acoustics, such as extending note duration and decreasing note fundamental frequency, yielding two types of advertisement calls. Calls produced from in-side the nests are highly sexually attractive (HSA) to fe-males while those produced from open fields are of low sexual attractiveness (LSA) [40]. Females prefer HSA calls to LSA calls in phonotaxis experiments and males more likely to compete against HSA calls compared to LSA calls [40,41], consistent with the idea that selective attention may be involved in anuran auditory perception
[42, 43] and males can maximize fitness by adjusting
ERP is the measured brain response to a specific sen-sory, cognitive or motor event [52], whose amplitudes and latencies can be used to examine processing effi-ciency and time course of information processing in the brain. Auditory ERPs generally consist of three main components (N1, P2 and P3) which peak at latencies of ~ 80 ms, ~ 200 ms and ~ 300 ms, respectively [53–57]. Functionally, N1 with negative peak is sensitive to select-ive attention [53]; P2 with positselect-ive peak is sensitselect-ive to the stimulus complexity and the subject’s familiarity with the sound [54]; while P3 can be divided into two general types: P3a elicited by novel deviant stimulus with passive paradigm and P3b (the conventional P3) elicited by the target stimulus with active paradigm [58]. P3a, also known as “novelty P300” [59], is a reflection of auto-matic detection of a different stimulus or stimulus rela-tive novelty, i.e. novel or more salient differences between standard and deviant stimuli produce larger P3a waves [60]. In addition, familiar sounds evoke smaller P3a compared with unfamiliar ones [61]. More-over, humanlike auditory ERP components, found in various taxa including non-human primates [62], mam-mals [63, 64] and anurans [45, 48, 65], may indicate similar brain functions because important neuroanatom-ical features have been conserved during vertebrate brain evolution [66, 67]. Since discrete brain regions may be specialized for different functions [51], the present study measured the amplitude and latency of each ERP component for the left and right hemispheres in response to three acoustic stimuli (the original adver-tisement call, OC; and its transformation version with temporal and spectral features preserved respectively, TC and SC) in order to investigate how auditory central nervous system represents the differences of these two call features in auditory neural processing. Furthermore, the fundamental perceptual unit in hearing is auditory object [21, 22], and that its neural representation must be based on information conveyed by one or more senses. Under these conditions we predicted that (1) more similar ERP components would be evoked by OC and TC if auditory processing of conspecific vocalization prefers to temporal features in the music frog; (2) alterna-tively, more similar ERP components would be evoked by OC and SC if the neural processing depends on spectral features primarily; and (3) ERP components will vary across brain structures such as various portions of a brain region.
Materials and methods Animals and surgery
Sixteen adult frogs (8 males and 8 females) were cap-tured from the Emei mountain area of Sichuan, China for the present experiments. Animal husbandry and la-boratory animal care were the same as used in previous work and have been described elsewhere [49, 68, 69].
Briefly, the male and female frogs were separated by sex and were breeding in different plastic tanks (45 × 35 cm2 and 30 cm deep) which were paved with mud and water and the subjects were fed fresh live crickets every 3 days. The tanks were placed in a constant temperature room (23 ± 1 °C) that was maintained on a 12:12 light-dark cycle (lights on at 08:00). At the time of surgery, the mean mass and length of the subjects were 11.0 ± 0.6 g and 4.6 ± 0.1 cm respectively.
The experiments were performed during the repro-ductive season of this species. Briefly, after anesthetizing the subject using a 0.15% tricaine methanesulfonate (MS-222) solution [70,71], 17 cortical electroencephalo-gram (EEG) recording electrodes, consisting of mini-ature stainless steel screws (φ 0.5 mm), were implanted in the skull. Sixteen electrodes were distributed in the left and right sides of telencephalon (TL1, TR1, TL2, TR2, TL3, TR3), diencephalon (DL4, DR4) and mesen-cephalon (ML5, MR5, ML6, MR6, ML7, MR7, ML8, MR8), respectively. The reference electrode (C) was placed on the cerebellum (Fig. 1). All electrode leads were formvar-insulated nichrome wires with one end interwined tightly around the screws and the other end tin soldered to the female-pins of an electrical con-nector. Electrodes were fixed to the skull with dental acrylic. The connector was covered with a self-sealing membrane (Parafilm® M; Chicago, USA) that was water-proof and located about 1 cm above the head of the animal. Finally, the skin edges and muscles sur-rounding the wound were treated with the ointment with triple antibiotic and pain relief (CVS pharmacy, Woonsocket, RI, USA) to prevent infection and discom-fort. Each frog was housed individually for 6 days for re-covery before conducting further experiments. After all experiments were completed, the subjects were eutha-nized by overdose of MS-222 and electrode localizations were confirmed by injecting hematoxylin dye through the skull holes in which the electrodes were installed previously [68].
Recording conditions
An opaque plastic tank (80 × 60 cm2 and 60 cm deep) containing mud and water was placed in a soundproof and electromagnetically shielded chamber (background noise 24.3 ± 0.7 dB). An infrared camera with a motion detector was mounted centrally about one meter above the tank for monitoring the subjects’ movement behav-iors. Electrophysiological signals were recorded with a signal acquisition system (OmniPlex 64-D, Plexon, USA). And that the sampling rate was set to 1000 Hz.
Stimuli and paradigm
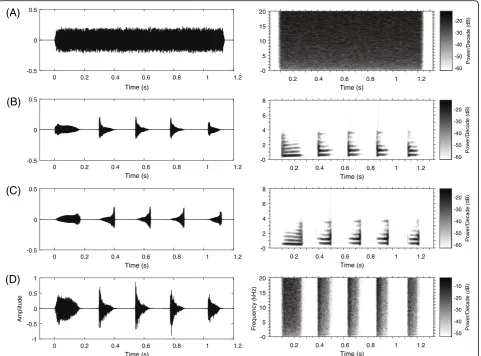
contain the same frequencies at the same relative ampli-tudes as the natural calls although they show frequency modulated (FM) sweeps of reversed order for FM calls [72]. In the present study, four stimuli were used: white noise (WN), a conspecific advertisement call, its reverse version (i.e. each note of the call was reversed so that most spectral attributes of the call was preserved, SC) and its envelope version (i.e. the call envelope filled with white noise so that the most temporal attributes of the call was preserved, TC). The acoustic recording used as playback call was subject to the following criteria: (1) the call contained five notes, which is equal to the mean number of notes in natural male calls and (2) the temporal and frequency parameters of the call were close to the population average. WN without any species-specific temporal-spectral features was constructed and its duration equaled to the duration of the conspecific calls (about 1.2 s), shaped with rise and fall time sinusoidal periods of 10 ms (Fig.2). Stimuli were played back to sub-jects via two portable field speakers (SME-AFS, Saul Miner-off Electronics, Elmont, NY, USA) that were placed equidistantly from the opposite ends of the experimental tank. Each stimulus was presented through the two
speakers simultaneously at 65 dB SPL (re 20 μPa,
C-weighting, fast response; Aihua, AWA6291; Hangzhou, China) measured at the center of the tank, approximately equals to the mean of natural sound pressure level of male calls [38]. Under these conditions, the sound level distribu-tion at the bottom of the bank was close to a quasi-free sound field. Furthermore, subjects usually remained mo-tionless at one corner of the tank throughout the experi-ments. It is highly unlikely that the tiny differences in the stimulus amplitude across the tank bottom could have a significant effect on the ERP measures.
The oddball paradigm was used in the present study with WN as the standard stimulus and others as the
deviant stimuli, in which the probability of presentation for the standard stimulus was 70% and that for each de-viant was 10%. Thus, for each subject a total of 1000 stimulus presentations with each deviant stimulus pre-sented 100 times were broadcasted in a random order within three trial blocks. Randomization was constrained to prevent more than three deviant stimuli from within the same acoustic category being presented successively. A trigger pulse was sent to the signal acquisition system at every stimulus onset through the parallel port for fur-ther time-locking analysis. Because the influence of tar-get stimulus probability on P3 amplitude would wane considerably under longer inter-stimulus intervals (ISI) in humans [73], the ISI less than 2 s was used in most animal studies [45, 64, 74]. In this study, the ISI was set to 1.5 s although the mean natural inter-call interval of the music frogs is 3.3 s [41]. Consequently, the session lasted about 50 min with 5 min breaks between blocks so that the subjects would not become fatigued [75].
ERP signal collection and measurement
After postoperative recovery for 6 days, the subject was placed in the experimental tank and connected to the sig-nal acquisition system for about 24 h habituation. Then the EEG signal and behavioral data were collected accord-ing to the above described auditory stimulation paradigm. In order to eliminate the effects of digestion, the subject was not fed during the experimental period. To extract ERP components, EEG recordings were filtered offline using a band-pass filter at 0.25–25 Hz and a notch filter to eliminate possible interference at 50 Hz before averaging the stimulus-locked EEG epochs. The EEG signals were divided into epochs with a duration of 700 ms, including a prestimulus baseline of 200 ms. All single EEG trials were inspected visually and trials with muscle artifacts and 30µv 1s
TL1
TR2
TR3 TL3
C
TL2 TR1
DL4 DR4
ML6 MR6 ML8 MR8 ML5
ML7
MR5 MR7
ML5
ML6
MR6
MR5
ML7
ML8
MR8
MR7 TL1
TR1
TL2
TR2
TL3
TR3
DL4
DR4
TR22
TR3 TR1 TR
T
T
T
T
TL1L
TL3 TL2
Fig. 1Electrode placements and their 20 s of typical EEG tracings. The intersection of the three dashed lines in bold in the frog head denotes the
intersection of suture lines corresponding to lambda. The electrodes coordinates: TL1 (−1.5, 3.8), TR1 (1.5, 3.8), TL2 (−1.5, 2.4), TR2 (1.5, 2.4), TL3
(−1.5, 1), TR3 (1.5, 1); DL4 (−0.8,−0.2), DR4 (0.8,−0.2); ML5 (−2.2,−1.6), ML6 (−0.8,−1.6), MR6 (0.8,−1.6), MR5 (2.2,−1.6), ML7 (−2.2,−3.5), ML8
electrode drifts were removed from all further analysis. Accepted trials were averaged according to stimulus types and channels within each session.
For each component, the peak was found in the grand average ERP waveforms for each stimulus and each channel. Then the median was calculated regardless of stimuli and channels, and that the time window with 100 ms in width was defined with the median as the midpoint. Similar to other studies [45,76–79], the audi-tory ERP component N1 was defined as the mean ampli-tude during latency intervals of 30–130 ms, P2 during intervals of 150–250 ms and P3a during intervals of 250–350 ms after stimulus onset. The latency was deter-mined by the“50 percent area latency measure”for each ERP component [52], i.e. measuring the area under the curve within the time windows and finding the time point that divided this area into equal halves. Since dif-ference waveform can be used to compare the relative variation between the ERP responses to the different de-viants, they were obtained by subtracting the component
amplitude in response to WN from the amplitude in re-sponse to various versions of conspecific calls. Then the amplitude and latency of each ERP component acquired from the difference waveforms (OC-WN, SC-WN and TC-WN) were subjected to further statistical analyses.
Statistical analyses
The Shapiro-Wilk Wtest and Levene’s test were applied to estimate the normality of the distribution and the homogeneity of variances of the amplitudes and laten-cies of N1, P2 and P3a, respectively. Since the number of levels of an independent variable has been suggested to be less than eight [80], the amplitudes and latencies of ERP components were statistically analyzed for the telencephalon, diencephalon and mesencephalon re-spectively. A three-factor repeated measured ANOVA was conducted with the variables of“sex”(male/female),
“stimulus” (OC/SC/TC) and “channel” (TL1, TR1, TL2, TR2, TL3 and TR3 for the telencephalon; DL4 and DR4 for the diencephalon; ML5, MR5, ML6, MR6, ML7,
(A)
(B)
(C)
(D)
Amplitude
Frequency (kHz)
0 0.2 0.4 0.6 0.8 1 1.2
Time (s) -0.5
0 0.5
0 0.2 0.4 0.6 0.8 1 1.2
Time (s) -0.5
0 0.5
0 0.2 0.4 0.6 0.8 1 1.2
Time (s) -0.5
0 0.5
0 0.2 0.4 0.6 0.8 1 1.2
Time (s) -1
-0.5 0 0.5 1
0.2 0.4 0.6 0.8 1 1.2 Time (s)
-0 5 10 15 20
-60 -50 -40 -30 -20
Power/Decade
(dB
)
0.2 0.4 0.6 0.8 1 1.2 Time (s)
-0 2 4 6 8
-60 -50 -40 -30 -20
Power/Decade (dB)
0.2 0.4 0.6 0.8 1 1.2 Time (s)
-0 2 4 6 8
-60 -50 -40 -30 -20
Power/Decade (dB)
0.2 0.4 0.6 0.8 1 1.2 Time (s)
-0 5 10 15 20
-50 -40 -30 -20 -10
Power/Decade (dB)
Fig. 2Waveforms and spectrograms of the four stimuli:aWhite noise (WN);bthe original call (OC);cthe version with each original note
reversed (only spectral characteristics remained, SC);dthe version with white noise enveloped by the original note (only temporal characteristics
MR7, ML8 and MR8 for the mesencephalon). Both main effects and interactions were examined; if ANOVAs returned a significant difference, the data would be fur-ther tested for multiple comparisons using the least significant difference test. If the interaction was
signifi-cant, simple effects analysis would be applied.
Greenhouse-Geisser epsilon (ε) values would be
employed when the null hypothesis of mauchly’s test of sphericity was violated. Effect size was decided by partial
η2
(partial η2= 0.20 is set as a small, 0.50 as a medium and 0.80 as a large effect size, respectively) [81]. SPSS software (release 20.0) was applied for the statistical ana-lysis with the significance level ofp< 0.05.
Results
The grand average of the original and difference wave-forms are shown in Figs. 3 and 4, respectively. There were significant differences among stimuli and sexes but not brain structures in amplitude rather than latency for
each ERP component, respectively. Furthermore, SC compared with TC could elicit a more similar response to OC (Table1).
The amplitude and latency of the N1 component
The analysis for the N1 amplitude showed that there was significant main effect for the factor “stimulus” for the telencephalon (F(2,28) = 6.046, Partialη2= 0.302,p= 0.007), diencephalon (F(2,28) = 18.626, Partialη2= 0.571, p< 0.001) and mesencephalon (F(2, 28) = 14.442, partial
η2
= 0.508, p< 0.001), respectively. However, there was no significant main effect for the factors“sex”(F(1,14) = 0.007, Partialη2= 0.000, p= 0.935 for the telencephalon; F(1,14) = 0.219, Partial η2= 0.015, p= 0.647 for the di-encephalon; and F(1,14) = 0.076, Partial η2= 0.005, p= 0.787 for the mesencephalon) and “channel” (F(5,70) = 0.720, ε= 0.489, Partial η2= 0.049, p= 0.520 for the tel-encephalon; F(1,14) = 1.003, Partial η2= 0.067, p= 0.334 for the diencephalon; and F(7,98) = 0.851, ε= 0.403,
-100 0 100 200 300 400 500
-6 -5.5 -5 -4.5 -4 -3.5 -3 -2.5 -2 -1.5 -1 -0.5
0.5 1 1.5
-100 0 100 200 300 400 500
-6 -5.5 -5 -4.5 -4 -3.5 -3 -2.5 -2 -1.5 -1 -0.5
0.5 1 1.5
-100 0 100 200 300 400 500
-6 -5.5 -5 -4.5 -4 -3.5 -3 -2.5 -2 -1.5 -1 -0.5
0.5 1 1.5
-100 0 100 200 300 400 500
-6 -5.5 -5 -4.5 -4 -3.5 -3 -2.5 -2 -1.5 -1 -0.5
0.5 1 1.5
Time (msec) Time (msec)
)
V
µ(
e
d
util
p
m
A
)
V
µ(
e
d
util
p
m
A
Time (msec) Time (msec)
)
V
µ(
e
d
util
p
m
A
)
V
µ(
e
d
util
p
m
A
ML5 ML6 MR6 MR5
ML7 ML8 MR8 MR7
TL1 TR1 TL2 TR2
TL3 TR3 DL4 DR4
N1
P2 P3a
WN OC SC TC
Fig. 3Grand average ERP waveforms with half of the standard errors for different brain regions during playbacks of white noise (WN), the
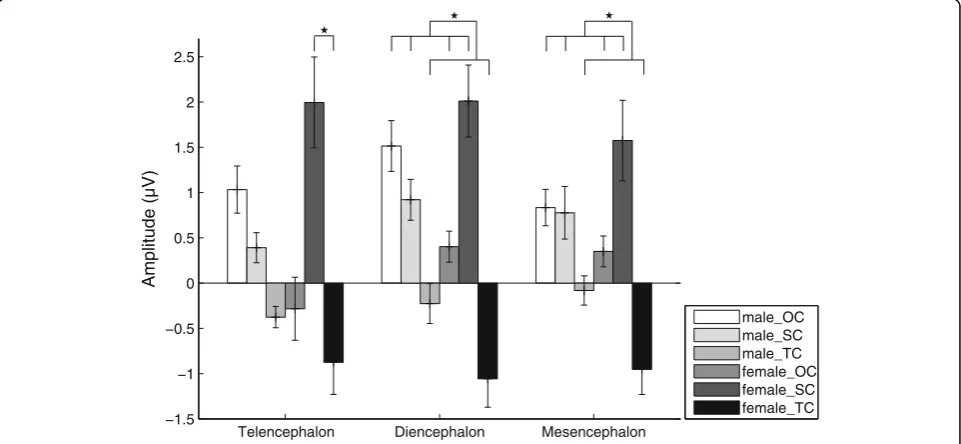
Partial η2= 0.057, p= 0.469 for the mesencephalon). Multiple comparisons showed that the N1 amplitudes evoked by TC were significantly greater than those evoked by OC and SC although the difference between OC and TC did not reach statistical significance for the telencephalon, while the N1 amplitudes evoked by OC was significantly higher than that by SC for the di-encephalon and mesdi-encephalon (p< 0.05; Fig. 5 and Table2). In addition, for N1 latency there was no signifi-cant main effect or interaction for any factor.
The amplitude and latency of the P2 component
For the P2 amplitude, there was significant main effect for the factor “stimulus” for the telencephalon (F(2, 28) = 5.064, partial η2= 0.266, p= 0.013), diencephalon (F(2, 28) = 8.003, partialη2= 0.364,p= 0.002) and mesenceph-alon (F(2, 28) = 5.844, partial η2= 0.294, p= 0.008), re-spectively. However, there was no significant main effect for the factors“sex”(F(1,14) = 0.013, Partialη2= 0.001,p Time (msec)
Time (msec)
)
V
µ(
e
d
util
p
m
A
)
V
µ(
e
d
uti
l
p
m
A
Time (msec) Time (msec)
)
V
µ(
e
d
uti
l
p
m
A
)
V
µ(
e
d
util
p
m
A
ML5 ML6 MR6 MR5
ML7 ML8 MR8 MR7
TL1 TR1 TL2 TR2
TL3 TR3 DL4 DR4
DOC DSC DTC
-3 -2.5 -2 -1.5 -1 -0.5
0.5 1 1.5 2 2.5 3
-100 0 100 200 300 400 500
-3 -2.5 -2 -1.5 -1 -0.5
0.5 1 1.5 2 2.5 3 -3
-2.5 -2 -1.5 -1 -0.5
0.5 1 1.5 2 2.5 3 -3
-2.5 -2 -1.5 -1 -0.5
0.5 1 1.5 2 2.5 3
-100 0 100 200 300 400 500 -100 0 100 200 300 400 500
-100 0 100 200 300 400 500
Fig. 4Grand average of difference waveforms with half of the standard errors for different brain regions during playbacks of the original call
(DOC), the version with each original note reversed (only spectral characteristics remained, DSC); the version with white noise enveloped by the original note (only temporal characteristics remained, DTC), respectively
Table 1The differences between OC and SC or TC (OC-SC and
OC-TC) for each ERP component
ERP component brain region OC-SC OC-TC
N1 Telencephalon −0.9606 1.0952
Diencephalon −1.0384 1.6570
Mesencephalon −1.0701 1.1728
P2 Telencephalon −0.8183 1.0006
Diencephalon −0.5074 1.5998
Mesencephalon −0.5834 1.1094
P3a Telencephalon −2.5335 −1.4414
Diencephalon −1.9293 −0.3262
Mesencephalon −1.5394 −0.2660
Telencephalon Diencephalon Mesencephalon −2
−1.5 −1 −0.5 0 0.5 1 1.5 2
Amplitude (µV)
male_OC male_SC male_TC female_OC female_SC female_TC
Fig. 5Means and standard errors for N1 amplitudes during playbacks of the three deviant stimuli for the telencephalon, diencephalon and
mesencephalon respectively. OC, the original call; SC, the version with each original note reversed (only spectral characteristics remained); TC, the version with white noise enveloped by the original note (only temporal characteristics remained)
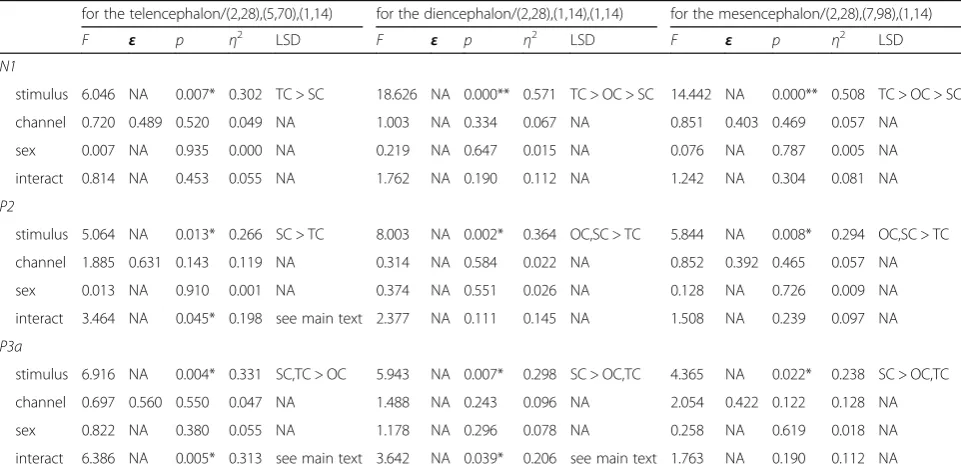
Table 2Results of ANOVAs for the amplitudes of N1, P2 and P3a with respect to the three factors for the telencephalon,
diencephalon and mesencephalon respectively
for the telencephalon/(2,28),(5,70),(1,14) for the diencephalon/(2,28),(1,14),(1,14) for the mesencephalon/(2,28),(7,98),(1,14)
F ε p η2 LSD F ε p η2 LSD F ε p η2 LSD
N1
stimulus 6.046 NA 0.007* 0.302 TC > SC 18.626 NA 0.000** 0.571 TC > OC > SC 14.442 NA 0.000** 0.508 TC > OC > SC
channel 0.720 0.489 0.520 0.049 NA 1.003 NA 0.334 0.067 NA 0.851 0.403 0.469 0.057 NA
sex 0.007 NA 0.935 0.000 NA 0.219 NA 0.647 0.015 NA 0.076 NA 0.787 0.005 NA
interact 0.814 NA 0.453 0.055 NA 1.762 NA 0.190 0.112 NA 1.242 NA 0.304 0.081 NA
P2
stimulus 5.064 NA 0.013* 0.266 SC > TC 8.003 NA 0.002* 0.364 OC,SC > TC 5.844 NA 0.008* 0.294 OC,SC > TC
channel 1.885 0.631 0.143 0.119 NA 0.314 NA 0.584 0.022 NA 0.852 0.392 0.465 0.057 NA
sex 0.013 NA 0.910 0.001 NA 0.374 NA 0.551 0.026 NA 0.128 NA 0.726 0.009 NA
interact 3.464 NA 0.045* 0.198 see main text 2.377 NA 0.111 0.145 NA 1.508 NA 0.239 0.097 NA
P3a
stimulus 6.916 NA 0.004* 0.331 SC,TC > OC 5.943 NA 0.007* 0.298 SC > OC,TC 4.365 NA 0.022* 0.238 SC > OC,TC
channel 0.697 0.560 0.550 0.047 NA 1.488 NA 0.243 0.096 NA 2.054 0.422 0.122 0.128 NA
sex 0.822 NA 0.380 0.055 NA 1.178 NA 0.296 0.078 NA 0.258 NA 0.619 0.018 NA
= 0.910 for the telencephalon; F(1,14) = 0.374, Partial η2 = 0.026, p= 0.551 for the diencephalon; and F(1,14) = 0.128, Partial η2= 0.009, p= 0.726 for the mesenceph-alon) and“channel”(F(5,70) = 1.885,ε= 0.631, Partialη2 = 0.119, p= 0.143 for the telencephalon; F(1,14) = 0.314, Partial η2= 0.022, p= 0.584 for the diencephalon; and F(7,98) = 0.852,ε= 0.392, Partialη2= 0.057,p= 0.465 for the mesencephalon). And that the interaction between
“sex” and “stimulus” was significant (F(2, 28) = 3.464, partial η2= 0.198, p= 0.045) for the telencephalon. Sim-ple effects analysis showed that the P2 amplitude evoked by SC was significantly higher than that by TC in fe-males (p< 0.05; Fig.6and Table2). For the diencephalon and mesencephalon, the P2 amplitudes evoked by OC and SC were significantly higher than that evoked by TC (p< 0.05; Fig. 6 and Table 2). Similarly, for P2 latency there was no significant main effect or interaction for any factor.
The amplitude and latency of the P3a component
For the P3a amplitude in the telencephalon, there was significant main effect for the factor“stimulus”(F(2, 28) = 6.916, partial η2= 0.331, p= 0.004) but not the factors
“sex” (F(1, 14) = 0.822, partial η2= 0.055, p= 0.380) and
“channel” (F(5, 70) = 0.697, ε= 0.560, partial η2= 0.047, p= 0.550). Moreover, the interaction between “sex” and
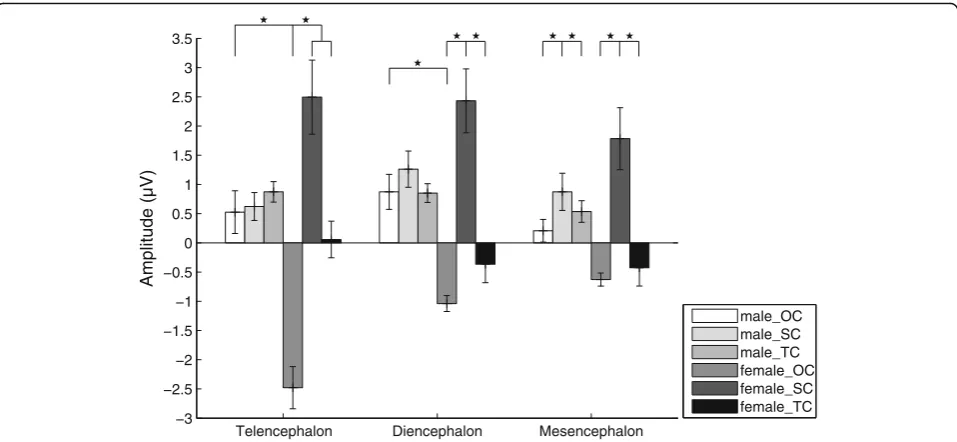
“stimulus” was significant (F(2, 28) = 6.386, partial η2= 0.313,p= 0.005). The P3a amplitudes evoked by SC and TC were significantly higher than that evoked by OC in females (p< 0.05; Fig. 7 and Table 2), and that the P3a amplitude in males evoked by OC was significantly
higher than that evoked in females. For the dienceph-alon, there was significant main effect for the factor
“stimulus” (F(2, 28) = 5.943, partialη2= 0.298, p= 0.007) but not the factors “sex” (F(1, 14) = 1.178, partial η2= 0.078, p= 0.296) and “channel” (F(1, 14) = 1.488, partial
η2
= 0.096, p= 0.243). Moreover, the interaction between
“sex” and “stimulus” was significant (F(2, 28) = 3.642, partial η2= 0.206, p= 0.039). The P3a amplitude evoked by SC was significantly higher than those evoked by OC and TC in females (p< 0.05; Fig.7and Table2), and that the P3a amplitude in males evoked by OC was signifi-cantly higher than that evoked in females. For the mes-encephalon, there was significant main effect for the factor “stimulus”(F(2, 28) = 4.365, partialη2= 0.238, p= 0.022) but not the factors “sex” (F(1, 14) = 0.258, partial
η2
= 0.018,p= 0.619) and“channel”(F(7, 98) = 2.054,ε= 0.422, partial η2= 0.128, p= 0.122). The P3a amplitude evoked by SC was significantly higher than those evoked by OC and TC (p< 0.05; Fig. 7 and Table 2). Similarly, for P3a latency there was no significant main effect or interaction for any factor.
Discussion
The present study showed that when the three deviant stimuli consisting of OC, SC and TC were presented 1) although some differences did not reach statistical sig-nificance for the telencephalon, the N1 amplitude evoked by TC was significantly greater than those evoked by OC and SC, while the N1 amplitude evoked by OC was significant greater than that by SC; 2) the P2 amplitudes evoked by OC and SC were significantly
Telencephalon Diencephalon Mesencephalon
−1.5 −1 −0.5 0 0.5 1 1.5 2 2.5
Amplitude (µV)
male_OC male_SC male_TC female_OC female_SC female_TC
Fig. 6Means and standard errors for P2 amplitudes during playbacks of the three deviant stimuli for the telencephalon, diencephalon and
greater than that by TC although the difference between OC and TC did not reach statistical significance for the telencephalon; 3) the P3a amplitudes evoked by SC and TC were significantly higher than by OC although the differences between TC and OC did not reach statistical significance for the diencephalon and mesencephalon; in addition, P3a amplitudes in the forebrain evoked by OC were significantly higher in males than in females. These results are consistent with the hypothesis that auditory processing of conspecific vocalization prefers to spectral features compared with temporal ones in the music frog. Moreover, the current results suggest that the neural processing for auditory perception is sexually dimorphic.
Neural processing of conspecific vocalization prefers to spectral features
Spectral and temporal processing refers to the transfor-mations in how the spectral and temporal structures of sounds is represented in the central auditory system. In the present study, significant differences in N1 and P2 amplitudes were found exclusively between TC and other two stimuli in most conditions, although N1 am-plitudes evoked by OC were also significantly higher than those by SC. In addition, the absolute values of dif-ference of N1 or P2 amplitudes between OC and SC were smaller than those between OC and TC (Table 1), thus compared with TC the neural responses to SC were more similar to those for OC. Although SC shows re-versed order of FM sweeps compared with OC, SC con-tains the same frequencies at the same relative amplitudes as OC. Accordingly, the present results were
consistent with the prediction that more similar ERP components would be evoked by OC and SC if neural processing of conspecific vocalization depends on spec-tral features primarily. Compared with other deviant stimuli, higher N1 amplitude evoked by TC is consistent with the idea that the negative N1 waves can be affected by selective attention which enhances the perception of high-priority stimuli at the expense of other stimuli in the environment [53, 82]. Animals usually pay attention to conspecific sounds with high salience and generally maintain alertness to absolute novelty of sounds (accord-ing to past auditory experience of the subject) which may be associated with danger [83–85], and that the stimuli with high emotional valence may capture atten-tion [86, 87]. Accordingly, this strong selective pressure would likely result in a large “N1 effect of selective at-tention” [88]. Since more similar N1 was evoked by OC and SC, higher N1 amplitude evoked by TC would be more likely resulted from absolute novelty rather than conspecific salience involved in this sound. In addition, N1 is known to be sensitive to onset parameters [76] such as rise time with N1 peak amplitude reducing when stimulus rise time increases [89]. Consistent with this, the present results showed that the N1 amplitude evoked by SC with longest rise time was smallest.
The P2 component reflects the process of signal evalu-ation and classificevalu-ation, and is thought to be a connected with the memory processing and will compare the real-time perception input with the memory [54,90,91]. Moreover, its amplitude enhancement can result from prolonged training in mammals. Therefore P2 amplitude
Telencephalon Diencephalon Mesencephalon
−3 −2.5 −2 −1.5 −1 −0.5 0 0.5 1 1.5 2 2.5 3 3.5
Amplitude (µV)
male_OC male_SC male_TC female_OC female_SC female_TC
Fig. 7Means and standard errors for P3a amplitudes during playbacks of the three deviant stimuli for the telencephalon, diencephalon and
can be enhanced by familiarity or similarity between the target and current stimulus [54, 90–93], i.e. more famil-iar stimuli will evoke larger P2 waveforms [94]. Since humanlike auditory ERP components may indicate simi-lar brain functions because of important conserved neuroanatomical features in vertebrate brain [66, 67], the present results showing OC and SC evoked higher P2 amplitude than TC did suggest SC compared with TC seemed to be more like conspecific vocalization. However, future research is required to verify it via be-havioral experiments. In addition, the acoustic complex-ity can effect on the P2 amplitude significantly [95]. If this is the case, TC would be expected to evoke a rela-tively larger P2 amplitude because of its most complex-ity. However, OC and SC actually evoked a larger P2 amplitudes compared with TC, so it is likely that these results for P2 did not occur because of the presumed ef-fects of complexity, thus implying that the similar spec-tral characteristics of sounds are the key factors for P2 profiles in the music frogs. Thus, neural processing of conspecific vocalization may prefer to spectral features in this species. This speculation has been verified partly by discriminant function analysis of calls in the music frog [38], which show the spectral features may provide more sufficient information for individual recognition compared with the temporal ones.
At the individual level, some kinds of acoustic proper-ties of advertisement calls typically show very little vari-ation (static properties) and others are highly variable (dynamic properties) [96]. Variability in static properties is usually constrained within individual, therefore these properties are highly invariant from call to call within and between bouts of calling by an individual. Typically these properties include spectral features such as the fundamental frequency or dominant frequency or carrier frequency and fine-scale temporal properties such as the duration, rise-fall features and repetition rate of the short sounds (pulses) [96]. In contrast, anuran individ-uals readily alter gross-temporal properties of advertise-ment calls within and between calling bouts, such as the rate of calling, duration of calls or call-notes and rate of call-note production [97]. Since such signals may be more easily detected against the chorus background, fe-males usually prefer calls with longer duration and higher rate. However, for an individual of the music frogs the spectral attributes of advertisement call remain relatively stable compared with the temporal ones [38, 41,98], suggesting the static properties in this species in-clude spectral features primarily rather than temporal characteristics. Taken together, static variables, i.e. spec-tral features in the music frogs, are presumably more important for species discrimination and individual rec-ognition, although dynamic variables like call rate and call duration are indicative of motivation or quality of
the emitter [97] and may play an important role in fe-male choice.
Auditory perception on temporal and spectral features of calls exhibits sexual dimorphism
Sexually dimorphic behaviors are widespread in vocal animals such as insects, birds and anurans [48, 65, 99– 105]. In general, females may be mute or exhibit a se-verely limited vocal repertoire while males are typically
highly vocal and generally produce complex
species-specific vocalizations to attract females for breeding, as well as to deter rivals [24, 106]. Moreover, males and females often react differently in response to conspecific calls, during which males are much more likely than females to respond to signals which vary from the species’norm [101]. These behavioral differences de-pend on neural systems that are sex-specific or common to males and females but potentially regulate a number of behaviors differently [107]. In other words, sex differ-ences in auditory processing may reflect differdiffer-ences in the requirement for processing sex-specific aspects of vocal signals [97].
The present results show that the P3a amplitudes evoked by OC are significantly greater for males than fe-males regardless of brain area, although the differences for the mesencephalon did not reach statistical signifi-cance (Fig.7). P3a is usually evoked by the novel
stimu-lus (relative novelty) with small proportion of
occurrence [108]. Its amplitude is appears to be a reflec-tion of automatic detecreflec-tion of a different stimulus or stimulus relative novelty, i.e. novel or more salient differ-ences between standard and deviant stimuli produce lar-ger P3a waves [60]. Furthermore, familiar sounds evoke smaller P3a compared with unfamiliar ones [61]. In this way, SC would be expected to evoke a relatively larger P3a amplitude because of sound familiarity for OC and almost identical spectral attributes between standard and TC.
perception. These sex differences are consistent with the fact that the cost of not responding to a potential sexual signal would be greater in males than females while the cost of responding inappropriately to sexual solicitation signals would be greater in females than males [110, 111]. Interestingly, the auditory brainstem response amplitude of male house sparrows (Passer domesticus), increases at a greater rate than that of females as the amplitude of the stimulus increases [16]. These findings, including the present results, suggest that sex differences in auditory processing occur but that the exact nature of these differences is both species specific and time spe-cific, and that sexual dimorphism in auditory perception evolved in diverse vocal species.
The present results also show that the P3a amplitudes evoked by SC and TC in the telencephalon and di-encephalon are greater than that by OC in females but not males. These results are generally consistent with other studies on P3a, showing less relative novelty or more familiarity in sounds elicit decreased P3a ampli-tude while more relative novelty or less familiarity in sounds elicit increased P3a amplitude [61] and with the idea that the forebrain may play an important role in auditory perception [65]. No specific sensory areas in the anuran telencephalon appear homologous to the auditory areas of the amniote telencephalon insofar as the anuran pallium is not parcellated into discrete func-tional areas, although widespread connections linking forebrain neurons to motor and/or endocrine systems and limbic structures exist [112]. Thus the sex differ-ences in P3a amplitude in the telencephalon observed in the present study may reflect the differential effects in males and females of selection pressures associated with identifying male conspecific call differences and in deci-sion making associated with responding to male calls. Consistent with this, simple stimuli such as clicks gener-ally fail to excite cells in the frog telencephalon [113]; in contrast, complex signals similar to natural calls can in-duce large neuronal responses in the striatum and med-ial pallium. Lesions of the striatum, superficmed-ial and deep thalamic structures may disrupt vocal recognition [114], indicating that telencephalic and thalamic areas play im-portant roles in call recognition. Consequently, more tel-encephalic resources appear to be involved in higher level cognition functions such as mate choice in females than in males during the breeding season.
Conclusion
Taken together, we found evidence that more similar ERP components were evoked by the original call and its transformation version with most spectral features pre-served, compared with the other version with temporal characteristics preserved. Moreover, the P3a amplitudes in the forebrain evoked by the original call were
significantly higher in males than in females. These
re-sults suggest neural processing for conspecific
vocalization may prefer to the spectral features of species-specific call in the music frogs, prompting speculation that the spectral features may play more im-portant roles in auditory object perception or vocal communication in this species. In addition, the neural processing for auditory perception is sexually dimorphic.
Acknowledgements
We would like to thank Jianguo Cui for his suggestions on experimental designs. We also thank the two anonymous reviewers for helpful comments on the manuscript.
Funding
This work was supported by the grants from the National Key Research and Development Program of China (No. 2016YFC0500104) and the National Natural Science Foundation of China (No. 31672305 and No. 31372217 to G.F., No. 31572275 to Y.T.).
Availability of data and materials
The datasets used and/or analyzed during the current study are available from the corresponding author on reasonable request.
Authors’contributions
GF and YT conceived the project. YF, XY and GF designed the experiment. XY, JY, JS and DS collected the data. YF and XY analyzed the dataset and wrote the original draft. Funding Acquisition and Resources: YT and GF. All authors contributed critically in preparing the manuscript and gave final approval for publication.
Ethics approval
All experimental procedures were approved by the Animal Care and Use Committee of Chengdu Institute of Biology. All surgeries were performed with tricaine methanesulfonate (MS-222) anesthesia and all efforts were made to minimize discomfort.
Consent for publication
Not applicable.
Competing interests
The authors declare that they have no competing interests.
Publisher’s Note
Springer Nature remains neutral with regard to jurisdictional claims in published maps and institutional affiliations.
Author details
1
Department of Herpetology, Chengdu Institute of Biology, Chinese Academy of Sciences, No.9 Section 4, Renmin Nan Road, Chengdu, Sichuan 610041, People’s Republic of China.2University of Chinese Academy of Sciences, 19A Yuquan Road, Beijing, People’s Republic of China.
Received: 6 November 2018 Accepted: 22 April 2019
References
1. Xu J, Gooler DM, Feng AS. Effects of sound direction on the processing of
amplitude-modulated signals in the frog inferior colliculus. J Comp Physiol
A. 1996;178:435–45.
2. Naguib M, Janik V, Clayton N, Zuberbuhler K. Vocal communication in birds
and mammals. London: Academic Press; 2009.
3. Ronacher B. Processing of species-specific signals in the auditory pathway
of grasshoppers. In: Berthold H, editor. Insect hearing and acoustic
communication. New York: Springer; 2014. p. 185–204.
4. Feng AS, Schul J. Sound processing in real-world environments. In: Narins
PM, Feng AS, Fay RR, Popper AN, editors. Hearing and sound
5. Schwartz JJ. The importance of spectral and temporal properties in species and call recognition in a neotropical treefrog with a complex vocal
repertoire. Anim Behav. 1987;35:340–7.
6. Capranica RR, Moffat AJ. Neurobehavioral correlates of sound
communication in anurans. In: Ewert JP, editor. Advances in vertebrate
neuroethology. New York: Springer; 1983. p. 701–30.
7. Riebel K. Song and female mate choice in zebra finches: a review. Adv Stud
Behav. 2009;40:197–238.
8. Bee MA, Signaler MCT, Psychology R. In: Bee MA, Miller CT, editors.
Psychological mechanisms in animal communication. Gewerbestrasse:
Springer; 2016. p. 1–16.
9. Aubin T, Jouventin P. How to vocally identify kin in a crowd: the penguin
model. Adv Stud Behav. 2002;31:243–78.
10. Brumm H, Slabbekoorn H. Acoustic communication in noise. Adv Stud
Behav. 2005;35:151–209.
11. Nelson DA, Marler P. The perception of birdsong and an ecological concept
of signal space. In: Stebbins WC, Berkley MA, editors. Wiley series in
neuroscience. Oxford, England: Wiley; 1990. p. 443–78.
12. Williams H, Cynx J, Nottebohm F. Timbre control in zebra finch (Taeniopygia
guttata) song syllables. J Comp Psychol. 1989;103:366–80.
13. Fang K, Zhang BW, Brauth SE, Tang YZ, Fang GZ. The first call note of the
Anhui tree frog (Rhacophorus zhoukaiya) is acoustically suited for enabling
individual recognition. Bioacoustics. 2019;28:155–76.
14. Marquez R, Delariva I, Bosch J. Advertisement calls of Bolivian
Leptodactylidae (Amphibia, Anura). J Zool. 1995;237:313–36.
15. Shen JX, Feng AS, Xu ZM, Yu ZL, Arch VS, Yu XJ, Narins PM. Ultrasonic frogs
show hyperacute phonotaxis to female courtship calls. Nature. 2008;453:914–6.
16. Henry KS, Gall MD, Vélez A, Lucas JR. Avian auditory processing at four
different scales: variation among species, seasons, sexes, and individuals. In: Bee MA, Miller CT, editors. Psychological mechanisms in animal
communication.Gewerbestrasse: Springer; 2016. p. 17–55.
17. Beckers GJ, Ten Cate C. Perceptual relevance of species-specific differences in
acoustic signal structure inStreptopeliadoves. Anim Behav. 2001;62:511–8.
18. Joris P, Schreiner C, Rees A. Neural processing of amplitude-modulated
sounds. Physiol Rev. 2004;84:541–77.
19. Johnson DH. The relationship between spike rate and synchrony in responses
of auditory-nerve fibers to single tones. J Acoust Soc Am. 1980;68:1115–22.
20. Henry KS, Gall MD, Bidelman GM, Lucas JR. Songbirds tradeoff auditory frequency
resolution and temporal resolution. J Comp Physiol A. 2011;197:351–9.
21. Bizley JK, Cohen YE. The what, where and how of auditory-object
perception. Nat Rev Neurosci. 2013;14:693–707.
22. Griffiths TD, Warren JD. What is an auditory object? Nat Rev Neurosci. 2004;
5:887–92.
23. Bee MA. Sound source perception in anuran amphibians. Curr Opin
Neurobiol. 2012;22:301–10.
24. Arch VS, Narins PM. Sexual hearing: the influence of sex hormones on
acoustic communication in frogs. Hear Res. 2009;252:15–20.
25. Kelley DB. Vocal communication in frogs. Curr Opin Neurobiol. 2004;14:751–7.
26. Tobias ML, Corke A, Korsh J, Yin D, Kelley DB. Vocal competition in male
Xenopus laevisfrogs. Behav Ecol Sociobiol. 2010;64:1791–803.
27. Gerhardt HC. Acoustic communication in two groups of closely related
treefrogs. Adv Stud Behav. 2001;30:99–167.
28. Drewry GE, Rand AS. Characteristics of an acoustic aommunity: Puerto Rican
frogs of the genusEleutherodactylus. Copeia. 1983;1983:941–53.
29. Bee MA, Gerhardt HC. Neighbour-stranger discrimination by territorial male
bullfrogs (Rana catesbeiana): I. acoustic basis. Anim Behav. 2001;62:1129–40.
30. Gerhardt HC. Mating call recognition in the barking treefrog (Hyla gratiosa):
responses to synthetic calls and comparisons with the green treefrog (Hyla
cinerea). J Comp Physiol A. 1981;144:17–25.
31. Murphy CG, Gerhardt HC. Mating preference functions of individual female
barking treefrogs,Hyla gratiosa, for two properties of male advertisement
calls. Evolution. 2000;54:660–9.
32. Allan SE, Simmons AM. Temporal features mediating call recognition in the green
treefrog,Hyla cinerea: amplitude modulation. Anim Behav. 1994;47:1073–86.
33. Ghazanfar AA, Smith-Rohrberg D, Hauser MD. The role of temporal cues in
rhesus monkey vocal recognition: orienting asymmetries to reversed calls.
Brain Behav Evol. 2001;58:163–72.
34. Gerhardt HC. Mating call recognition in the green treefrog (Hyla cinerea):
the significance of some fine-temporal properties. J Exp Biol. 1978;74:59–73.
35. Vignal C, Kelley DB. Significance of temporal and spectral acoustic cues for
sexual recognition inXenopus laevis. Proc R Soc B Biol Sci. 2007;274:479.
36. Mudry KM, Constantine-Paton M, Capranica RR. Auditory sensitivity of the
diencephalon of the leopard frogRana p. pipiens. J Comp Physiol A. 1977;
114:1–13.
37. Mangiamele LA, Burmeister SS. Acoustically evoked immediate early gene
expression in the pallium of female túngara frogs. Brain Behav Evol. 2008;72:239–50.
38. Chen Q, Cui JG, Fang GZ, Brauth SE, Tang YZ. Acoustic analysis of the advertisement
calls of the music frog,Babina daunchina. J Herpetol. 2011;45:406–16.
39. Cui JG, Wang YS, Brauth SE, Tang YZ. A novel female call incites
male-female interaction and male-male competition in the Emei music frog,
Babina daunchina. Anim Behav. 2010;80:181–7.
40. Cui JG, Tang YZ, Narins PM. Real estate ads in Emei music frog vocalizations:
female preference for calls emanating from burrows. Biol Lett. 2012;8:337–40.
41. Fang GZ, Jiang F, Yang P, Cui JG, Brauth SE, Tang YZ. Male vocal
competition is dynamic and strongly affected by social contexts in music
frogs. Anim Cogn. 2014;17:483–94.
42. Greenfield MD, Rand AS. Frogs have rules: selective attention algorithms
regulate chorusing inPhysalaemus pustulosus(Leptodactylidae). Ethology.
2000;106:331–47.
43. Krauzlis RJ, Bogadhi AR, Herman JP, Bollimunta A. Selective attention
without a neocortex. Cortex. 2018;102:161–75.
44. Wells KD, Schwartz JJ. The behavioral ecology of anuran communication. In:
Narins PM, Feng AS, Fay RR, Popper AN, editors. Hearing and sound
communication in amphibians. New York: Springer; 2007. p. 44–86.
45. Fang GZ, Yang P, Xue F, Cui JG, Brauth SE, Tang YZ. Sound classification and
call discrimination are decoded in order as revealed by event-related
potential components in frogs. Brain Behav Evol. 2015;86:232–45.
46. Yue XZ, Fan YZ, Xue F, Brauth SE, Tang YZ, Fang GZ. The first call note plays
a crucial role in frog vocal communication. Sci Rep UK. 2017;7:10128.
47. Xue F, Yue XZ, Fan YZ, Cui JG, Brauth SE, Tang YZ, Fang GZ. Auditory neural
networks involved in attention modulation prefer biologically significant sounds and exhibit sexual dimorphism in anurans. J Exp Biol. 2018;221(5).
https://doi.org/10.1242/jeb.167775.
48. Yang P, Xue F, Cui JG, Brauth SE, Tang YZ, Fang GZ. Auditory sensitivity
exhibits sexual dimorphism and seasonal plasticity in music frogs. J Comp
Physiol A. 2018;204:1029–44.
49. Fang GZ, Xue F, Yang P, Cui JG, Brauth SE, Tang YZ. Right ear advantage for
vocal communication in frogs results from both structural asymmetry and
attention modulation. Behav Brain Res. 2014;266:77–84.
50. Xue F, Fang GZ, Yang P, Zhao EM, Brauth SE, Tang YZ. The biological
significance of acoustic stimuli determines ear preference in the music frog.
J Exp Biol. 2015;218:740–7.
51. Kandel ER, Schwartz JH, Jessell TM, Siegelbaum SA, Hudspeth AJ. Principles
of neural science. 5th ed. New York: McGraw-Hill; 2013.
52. Luck SJ. An introduction to the event-related potential technique.
Cambridge: MIT Press; 2005.
53. Näätänen R, Picton T. The N1 wave of the human electric and magnetic
response to sound: a review and an analysis of the component structure.
Psychophysiology. 1987;24:375–425.
54. Shahin A, Roberts LE, Pantev C, Trainor LJ, Ross B. Modulation of P2
auditory-evoked responses by the spectral complexity of musical sounds.
Neuroreport. 2005;16:1781–5.
55. Tremblay K, Kraus N, McGee T, Ponton C, Otis B. Central auditory plasticity: changes
in the N1-P2 complex after speech-sound training. Ear Hear. 2001;22:79–90.
56. Tremblay KL, Kraus N. Auditory training induces asymmetrical changes in
cortical neural activity. J Speech Lang Hear Res. 2002;45:564–72.
57. Luck SJ, Kappenman ES. The Oxford handbook of event-related potential
components. New York: Oxford university press; 2011.
58. Hall JW III. eHandbook of auditory evoked responses: principles, procedures
& protocols. Pretoria: Pearson; 2015.
59. Friedman D, Cycowicz YM, Gaeta H. The novelty P3: an event-related brain
potential (ERP) sign of the brain's evaluation of novelty. Neurosci Biobehav
Rev. 2001;25:355–73.
60. Wronka E, Kaiser J, Coenen AML. Neural generators of the auditory evoked
potential components P3a and P3b. Acta Neurobiol Exp (Warsz). 2012;72:51–64.
61. Cycowicz YM, Friedman D. Effect of sound familiarity on the event-related
potentials elicited by novel environmental sounds. Brain Cogn. 1998;36:30–51.
62. Arthur DL, Starr A. Task-relevant late positive component of the auditory event
related potential in monkeys resembles P300 in humans. Science. 1984;223:186–8.
63. Ehlers CL, Kaneko WM, Robledo P, Lopez AL. Long-latency event-related
potentials in rats: effects of task and stimulus parameters. Neuroscience.
64. Woods DL, Ridgway SH, Bullock TH. Middle-and long-latency auditory event-related potentials in dolphins. In. Schusterman JR, Thomas JA, wood FG, editors. Dolphin cognition and behavior: a comparative perspective.
London: Lawrence Erlbaum Associates; 1986. p. 61–77.
65. Fan YZ, Yue XZ, Xue F, Cui JG, Brauth SE, Tang YZ, Fang GZ. Auditory
perception exhibits sexual dimorphism and left telencephalic dominance in
Xenopus laevis. Biol Open. 2018;7(12). https://doi.org/10.1242/bio.035956.
66. Finlay BL, Darlington RB, Nicastro N. Developmental structure in brain
evolution. Behav Brain Sci. 2001;24:298–308.
67. Northcutt RG. Understanding vertebrate brain evolution. Integr Comp Biol.
2002;42:743–56.
68. Fang GZ, Chen Q, Cui JG, Tang YZ. Electroencephalogram bands modulated
by vigilance states in an anuran species: a factor analytic approach. J Comp
Physiol A. 2012;198:119–27.
69. Fang GZ, Yang P, Cui JG, Yao DZ, Brauth SE, Tang YZ. Mating signals
indicating sexual receptiveness induce unique spatio-temporal EEG theta patterns in an anuran species. PLoS One. 2012;7:e52364.
70. Lalonde-Robert V, Desgent S, Duss S, Vachon P. Electroencephalographic
and physiologic changes after tricaine methanesulfonate immersion of
African clawed frogs (Xenopus laevis). J Am Assoc Lab Anim. 2012;51:622–7.
71. Fan YZ, Yue XZ, Xue F, Brauth SE, Tang YZ, Fang GZ. The right thalamus
may play an important role in anesthesia-awakening regulation in frogs. PeerJ. 2018;6:e4516.
72. Wilczynski W. Brainstem auditory pathways in anuran amphibians. In: Fritzsch B,
Ryan MJ, Wilczynski W, Hetherington T, Walkowiak W, editors. The evolution of
the amphibian auditory system. New York: Wiley; 1988. p. 209–31.
73. Gonsalvez CJ, Polich J. P300 amplitude is determined by target-to-target
interval. Psychophysiology. 2002;39:388–96.
74. Oconnor TA, Starr A. Intracranial potentials correlated with an event-related
potential, P300, in the cat. Brain Res. 1985;339:27–38.
75. Deveney CM, Pizzagalli D. The cognitive consequences of emotion
regulation: an ERP investigation. Psychophysiology. 2008;45:435–44.
76. Biermann S, Heil P. Parallels between timing of onset responses of single
neurons in cat and of evoked magnetic fields in human auditory cortex. J
Neurophysiol. 2000;84:2426–39.
77. Ostroff JM, McDonald KL, Schneider BA, Alain C. Aging and the processing
of sound duration in human auditory cortex. Hear Res. 2003;181:1–7.
78. Yago E, Escera C, Alho K, Giard M-H, Serra-Grabulosa JM. Spatiotemporal
dynamics of the auditory novelty-P3 event-related brain potential. Cogn
Brain Res. 2003;16:383–90.
79. McDonald JJ, Teder-Sälejärvi WA, Di Russo F, Hillyard SA. Neural basis of
auditory-induced shifts in visual time-order perception. Nat Neurosci. 2005;8:1197.
80. Shu H. Factorial experimental design in psychology and education (in
Chinese). Beijing: Beijing Normal University Press; 2008.
81. Cohen J. A power primer. Psychol Bull. 1992;112:155–9.
82. Woldorff MG, Gallen CC, Hampson SA, Hillyard SA, Pantev C, Sobel D, Bloom
FE. Modulation of early sensory processing in human auditory cortex during
auditory selective attention. Proc Natl Acad Sci U S A. 1993;90:8722–6.
83. Haff T, Magrath RD. Vulnerable but not helpless: nestlings are fine-tuned to
cues of approaching danger. Anim Behav. 2010;79:487–96.
84. Darrow PA, Shivik JA. Bold, shy, and persistent: variable coyote response to
light and sound stimuli. Appl Anim Behav Sci. 2009;116:82–7.
85. Hemmi JM, Merkle T. High stimulus specificity characterizes anti-predator
habituation under natural conditions. Proc Biol Sci. 2009;276:4381–8.
86. Anderson AK, Phelps EA. Lesions of the human amygdala impair enhanced
perception of emotionally salient events. Nature. 2001;411:305–9.
87. Most SB, Wang L. Dissociating spatial attention and awareness in
emotion-induced blindness. Psychol Sci. 2011;22:300–5.
88. Hillyard SA, Hink RF, Schwent VL, Picton TW. Electrical signs of selective
attention in the human brain. Science. 1973;182:177–80.
89. Hyde M. The N1 response and its applications. Audiol Neurootol. 1997;2:281–307.
90. Bosnyak DJ, Eaton RA, Roberts LE. Distributed auditory cortical
representations are modified when non-musicians are trained at pitch discrimination with 40 Hz amplitude modulated tones. Cereb Cortex. 2004;
14:1088–99.
91. Tremblay KL, Inoue K, McClannahan K, Ross B. Repeated stimulus exposure
alters the way sound is encoded in the human brain. PLoS One. 2010;5: e10283.
92. Potts GF, Dien J, Hartry-Speiser AL, McDougal LM, Tucker DM. Dense sensor
array topography of the event-related potential to task-relevant auditory
stimuli. Electroencephalogr Clin Neurophysiol. 1998;106:444–56.
93. Reinke KS, He Y, Wang C, Alain C. Perceptual learning modulates sensory
evoked response during vowel segregation. Cogn Brain Res. 2003;17:781–91.
94. Freunberger R, Klimesch W, Doppelmayr M, Höller Y. Visual P2 component
is related to theta phase-locking. Neurosci Lett. 2007;426:181–6.
95. Shahin AJ, Roberts LE, Miller LM, McDonald KL, Alain C. Sensitivity of EEG
and MEG to the N1 and P2 auditory evoked responses modulated by
spectral complexity of sounds. Brain Topogr. 2007;20:55–61.
96. Gerhardt HC, Bee MA. Recognition and localization of acoustic signals. In:
Narins PM, Feng AS, Fay RR, Popper AN, editors. Hearing and sound
communication in amphibians. New York: Springer; 2007. p. 113–46.
97. Gerhardt HC, Huber F. Acoustic communication in insects and anurans:
common problems and diverse solutions. Chicago: University of Chicago Press; 2002.
98. Jiang F, Fang GZ, Xue F, Cui JG, Brauth SE, Tang YZ. Male music frogs
compete vocally on the basis of temporal sequence rather than spatial cues
of rival calls. Asian Herpetol Res. 2015;6:305–16.
99. Yang P, Fang GZ, Xue F, Cui JG, Brauth SE, Tang YZ.
Electroencephalographic signals synchronize with behaviors and are sexually dimorphic during the light-dark cycle in reproductive frogs. J Comp
Physiol A. 2014;200:117–27.
100. Liu YS, Fan YZ, Xue F, Yue XZ, Brauth SE, Tang YZ, Fang GZ. Changes in electroencephalogram approximate entropy reflect auditory processing and
functional complexity in frogs. Asian Herpetol Res. 2016;7:180–90.
101. Bernal XE, Rand AS, Ryan MJ. Sex differences in response to nonconspecific advertisement calls: receiver permissiveness in male and female túngara
frogs. Anim Behav. 2007;73:955–64.
102. Bernal XE, Stanley Rand A, Ryan MJ. Sexual differences in the behavioral
response of túngara frogs,Physalaemus pustulosus, to cues associated with
increased predation risk. Ethology. 2007;113:755–63.
103. Hoke KL, Ryan MJ, Wilczynski W. Candidate neural locus for sex differences
in reproductive decisions. Biol Lett. 2008;4:518–21.
104. Gobes SM, ter Haar SM, Vignal C, Vergne AL, Mathevon N, Bolhuis JJ. Differential responsiveness in brain and behavior to sexually dimorphic long
calls in male and female zebra finches. J Comp Neurol. 2009;516:312–20.
105. Xue F, Fang GZ, Yue XZ, Zhao EM, Brauth SE, Tang YZ. A lateralized functional auditory network is involved in anuran sexual selection. J Biosci.
2016;41:713–26.
106. McClelland BE, Wilczynski W, Rand AS. Sexual dimorphism and species differences in the neurophysiology and morphology of the acoustic communication system of two neotropical hylids. J Comp Physiol A. 1997;
180:451–62.
107. Hoke KL, Ryan MJ, Wilczynski W. Sexually dimorphic sensory gating drives
behavioral differences in túngara frogs. J Exp Biol. 2010;213:3463–72.
108. van Dinteren R, Arns M, Jongsma ML, Kessels RP. P300 development across the lifespan: a systematic review and meta-analysis. PLoS One. 2014;9: e87347.
109. Liu WR, Shen JX, Zhang YJ, Xu ZM, Qi Z, Xue MQ. Auditory sexual difference
in the large odorous frogOdorrana graminea. J Comp Physiol A. 2014;200:
311–6.
110. Searcy WA, Brenowitz EA. Sexual differences in species recognition of avian song. Nature. 1988;332:152.
111. Wiley RH. Signal detection and animal communication. Adv Stud Behav.
2006;36:217–47.
112. Wilczynski W, Endepols H. Central auditory pathways in anuran amphibians: the anatomical basis of hearing and sound communication. In: Narins PM, Feng AS, Fay RR, Popper AN, editors. Hearing and sound communication in
amphibians. New York: Springer; 2007. p. 221–49.
113. Wilczynski W, Capranica RR. The auditory system of anuran amphibians.
Prog Neurobiol. 1984;22:1–38.
114. Endepols H, Feng AS, Gerhardt HC, Schul J, Walkowiak W. Roles of the auditory midbrain and thalamus in selective phonotaxis in female gray