R E S E A R C H
Open Access
Modeling compositional dynamics based on GC
and purine contents of protein-coding sequences
Zhang Zhang, Jun Yu
*Abstract
Background:Understanding the compositional dynamics of genomes and their coding sequences is of great significance in gaining clues into molecular evolution and a large number of publically-available genome sequences have allowed us to quantitatively predict deviations of empirical data from their theoretical
counterparts. However, the quantification of theoretical compositional variations for a wide diversity of genomes remains a major challenge.
Results:To model the compositional dynamics of protein-coding sequences, we propose two simple models that take into account both mutation and selection effects, which act differently at the three codon positions, and use both GC and purine contents as compositional parameters. The two models concern the theoretical composition of nucleotides, codons, and amino acids, with no prerequisite of homologous sequences or their alignments. We evaluated the two models by quantifying theoretical compositions of a large collection of protein-coding sequences (including 46 of Archaea, 686 of Bacteria, and 826 of Eukarya), yielding consistent theoretical compositions across all the collected sequences.
Conclusions:We show that the compositions of nucleotides, codons, and amino acids are largely determined by both GC and purine contents and suggest that deviations of the observed from the expected compositions may reflect compositional signatures that arise from a complex interplay between mutation and selection via DNA replication and repair mechanisms.
Reviewers:This article was reviewed by Zhaolei Zhang (nominated by Mark Gerstein), Guruprasad Ananda (nominated by Kateryna Makova), and Daniel Haft.
Background
Compositional biases in the contexts of nucleotides, codons, and amino acids are found among bacteria [1-4], fungi [5,6], insects [7-10], plants [11,12], and ver-tebrates [13,14], which presumably arise from unba-lanced forces of mutation and selection and are maintained by the species in their populations [15-17]. For any individual gene, its compositional biases reflect the action of both mutation and selection, which is also linked to the abundance of iso-accepting transfer RNAs and the catalytic efficiencies of their synthetases, thereby translation efficiencies [2,6,18-22]. Therefore, composition analysis is of great significance in better
understanding compositional dynamics in order to pro-vide epro-vidence for molecular evolution [23,24].
Nucleotide compositions are highly variable among genomes, and the guanine-plus-cytosine (G + C or sim-ply GC) content differs dramatically from one species to another [25-27], particularly among bacterial genomes,
which varies from 17% (Candidatus Carsonella ruddii
PV) to 75% (Anaeromyxobacter dehalogenans 2CP-C)
[28,29]. The dynamics of nucleotide compositions is also coupled closely to codon and amino acid compositions. The most likely factor that determines codon/amino acid usage is mutational bias that shapes GC composi-tion constantly when genomes are either replicated or repaired by DNA polymerases [30]. In addition, empiri-cal relationships between GC content and codon/amino acid usage have been documented in many species [25,31-38], providing ample data for theoretical model-ing and simulation studies. Despite an attempt to model * Correspondence: [email protected]
Plant Stress Genomics Research Center, Division of Chemical and Life Sciences and Engineering, King Abdullah University of Science and Technology, Thuwal 23955-6900, Kingdom of Saudi Arabia
compositional dynamics from GC content alone [31], there has been little interpretations for the effect of mutation and selection at different codon positions as well as the contribution of purine content. Based on the
Chargaff’s rules [39,40] that the amount of adenine
equals to thymine and the amount of guanine equals to cytosine (viz., A = T and G = C), purine content is expected to be centered narrowly around 50% since A + T + G + C = 2 (A + G) = 100%, in contrast to a broad variation of GC content. Although purine content is thought to be nearly constant, deviating in minimal ways toward both low and high around 50%, its subtle yet fundamental variation can lead to a considerable departure from the base-pairing rule of A = T and G = C and consequently provoke differential codon and amino acid usages.
Here we present two models that calculate theoretical compositions of nucleotides, codons, and amino acids in quantitative ways. Our models assume that mutation and selection act at the level of nucleotide (rather than codon or amino acid) [41], take into account of diverse forces from both mutation and selection at three codon posi-tions, and employ GC and purine contents as two essen-tial parameters to model compositional dynamics and quantify theoretical compositions without the requisite of orthologous sequences or their alignments. We examine the effectiveness of our models on a large collection of protein-coding sequences across the three domains of life (including 46 of Archaea, 686 of Bacteria, and 826 of Eukarya) and provide an in-depth discussion on the theo-retical composition dynamics through comparisons of the observed compositions to the empirical data.
Results
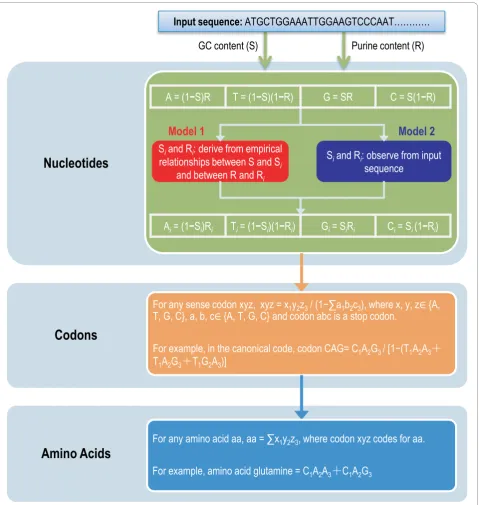
We obtained a large collection of codon usage data across the three domains of life (46 archaea, 686 bac-teria, and 826 eukaryotes). Both models (Model 1 and Model 2; see Figure 1) use GC (S) and purine (R) con-tents to predict expected compositions theoretically. Dif-ferent from Model 2, Model 1 requires prior knowledge of empirical relationships between S and Siand between
R and Ri, wherei represents codon position (i = 1, 2, 3)
(see Models). We inferred these empirical relationships (Additional file 1) from all the collected sequences in individual domains of life for Model 1.
Nucleotide composition
We plotted the expected and observed frequencies of the four nucleotides and their individual frequencies at the three codon positions against GC content for all data in our collection (Additional file 2). An example for guanine is shown in Figure 2. Both models performed well across a wide range of GC contents and yielded very close pre-dictions for the nucleotide G (Figure 2A to 2C) and for
the three codon positions (Figure 2D to 2L). The expected compositions with changing GC contents exhi-bit similar trends as compared to the observed ones, despite the fact that deviations at the second codon posi-tion appeared more pronounced in comparison with the first and third codon positions (Figure 2G to 2I; discussed below). Furthermore, the expected compositions pre-dicted by Model 1 correlated with GC content linearly, whereas those predicted by Model 2 appeared scattered around those by Model 1, indicating greater deviations. Taken together, the two models produced close predic-tions for the expected nucleotide composipredic-tions, exhibit-ing comparable trends with the observed (Figure 2 and Additional file 2).
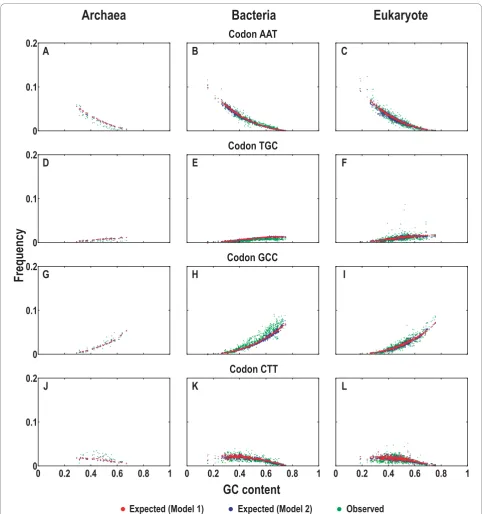
Codon composition
We further used the models to predict the codon com-positions (see Models). The expected and observed codon frequencies were plotted against GC content over all collected sequences (Additional file 3). We took four randomly selected codons (AAT, TGC, GCC, and CTT) as examples (Figure 3). When GC content varies from low to high, both models show consistent predictions for expected codon compositions that are very similar to the distributions of the observed (Figure 3A to 3L). Spe-cifically, the expected compositions of codons AAT and CTT yield negative correlations with the increasing GC content, agreeing well with the observed (Figure 3A to 3C and 3J to 3L). In contrast, the expected compositions of TGC and GCC codons correlate positively with the increasing GC content, again consistent with the observed (Figure 3D to 3F and 3G to 3I). Moreover, in comparison with Model 2, the predicted trends by Model 1 are smoother when the GC content varies (Fig-ure 3). Although there are deviations between the expected and observed in general, the two models pre-dict rather consistent codon compositions (Figure 3 and Additional file 3).
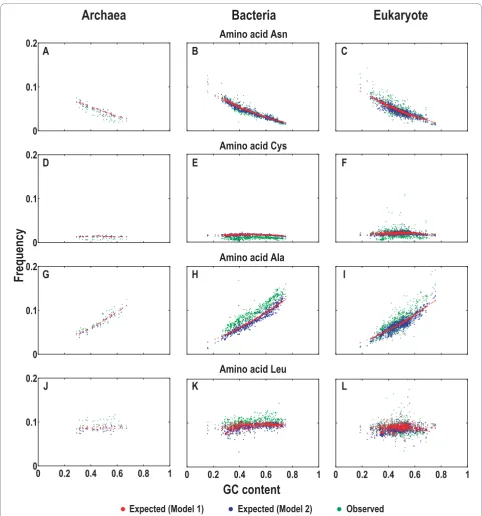
Amino acid composition
with the observed (Figure 4A to 4C). In contrast, the expected compositions of Cys (encoded by TGT and TGC) appeared constant (extremely low) with changing GC content, displaying similar trends with the observed (Figure 4D to 4F), albeit slightly larger than the observed. As Ala is encoded by codons GCN (where N = A, T, G, C), the expected compositions of Ala
than those of Asn, Cys or Ala. Even so, both models are still capable of predicting consistent compositions for Leu. Although the expected compositions of Leu are smaller than the observed in archaea and bacteria, they appear closer to the observed in eukaryote (Figure 4J to 4L). Additionally, comparing the expected amino acid
compositions between the two models, we found that Model 1 again exhibits smoother trends (except Leu) tailored to the increasing GC content. Collectively, the two models also offered a consistent quantification for amino acid compositions across the three domains of life (Figure 4 and Additional file 4).
Discussion
Significances of incorporating GC and purine contents into models
Empirical relationships between GC content and codon (amino acid) usage have been widely reported but explained in most of the cases less comprehensively.
integral membrane proteins with hydrophobic nature, horizontal transfer of DNA and questionable predicted coding regions, etc.). Our results strongly suggest that mutation and selection not only act at different levels but also exhibit different priorities that are attributable to the organization of the genetic code [44,45]. At the
second codon positions [44-47]. However, it does not mean that GC content, varying from 17% to 75%, is the sole determinant of compositions at all levels [31,48]; purines have been widely reported to have a determina-tive role in amino acid physicochemical properties and purines in the second codon position may control the charge and hydrophobicity of amino acids [44,46,49,50]. Similar to GC content, purine content also differs from one species to another, albeit with a relatively smaller range in a nearly 10% deviation below or above the half line. In bacteria, for instance, the minimum of purine
content is 48.0% for Clavibacter michiganensis subsp.
michiganensis NCPPB 382, whereas the maximum is 58.8% forClostridium tetani E88. The slight deviation of purine content, indicating a complex interplay of muta-tion and selecmuta-tion and reflecting an important balance between the purine-sensitive and insensitive amino acids–15 and 5 (as signified by their codons’sensitivity to purine variations at the third codon position), respec-tively [51]–can give rise to completely different compo-sitions at the levels of both codons and amino acids (as indicated in Equations 1-8).
Therefore, our models first adopt GC and purine tents as two important compositional elements and con-sider heterogeneous mutation and selection forces acting at all three codon positions. As testified across a wide variety of species, the models provided consistent compositions, quantitatively recapturing the empirical relationships with changing GC and purine contents. Our results, especially in the various changing trends (most of them are not linear) further validated that mutations (dominated by GC content variations) and selections (dominated by purine content variations) mainly act at the level of nucleotides rather than codons or amino acids in accordance with previous studies [12,41,52]. Although our models are designed to work on protein coding sequences, it might also be applicable to nucleotide frequencies in non-coding sequences as an alternative. Second, the deviations from the domin-ant trends for certain amino acids, to a lesser extent some of their codons (such as it is well-accepted that purine-rich sequences often serve as elements of exonic enhancers among animal genes that have multiple spli-ceosomal introns), reflect selection forces acting primar-ily on certain amino acids of the proteomes when their amino acid sequence changes interfere with protein level functions. Third, there are other balancing forces buried in the organization of the genetic code. One of the sets includes the six-fold codons for Leu, Arg (argi-nine), and Ser (serine). All of them provide diverse bal-ances for purine content variations as they are all divided between the purine-sensitive and insensitive codons [44,46]. Although four of the codons for Arg are in the GC-rich quarter of the genetic code, its
counterpart, Lys (lysine) has all its codons in the AT-rich quarter in order to maintain enough basic amino acids in the proteomes [44].
Our models have several variants. Since they are built on the basis of GC and purine contents and thus sym-bolized as {GC, AG} or {S, R}, their variants can also be represented by S and R: {AT, AG} = {Sc, R}, {GC, TC} = {S, Rc}, {AT, TC} = {Sc, Rc}. As assumed, S and R is an independent pair, which leads to Scand R, S and Rc, Sc and Rc are also independent pairs (see Models). There-fore, the variants, {Sc, R}, {S, Rc}, {Sc, Rc}, are in essence equivalent to our models.
Implications of composition deviations
The expected compositions predicted by our models, however, sometimes deviate in various degrees from the observed. Such deviations can be caused by complex evolutionary mechanisms (e.g., extreme dinucleotide abundance [53]) and deciphered in terms of mutation and selection [54,55]; mutation towards a particular nucleotide content (e.g., GC content) primarily deter-mines codon and amino acid usage according to the genetic code structure [56] and selection essentially caters for a given amino acid usage [57]. Therefore, it is likely that these composition deviations provide implica-tions for molecular evolution.
Considering nucleotide compositions at all three codons positions (Figure 2 and Additional file 2), four nucleotides at the first and third codon positions deviated evenly, suggesting stronger mutation effects. On the contrary, four nucleotides at the second codon position deviated remarkably, exhibiting a similar man-ner in all species. As compared to the expected compo-sitions, A and C appear overestimated, whereas G and T are underestimated (Figure 2 and Additional file 2). This indicates the strong selection acting at the second posi-tion that is intrinsic to the organizaposi-tion of the genetic code; amino acids that have A or C at their second codon positions are more diverged and less flexible toward nucleotide changes across codon positions than within codon positions. Conversely, the amino acids that have G or T at their second codon positions are rela-tively relaxed toward nucleotide changes across codon positions. Most noticeable are Leu and Arg, whose codons are partitioned within the same position but between the purine-sensitive and insensitive halves (Additional file 5) [44]. Our results are in agreement with previous observations [41,44,58].
sequences. Namely, in comparison to expectations, there are a surplus of alanine and a deficit of valine. Since amino acids are exchanged at different frequencies due to their compositional relevance at nucleotide level, it is possible that deviations of these two amino acids are highly related to such exchangeability. Therefore, we constructed five amino acid exchange matrices that are based on five different datasets inEscherichia coli, fruit fly, rice, yeast, and mammal (see Methods). When we take the top 10 highly-exchangeable pairs in all five matrices, the four among the top are (1) Ala↔Ser, (2) Ala↔Thr (threonine), (3) Ala↔Val, and (4) Val↔Ile (isoleucine) (Additional file 6). As we know, amino acids with similar physicochemical properties tend to be more exchangeable [59-62]. It appears that Ala is the most active amino acid, primarily due to the fact that several of its neighboring amino acids have similar physico-chemical properties (such as their size parameters). With regard to the exchange between Val and Ile, it is their similarity in hydrophobicity that plays a key role. These results are by and large consistent with findings in several previous studies [12,63,64]. Therefore, our models bear significance in establishing a theoretical fra-mework for compositional analysis and providing clues for molecular evolution studies.
Conclusions
Here we have presented two models that theoretically quantify expected compositions of nucleotides, codons, and amino acids, based merely on GC and purine con-tents (which are easily computed from input sequences). We evaluated the two models on a large collection of protein-coding sequences across the three domains of life. Our results show that the two models are capable of yielding consistent expected compositions. In addi-tion, our results indicate that deviations of the observed from the expected compositions are signatures resulted from complex interplays between mutation and selec-tion. Therefore, our models represent a promising theo-retical framework for compositional studies.
Methods Models
We devise two models (denoted as Model 1 and Model 2) that theoretically quantify expected compositions of nucleotides, codons, and amino acids, beginning with only GC and purine contents, which are easily derived from input sequences. To provide a better description, we detailed the computational procedures in Figure 1, and since we only use the coding sequence for all the analyses, any nucleotide content (GC or purine content) used is referred to coding sequences.
To describe the two models, let us briefly recapitulate several pertinent elements in probability theory. Suppose
that the universal set is U, and X or Y are two subsets of U, there are three common operations: (1) union of X and Y, denoted X∪ Y, is the set of all elements that are a member of X, or Y, or both, viz., X∪Y = {z|z ÎX orzÎ Y}; (2) intersection of X and Y, denoted X∩Y, is the set of all elements that are members of both X and Y, viz., X∩Y = {z|zÎX andzÎY}; (3) complement of set X relative to set U, denoted Xc, is the set of all members of U that are not members of X, viz., Xc= {z|z ∉ X}. For simplicity, the four nucleotide (adenine, thy-mine, guanine, and cytosine) contents are denoted as A, T, G, and C, respectively. Since our models are built at the nucleotide level, the universal set U is defined as U = {A, T, G, C}. GC and purine contents are denoted as
S and R, respectively, where S = G ∪C and R = A∪ G.
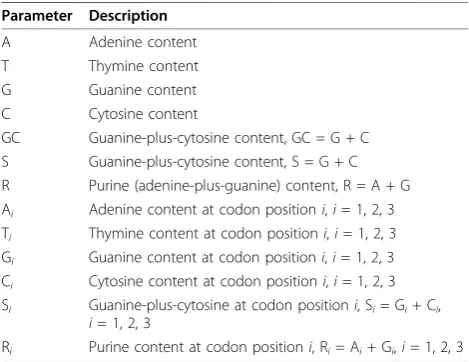
Notations used to describe in our models are summar-ized in Table 1.
In this study, S and R are assumed statistically inde-pendent. Statistical independence of two variables prob-abilistically means that the occurrence (value) of one variable does not change the probability for that (value) of the other. According to the Chargaff’s rules again, S varies broadly whereas R always centers at 50%, imply-ing the independence between S and R. As S and R are statistically independent (that is, S and R form an inde-pendent pair), S ∩R can be quantitatively expressed by SR, namely, S ∩R = SR, which is also applicable to the three pairs: Scand R, S and Rc, and Scand Rc[65]. As a result, each nucleotide is formulated as a function of S and R (Equations 1-4). As S and R are to be calculated from input sequences, compositions of four nucleotides are readily inferred according to Equations 1-4. Obviously, a special case when R = 0.5, can lead to A = T = (1-S)/2, G = C = S/2, which is consistent with the Chargaff’s rule [39,40].
Table 1 Notation
Parameter Description
A Adenine content
T Thymine content
G Guanine content
C Cytosine content
GC Guanine-plus-cytosine content, GC = G + C S Guanine-plus-cytosine content, S = G + C R Purine (adenine-plus-guanine) content, R = A + G Ai Adenine content at codon positioni,i= 1, 2, 3
Ti Thymine content at codon positioni,i= 1, 2, 3
Gi Guanine content at codon positioni,i= 1, 2, 3
Ci Cytosine content at codon positioni,i= 1, 2, 3
Si Guanine-plus-cytosine at codon positioni, Si= Gi+ Ci,
i= 1, 2, 3
A=(AT)(AG)=(GC)c(AG)=ScR=(1−S)R(1)
T=(AT)(TC)=(GC)c(AG)c=ScRc=(1−S)(1−R)(2)
G=(GC)(AG)=SR =SR (3)
C=(GC)(TC)=(GC)(AG)c =SRc=S(1−R)(4)
Mutation and selection forces are assumed to act at nucleotide level, which also alter codon and amino acid usages [31,41]. Considering differential effects of muta-tion and selecmuta-tion at the three different codon posimuta-tions [66], both models necessitate S and R at three codon positions, that is, Si and Ri, wherei is the codon
posi-tion,i= 1, 2, 3. The two models proposed in this study differ only in how to compute Siand Ri. As S and R are
calculated from each individual sequence, Model 1 deduces Siand Rifrom empirical relationships between
S and Si and between R and Ri, where Si and Ri are
based on the linear relationships derived from multiple species [31,32,35,37,67,68]. Contrastingly, Model 2 sim-ply counts Siand Rifrom the input sequence, in a
man-ner similar to S and R. After Si and Ri being obtained,
nucleotide contents at the three codon positions are inferred in the same way,
Ai=(1−S )Ri i, (5)
Ti=(1−S )i(1−R )i, (6)
Gi=S Ri i, (7)
Ci=Si(1−R )i , (8)
where Ai, Ti, Gi, and Ci represent their corresponding
contents at the three codon positions (i= 1, 2, 3). Therefore, for any sense codon xyz,x,y,z Î {A, T, G, C}, its expected composition is given by the product of its constituent nucleotide frequencies x1y2z3, normalized by the sum over all non-stop codons,
x y z (11 2 3 a b c )1 2 3 abc is a stop codon
−
∑
, where x1, y2 and z3are calculated from Equations 5-8. Amino acid compo-sition relates closely to codon compocompo-sition; for a given amino acid, its expected composition is the sum over all its codons.
Model 1, as it incorporates empirical relationships, is a combination of empirical and mechanistic, whereas Model 2 is purely mechanistic without any prior knowledge (Figure 1; see [69] for a review on models). As expected, therefore, Model 1 yields smoother compositions
than Model 2 (see below). Model 1 is thus regarded as a specialized case of Model 2; without the prior know-ledge, Model 2 has to be used in predicting theoretical compositions.
Data Collection
We retrieved species and their corresponding codon usage totals from Codon Usage Database (http://www. kazusa.or.jp/codon/) [70], which was tabulated from NCBI GenBank Flat File Release 160.0. We excluded species with less than 64 coding sequences tabulated from nuclear DNA, in order to ensure a sufficient sam-ple size for estimating compositions of nucleotide, codon and amino acid. Species with alternative genetic codes were also eliminated from this study. As a conse-quence, we obtained a collection of 46 archaea, 686 bac-teria, and 826 eukaryotes tabulated in Codon Usage Database. Composition frequencies were computed by exclusion of stop codons.
Construction of amino acid exchange matrix
To construct amino acid exchange matrix, we defined five dataset groups: (1)Escherichia coli(E. coliUTI89,E. coliSakai,E. coliEDL933,E. coliATCC 8739 and E. coli
K12); (2) fruit fly (Drosophila melanogaster, D. sechellia, D. simulans, D. erecta, D. yakuba); (3) rice (Oryza indicaand O. sativa); (4) mammal (human, chimp and mouse); and (5) yeast (Saccharomyces cerevisiae, S. para-doxus, S. mikatae, and S. bayanus). For the first four groups, proteins sequences and their corresponding orthologous relationships were downloaded from Ensembl Genomes (Release 4; ftp://ftp.ensemblgenomes. org) and BioMart (http://www.biomart.org), respectively. For the fifth group (yeast), proteins sequences and their corresponding orthologous relationships were retrieved from Fungal Orthogroups Repository (version 1.1; http://www.broadinstitute.org/regev/orthogroups/). One-to-many or many-One-to-many orthologous relationships were excluded from this analysis, in order to avoid ambiguous or questionable orthologs. We then aligned protein sequences for each dataset group by using T-Coffee [71] and alignments with identity < 85% were removed from this analysis. As a result, we obtained orthologous alignments of 3119 inE. coli, 6302 in fruit fly, 16606 in rice, 6606 in mammal and 2026 in yeast. Finally, based on these orthologous alignments for each group, we constructed five amino acid exchange matrices.
Reviewers’comments Reviewer’s report 1
Molecular Biophysics and Biochemistry, Program in Computational Biology and Bioinformatics, Yale Univer-sity, Connecticut, USA)
Major comments
I thought the Introduction could be further clarified, please explicitly present and describe the Chargaff’s first and second rules (instead of just citing the papers, ref 39. 40). And please formerly define “purine content” and explain what is the expected value for it.
Authors’ responseWe expanded our descriptions on the Chargaff’s rules and purine content in the Introduction.
I don’t think it is S and R are independent, since S = G/C and R = A/G. It may not affect the analysis, but the authors need to clarify this.
Authors’responseAs defined, statistical independence of two variables means that the occurrence of one variable makes it neither more nor less probable that the other occurs. GC and purine contents are assumed indepen-dent in this study, which is based on Chargaff’s rules that for simplicity, A = T and G = C; therefore, purines are expected to be 50% since A+T+G+C = 2(A+G) = 100%, in contrast to broad variation of GC content. That is, in theory, GC (purine) content does not influence purine (GC) content variation. In reality, it is observed that species with very close purine (or GC) contents have variations in their GC (or purine) contents. For example, Streptococcus mutans UA159 and Rubrobacter xylano-philus DSM 9941 are similar in purine content (52%) but different in GC content (38% and 71%, respectively), and Bartonella quintana str. Toulouse and Clostridium thermocellum ATCC 27405 are similar in GC content (40%) but different in purine content (50% and 57%, respectively). Although GC and purine contents share nucleotide G in common, it does not mean that they are dependent. Suppose that two contents X and Y have no nucleotide in common, viz., mutually exclusive, for exam-ple, GC and AT, the increase (or decrease) of one content leads to the decrease (or increase) of the other. If two contents are mutually exclusive, they cannot be indepen-dent and vice versa [65]. We clarified this point more clearly in the Models.
Here the null model is that the frequency of a codon is the product of the frequency of individual nucleotide at each position. This is not very accurate since it is known genomes have severe dinucleotide biases.
Authors’response Our models adopt GC (S) and purine (R) contents to model genome compositional dynamics for nucleotides, codons and amino acids and therefore, dinu-cleotide bias is in fact represented primarily at the nucleo-tide level. Although it is not fully considered in codon composition, dinucleotide bias is accurately captured at the nucleotide level. For instance, given a sequence con-taining severe dinucleotide bias, CGCGCG..., it is observed that S = 100% and R = 50%. According to
equations 1-4, the expected contents of four nucleotides are A = (1-S)R = 0, T = (1-S)(1-R) = 0, G = SR = 50%, and C = S(1-R) = 50%, which is consistent with the observed compositions and captures well the severe dinu-cleotide bias.
Can the authors elaborate on these empirical relations
between S and Si? Are you referring to the observed
ratio between these two variables? I see the authors pro-vided some details in the Discussion session (page 11, 12), it may help the readers to move them up front. Authors’ response Empirical relationships between S and Siare not the observed ratio between the two
vari-ables, but the linear relationships derived from all gen-omes in individual domains of life (Additional file 1). We accepted the reviewer’s suggestion to move the text from the Discussion to the Models and elaborated on the description of the empirical relationships more clearly.
I can understand that the GC% could be mostly uni-form along the chromosome for prokaryotes and lower eukaryotes such as fly and nematodes; but for verte-brates like frog, chicken and mammals, it is known the chromosomes can be broken into regions (100 Kb at least) of uniform GC content, i.e. the so-called “
iso-chore”concept. Also different chromosomes may have
slightly different GC%, at least in mammalian genomes. It appears that the author took the GC% of the entire genome to predict nucleotide frequency. At least the authors should comment on this issue and how this would influence the analysis (by doing some simple experiments). Perhaps this is why the scatter plots for eukaryotes are not as linear as for bacteria and archaea. Authors’responseWe agree. We added the description on the influence of isochores on eukaryotes in the Discussion and accordingly cited two relevant references (Oliver, J.L., Bernaola-Galvan, P., Carpena, P. and Roman-Roldan, R. 2001. Isochore chromosome maps of eukaryotic genomes. Gene. 276: 47-56.; Bernardi, G. 2000. Isochores and the evolutionary genomics of vertebrates. Gene. 241: 3-17.)
Therefore, purine content should also be relevant with selection although it may be limited to a narrow range of content variation. We expanded our description on this point in the Discussion.
Minor issues not for publication
Notation: I suggest the authors use the notation of GC % instead of GC when referring to the nucleotide content.
Page 2, line 4, “have been allowing us” -> “have allowed us”
Page 2, line 6, quantization -> quantification Page 2, line 9,“take into account”
Page 6, line 15, typo“their the” Page 8, line 11, typo“again consistent”
Authors’ responseWe addressed the minor issues in the revised manuscript.
Reviewer’s report 2
Guruprasad Ananda, Huck Institute for the Life Sciences, Pennsylvania State University, Pennsylvania, USA (nomi-nated by Kateryna Makova, Department of Biology, Pennsylvania State University, Pennsylvania, USA)
This manuscript describes two models to quantify genome compositional dynamics for a wide range of genomes, both of which incorporate GC and purine contents as compositional parameters. These models are evaluated by comparing predicted with observed compo-sitions across three domains of life and these compari-sons yield a number of (mostly) descriptive results. First, this work demonstrates the combined role of GC con-tent and purine concon-tent in contributing to different compositions at the levels of nucleotides, codons and amino acids. Next, it reiterates previous findings about the role of mutations and selection acting at the nucleo-tide-level in causing differences between predicted and observed compositions. Interestingly, the deviation of observed from expected compositions is decoupled for the three codon-positions and underlying nucleotides (A/T vs. C/G) and is used as a measure of the strength of selection acting at each position/nucleotide. These deviations are also used to assess the degree of selection acting on different amino acids, the results of which seem closely consistent with other findings.
Although the models are described quite well, the same cannot be said about results and discussion. In particular, since the deviation of observed from expected compositions is used to derive biological inferences, I think it’d be good to provide some sort of a quantitative measurement that gives an idea about the extent of this deviation. For instance, since the deviations are used to assess the degree of selection at different codon posi-tions, having a value to these deviations can help in understanding the relative quantitative differences in the strengths of selection at the three codon-positions.
Authors’response
This study focuses on modeling genome compositional dynamics and we described the deviations of the observed from the expected compositions in the Discus-sion. Further investigation of these deviations is attrac-tive, but beyond the scope of this study. This suggestion would be an excellent suggestion for next step. In fact, these deviations can be estimated by several measures (e.g., Euclidean distance, cosine similarity, Kullback-Leibler divergence) and we have been working on an algorithm to statistically quantify these deviations, which will be sum-marized into another paper soon.
The paper does a decent job at describing the role of varying GC content as a determinant of compositions at all levels - as seen in Results, Discussion and Figures. However, the same cannot be said about the role of pur-ine content. The graphs of expected vs. observed com-positions are always plotted for GC content, although the models use both GC and purine contents as para-meters. One doesn’t get a clear picture of the effect of purine content on compositional dynamics. This there-fore clouds the results to an extent.
Authors’response
Compared to GC content, purine content varies at a relatively small range and the role of purine content in determining compositions is not significant as GC con-tent. However, it does not mean that purine content is not important. The small range of purine content owes to strong selection for particular amino acids, since pur-ine content has a determinative role in amino acid phy-sic-chemical properties. Its slight departure from 50% can lead to diversely different compositions, as indicated by equations 1-8. We clarified our description on purine content in the Discussion.
It is mentioned that Alanine and Valine are the two most departed amino acids (in the Discussion section, 6th paragraph). From Fig. S5, it becomes apparent why Valine is listed as one of the most departed amino acids; however it’s hard to draw this inference for Alanine. As mentioned above, quantifying the deviations can help better understand such differences. Also, it would be interesting to provide a table indicating the amount of deviation per amino acid, and one can then easily com-pare this information with the data from the exchange-ability matrices to understand to what extent the two are correlated.
Authors’response
We agree that providing the expected and observed fre-quencies of amino acids would help better understand the deviations. Thus, we summarized the information as Additional file5.
Minor issues:
Results, 1st paragraph, 6th line: of empirical... Results, 3rd paragraph (Codon composition),
5th line: one of the codons listed doesn’t match the ones in Figure 3. Replace CTC with CTT.
10th line: It should be TGC and GCC that correlate positively with GC content, right?
11th line: consistent with the observed...
Discussion, 5th paragraph (Considering nucleotide compositions...)
Although this part of the discussion is quite important and interesting, it is not well phrased. Please try to break up the long sentence about A/C vs. G/T.
Also the terms‘across’and‘between’the positions are slightly misleading. Please rephrase.
Authors’response
We accepted the minor issues and corrected the wording accordingly.
Reviewer’s report 3
Daniel Haft, The J. Craig Venter Institute, Rockville, Maryland, USA
Revised review of Daniel Haft:
Evolutionary change to genomic content includes mechanisms of lateral gene transfer, duplication, gene loss, insertion, deletion, and point mutation, all of which can alter the GC content of an organism. The most common point mutations, but by no means the only ones, are transitions, in which a nucleotide maintains its identity as a purine, or as a pyrimidine, but base pairs switch between AT and GC. Some organisms show extremely strong biases to either AT richness or GC richness, especially between genes and in the third posi-tion of each codon.
An earlier study by Knight, Freeland, and Landweber asks whether selection, with its effects on amino acid usage and their encoding by particular codons, drives GC bias in coding regions, or whether mutational biases towards a particular GC content more strongly drive patterns of codon usage and amino acid usage. The dif-ference between these two models is that viewing GC mutational bias as the driver would allow a very simple equation to predict most of the variance seen in codon frequencies and amino acid frequencies from species to species. Knight, et al. indeed find that the single para-meter of GC content can explain 71-87% of the variance across species in the differential usage of synonymous codons for a given amino acid, and 71-79% of the var-iance in the usage of different amino acids. The fact that codon positions 1, 2, and 3 respond so differently to overall coding region GC content in their models shows a balance between forces of mutation and selec-tion. Their work, on the whole, nicely reveals this bal-ance through examination of GC content alone.
The present study largely reiterates the work of Knight, Freeland, and Landweber, although coding regions for analysis are taken from roughly twice as many species, and graphs are shown for every codon and every amino acids in supplementary figures. In this study, it is noted that average purine content in coding regions, which represent just one strand at a time, may vary slightly in a narrow band around 50%, with the extremes among 686 bacteria never going below 48% or above 59%. The deviation of purine content from 50%, therefore, theoretically allows for a slight enhancement of the power of models based only on GC content to predict actual codon frequencies and therefore amino acid frequencies. However, the authors do not quantify the degree to which adding consideration of coding strand purine content explains additional variance in codon and amino acid frequencies. Without some quan-tifications of how much purine content improves the models, it is impossible for readers to judge the central claims of the paper. For this reason, the work being reported here is incomplete.
Authors’response
The purpose of this paper is to model compositional dynamics. GC and purine contents are regarded as two essential parameters in quantifying compositions, e.g., for four nucleotides, A = (1-S)R, T = (1-S)(1-R), G = SR, C = S(1-R). It can be seen from these equations that purine content has an important contribution to the model; as mentioned in Models, “a special case when R = 0.5, can lead to“. Our model for this special case when R = 0.5, is equivalent to the model proposed by Knight et, al (2001) that considers GC content alone.
The paper has several serious errors in its exposition and response to review comments.
1. The computational method relies on a change of coordinates for describing base composition from one based on T, A, G, and C to one described by just two variables, GC content and purine content. Changing coordinate systems is fine, but calling the two measures
“independent” is not, especially because of the logic used: “According to the Chargaff’s rules again, S varies broadly whereas R always centers at 50%, implying the
independence between S and R.” This becomes an
empty rationale for claiming independence when the actual deviation from 50% becomes a main theme of the paper. The deviation of purine content from 50%, and the deviation of codon position 2 GC content from overall GC content have many of the same drivers, and are not independent. It would be better simply to say that equations 1-8 allow for the four nucleotide frequen-cies to be described by just two parameters.
Authors’response
content always centers on 50%” is theoretically derived from Chargaff’s rules that A = T and G = C, and thus A + T + G + C = 2(A + G) = 100%. In practice, although purine content is not always 50%, the deviation range is relatively small, nearly 10% below or above 50%, whereas GC content varies broadly from ~20% to ~80%. The assumption of the independence of GC and purine contents, therefore, is based on practical observations. For example, in bacteria, Streptococcus mutans UA159 and Rubrobacter xylanophilus DSM 9941 are similar in purine content (52%) but different in GC content (38% and 71%, respectively), and Bartonella quintana str. Toulouse and Clostridium thermocellum ATCC 27405 are similar in GC content (40%) but different in purine content (50% and 57%, respectively).
2. The response to reviewer 1 about dinucleotide bias is deeply flawed. The claim is that GCGCGC is handled correctly, but in fact it is handled the same as GGGCCC, despite the different codons and amino acid frequencies that result. Any evolutionary process that drives an alteration in dinucleotide frequencies (for a given GC content) will cause their predictive models to be off systematically. Fits by the models, in fact, are not as good as suggested qualitatively in the discussion. The codons selected for display in Figure 3 as representative are much better behaved than some seen in supplemen-tary figure 4, where ratios of observed to predicted codon frequencies are off sometimes by two-to-one. It might be more prudent to admit that evolutionary mechanisms that introduce dinucleotide biases may be additional drivers of skewed codon frequencies, but are beyond the scope of the current work.
Authors’response
We agree that the deviations of the expected composi-tions from the observed result from a complex interplay of mutation and selection and relate closely to evolution-ary mechanisms, such as, dinucleotide abundance. We accepted the reviewer’s point to expand our discussion on these issues in the Discussion and cite a relevant reference “Karlin and Burge (1995). Trends Genet. 11: 283-290”.
3. Reviewer 2 joined me in requesting quantitative measures of how well the models fit. The response that the“algorithm to statistically quantify these deviations ...
will be summarized into another paper soon” is not
satisfying. Modeling why the fits are wrong may be beyond the scope of this paper, but measuring whether the models fit is actually essential.
Authors’response
Sequences from different species undergo differential evo-lutionary processes, consequently resulting in diverse compositions, even for sequences having same GC and purine contents. For different sequences, therefore, the fit-ness of the models would vary at different degrees,
suggesting diverse interplays of mutation and selection forces acting on these sequences. For a given composition, the models fit differently across different sequences, which can be influenced by several factors, most likely linked to the structure of the genetic code and physico-chemical properties of amino acid, protein structure, the abundance of iso-accepting transfer RNAs, and transla-tion efficiency and/or accuracy. To focus on our topics on modeling compositions, we only limited the description by taking the deviations of Ala and Val as examples in the Discussion.
4. The authors persist in describing collections of
cod-ing region sequences as “genomes” throughout much
of the manuscript, when “collected coding region
sequences” would be better.
Authors’response
We accepted the reviewer’s suggestion and revised our wording throughout the manuscript.
Overall, this paper does not make a strong case that tracking purine content in coding regions provides use-ful new insights or new working models for the study of molecular evolution.
Additional material
Additional file 1: Correlations between genome-wide GC content and GC contents at three codon positions and between genome-wide purine content and purine contents at three codon positions.
Additional file 2: Expected and observed nucleotide compositions across the three domains of life (46 archaea, 686 bacteria, and 826 eukaryotes).
Additional file 3: Expected and observed codon compositions across the three domains of life (46 archaea, 686 bacteria, and 826 eukaryotes).
Additional file 4: Expected and observed amino acid compositions across the three domains of life (46 archaea, 686 bacteria, and 826 eukaryotes).
Additional file 5: Comparison between expected and observed amino acid compositions.
Additional file 6: Amino acid exchange matrices inEscherichia coli, fruit fly, rice, yeast, and mammal.
Acknowledgements
We thank the reviewers for their critical comments and constructive suggestions on this manuscript and Prof. Mark Gerstein and Prof. Kateryna Makova for their excellent nominations. We also thank Peng Cui, Feng Ding, Lijia Ma, Jun Li, and Ang Li for their helpful discussions and Francesc Lopez-Giraldez for help on data collection. This work was supported by a faculty fund from King Abdullah University of Science and Technology (KAUST) awarded to JY.
Authors’contributions
ZZ designed the two models and drafted the manuscript. JY supervised the research and revised the manuscript. Both authors read and approved the final manuscript.
Competing interests
Received: 16 July 2010 Accepted: 8 November 2010 Published: 8 November 2010
References
1. Sueoka N:On the genetic basis of variation and heterogeneity of DNA base composition.Proc Natl Acad Sci USA1962,48:582-592.
2. Ikemura T:Correlation between the abundance of Escherichia coli transfer RNAs and the occurrence of the respective codons in its protein genes: a proposal for a synonymous codon choice that is optimal for the E. coli translational system.J Mol Biol1981,151:389-409. 3. Gouy M, Gautier C:Codon usage in bacteria: correlation with gene
expressivity.Nucleic Acids Res1982,10:7055-7074.
4. Sharp PM, Li WH:The codon Adaptation Index–a measure of directional synonymous codon usage bias, and its potential applications.Nucleic Acids Res1987,15:1281-1295.
5. Bennetzen JL, Hall BD:Codon selection in yeast.Journal of Biological Chemistry1982,257:3026-3031.
6. Ikemura T:Codon usage and tRNA content in unicellular and multicellular organisms.Mol Biol Evol1985,2:13-34.
7. Moriyama EN, Powell JR:Codon usage bias and tRNA abundance in Drosophila.J Mol Evol1997,45:514-523.
8. Akashi H:Distinguishing the effects of mutational biases and natural selection on DNA sequence variation.Genetics1997,147:1989-1991. 9. Vicario S, Moriyama EN, Powell JR:Codon usage in twelve species of
Drosophila.BMC Evol Biol2007,7:226.
10. Moriyama EN, Hartl DL:Codon usage bias and base composition of nuclear genes in Drosophila.Genetics1993,134:847-858.
11. Murray EE, Lotzer J, Eberle M:Codon usage in plant genes.Nucleic Acids Res1989,17:477-498.
12. Wang HC, Singer GA, Hickey DA:Mutational bias affects protein evolution in flowering plants.Mol Biol Evol2004,21:90-96.
13. Bernardi G, Mouchiroud D, Gautier C:Compositional patterns in vertebrate genomes: conservation and change in evolution.J Mol Evol 1988,28:7-18.
14. Wolfe KH, Sharp PM:Mammalian gene evolution: nucleotide sequence divergence between mouse and rat.J Mol Evol1993,37:441-456. 15. Bulmer M:The selection-mutation-drift theory of synonymous codon
usage.Genetics1991,129:897-907.
16. Akashi H:Codon bias evolution in Drosophila. Population genetics of mutation-selection drift.Gene1997,205:269-278.
17. Chen SL, Lee W, Hottes AK, Shapiro L, McAdams HH:Codon usage between genomes is constrained by genome-wide mutational processes.Proc Natl Acad Sci USA2004,101:3480-3485.
18. Kanaya S, Yamada Y, Kinouchi M, Kudo Y, Ikemura T:Codon usage and tRNA genes in eukaryotes: correlation of codon usage diversity with translation efficiency and with CG-dinucleotide usage as assessed by multivariate analysis.J Mol Evol2001,53:290-298.
19. Akashi H:Synonymous codon usage in Drosophila melanogaster: natural selection and translational accuracy.Genetics1994,136:927-935. 20. Sharp PM, Emery LR, Zeng K:Forces that influence the evolution of
codon bias.Philos Trans R Soc Lond B Biol Sci2010,365:1203-1212. 21. Stoletzki N, Eyre-Walker A:Synonymous codon usage in Escherichia coli:
selection for translational accuracy.Mol Biol Evol2007,24:374-381. 22. Xia X:Maximizing transcription efficiency causes codon usage bias.
Genetics1996,144:1309-1320.
23. Bernardi G:Compositional constraints and genome evolution.J Mol Evol 1986,24:1-11.
24. Xia X:Data Analysis in Molecular Biology and EvolutionBoston: Kluwer Academic Publishers; 2000.
25. Karlin S, Mrazek J:Compositional differences within and between eukaryotic genomes.Proc Natl Acad Sci USA1997,94:10227-10232. 26. Karlin S, Campbell AM, Mrazek J:Comparative DNA analysis across diverse
genomes.Annu Rev Genet1998,32:185-225.
27. Nekrutenko A, Li WH:Assessment of compositional heterogeneity within and between eukaryotic genomes.Genome Res2000,10:1986-1995. 28. Karlin S, Mrazek J, Campbell AM:Compositional biases of bacterial
genomes and evolutionary implications.J Bacteriol1997,179:3899-3913. 29. Zhao X, Zhang Z, Yan J, Yu J:GC content variability of eubacteria is
governed by the pol III alpha subunit.Biochem Biophys Res Commun2007, 356:20-25.
30. Ermolaeva MD:Synonymous codon usage in bacteria.Curr Issues Mol Biol 2001,3:91-97.
31. Knight RD, Freeland SJ, Landweber LF:A simple model based on mutation and selection explains trends in codon and amino-acid usage and GC composition within and across genomes.Genome Biol2001,2: RESEARCH0010.
32. Muto A, Osawa S:The guanine and cytosine content of genomic DNA and bacterial evolution.Proc Natl Acad Sci USA1987,84:166-169. 33. Gentles AJ, Karlin S:Genome-scale compositional comparisons in
eukaryotes.Genome Res2001,11:540-546.
34. Bharanidharan D, Bhargavi GR, Uthanumallian K, Gautham N:Correlations between nucleotide frequencies and amino acid composition in 115 bacterial species.Biochem Biophys Res Commun2004,315:1097-1103. 35. Goodarzi H, Torabi N, Najafabadi HS, Archetti M:Amino acid and codon
usage profiles: adaptive changes in the frequency of amino acids and codons.Gene2008,407:30-41.
36. Sorimachi K, Okayasu T:Codon evolution is governed by linear formulas. Amino Acids2008,34:661-668.
37. Hu J, Zhao X, Zhang Z, Yu J:Compositional dynamics of guanine and cytosine content in prokaryotic genomes.Res Microbiol2007,158:363-370. 38. Sueoka N:Compositional correlation between deoxyribonucleic acid and
protein.Cold Spring Harb Symp Quant Biol1961,26:35-43.
39. Chargaff E:Chemical specificity of nucleic acids and mechanism of their enzymatic degradation.Experientia1950,6:201-209.
40. Chargaff E:Some recent studies on the composition and structure of nucleic acids.J Cell Physiol Suppl1951,38:41-59.
41. Foster PG, Jermiin LS, Hickey DA:Nucleotide composition bias affects amino acid content in proteins coded by animal mitochondria.J Mol Evol1997,44:282-288.
42. Bernardi G:Isochores and the evolutionary genomics of vertebrates.Gene 2000,241:3-17.
43. Oliver JL, Bernaola-Galvan P, Carpena P, Roman-Roldan R:Isochore chromosome maps of eukaryotic genomes.Gene2001,276:47-56. 44. Yu J:A content-centric organization of the genetic code.Genomics
Proteomics Bioinformatics2007,5:1-6.
45. Gu X, Li WH:A model for the correlation of mutation rate with GC content and the origin of GC-rich isochores.J Mol Evol1994,38:468-475. 46. Xiao JF, Yu J:A scenario on the stepwise evolution of the genetic code.
Genomics Proteomics Bioinformatics2007,5:143-151.
47. Gu X, Hewett-Emmett D, Li WH:Directional mutational pressure affects the amino acid composition and hydrophobicity of proteins in bacteria. Genetica1998,102-103:383-391.
48. Foerstner KU, von Mering C, Hooper SD, Bork P:Environments shape the nucleotide composition of genomes.EMBO Rep2005,6:1208-1213. 49. Biro JC, Benyo B, Sansom C, Szlavecz A, Fordos G, Micsik T, Benyo Z:A
common periodic table of codons and amino acids.Biochem Biophys Res Commun2003,306:408-415.
50. Copley SD, Smith E, Morowitz HJ:A mechanism for the association of amino acids with their codons and the origin of the genetic code. Proceedings of the National Academy of Sciences of the United States of America2005,102:4442-4447.
51. Lobry JR, Sueoka N:Asymmetric directional mutation pressures in bacteria.Genome Biol2002,3:RESEARCH0058.
52. Albu M, Min XJ, Golding GB, Hickey D:Nucleotide Substitution Bias within the Genus Drosophila Affects the Pattern of Proteome Evolution. Genome Biol Evol2009,2009:288-293.
53. Karlin S, Burge C:Dinucleotide relative abundance extremes: a genomic signature.Trends Genet1995,11:283-290.
54. Yang Z, Nielsen R:Mutation-selection models of codon substitution and their use to estimate selective strengths on codon usage.Mol Biol Evol 2008,25:568-579.
55. Rodrigue N, Philippe H, Lartillot N:Mutation-selection models of coding sequence evolution with site-heterogeneous amino acid fitness profiles. Proc Natl Acad Sci USA2010,107:4629-4634.
56. Sueoka N:Directional mutation pressure and neutral molecular evolution.Proc Natl Acad Sci USA1988,85:2653-2657.
57. Hershberg R, Petrov DA:Selection on codon bias.Annu Rev Genet2008, 42:287-299.
59. Seligmann H:Cost-minimization of amino acid usage.J Mol Evol2003, 56:151-161.
60. Archetti M:Selection on codon usage for error minimization at the protein level.J Mol Evol2004,59:400-415.
61. Zhu CT, Zeng XB, Huang WD:Codon usage decreases the error minimization within the genetic code.J Mol Evol2003,57:533-537. 62. Archetti M:Codon usage bias and mutation constraints reduce the level
of error minimization of the genetic code.J Mol Evol2004,59:258-266. 63. Bag SK, Paul S, Ghosh S, Dutta C:Reverse polarization in amino acid and
nucleotide substitution patterns between human-mouse orthologs of two compositional extrema.DNA Res2007,14:141-154.
64. Tang H, Wyckoff GJ, Lu J, Wu CI:A universal evolutionary index for amino acid changes.Mol Biol Evol2004,21:1548-1556.
65. Bhat BR:Independence.Modern Probability Theory.Third edition. New Delhi: New Age International; 1999, 213-230.
66. Bofkin L, Goldman N:Variation in evolutionary processes at different codon positions.Mol Biol Evol2007,24:513-521.
67. D’Onofrio G, Bernardi G:A universal compositional correlation among codon positions.Gene1992,110:81-88.
68. Majumdar S, Gupta SK, Sundararajan VS, Ghosh TC:Compositional correlation studies among the three different codon positions in 12 bacterial genomes.Biochem Biophys Res Commun1999,266:66-71. 69. Anisimova M, Kosiol C:Investigating protein-coding sequence evolution
with probabilistic codon substitution models.Mol Biol Evol2009, 26:255-271.
70. Nakamura Y, Gojobori T, Ikemura T:Codon usage tabulated from international DNA sequence databases: status for the year 2000.Nucleic Acids Res2000,28:292.
71. Notredame C, Higgins DG, Heringa J:T-Coffee: A novel method for fast and accurate multiple sequence alignment.J Mol Biol2000,302:205-217.
doi:10.1186/1745-6150-5-63
Cite this article as:Zhang and Yu:Modeling compositional dynamics
based on GC and purine contents of protein-coding sequences.Biology
Direct20105:63.
Submit your next manuscript to BioMed Central and take full advantage of:
• Convenient online submission
• Thorough peer review
• No space constraints or color figure charges
• Immediate publication on acceptance
• Inclusion in PubMed, CAS, Scopus and Google Scholar • Research which is freely available for redistribution