R E S E A R C H A R T I C L E
Open Access
Intimate partner violence against women in
Maputo city, Mozambique
Antonio Eugenio Zacarias
1,2*, Gloria Macassa
1,3, Leif Svanström
1, Joaquim JF Soares
1,4and Diddy Antai
1,5Abstract
Background:There is limited research about IPV against women and associated factors in Sub-Saharan Africa, not least Mozambique. The objective of this study was to examine the occurrence, severity, chronicity and“predictors” of IPV against women in Maputo City (Mozambique).
Methods:Data were collected during a 12 month-period (consecutive cases, with each woman seen only once) from 1,442 women aged 15–49 years old seeking help for abuse by an intimate partner at the Forensic Services at the Maputo Central Hospital, Maputo City, Mozambique. Interviews were conducted by trained female interviewers, and data collected included demographics and lifestyle variables, violence (using the previously validated Revised Conflict Tactics Scale (CTS2), and control (using the Controlling Behaviour Scale Revised (CBS-R). The data were analysed using bivariate and multivariate methods.
Results:The overall experienced IPV during the past 12 months across severity (one or more types, minor and severe) was 70.2% (chronicity, 85.8 ± 120.9).aSevere IPV varied between 26.3-45.9% and chronicity between 3.1 ± 9.1-12.8 ± 26.9, depending on IPV type. Severity and chronicity figures were higher in psychological aggression than in the other IPV types. Further, 26.8% (chronicity, 55.3 ± 117.6) of women experienced all IPV types across severity. The experience of other composite IPV types across severity (4 combinations of 3 types of IPV) varied between 27.1-42.6% and chronicity between 35.7 ± 80.3-64.9 ± 110.9, depending on the type of combination. The combination psychological aggression, physical assault and sexual coercion had the highest figures compared with the other combinations.. The multiple regressions showed that controlling behaviours, own perpetration and co-occurring victimization were more important in“explaining”the experience of IPV than other variables (e.g. abuse as a child).
Conclusions:In our study, controlling behaviours over/by partner, own perpetration, co-occurring victimization and childhood abuse were more important factors in“explaining”sustained IPV. More investigation into women’s IPV exposure and its“predictors”is warranted in Sub-Saharan Africa, particularly Mozambique.
Keywords:Intimate partner violence, Victims, Controlling behaviours, Perpetration, Abuse as a child
Background
Intimate partner violence (IPV) towards women is an enduring public health problem world-wide, with effects ranging from financial hardships and decreased intimacy to high rates of morbidity and mortality. In sub-Saharan Africa (SSA), the poor living and health conditions of women may be further exacerbated by IPV [1,2]. The Centre of Disease and Prevention (www.cdc.gov/) and
Saltzman et al. (2002) [3] define IPV as“physical, sexual or psychological harm by current or former partner or spouse”[3]. Data from SSA show that 5–29% of women are physically assaulted by their male intimate partners each year and 13–59% during life-time, with the annual rates of assault with injury ranging from 2–45.9% [1,2,4-10]. The 12-month sexual coercion rates vary between 9.1 44.4% yearly and ever coerced bebetween 16.5 -58.6%, [1,2,5-7,10,11], whilst verbal/emotional aggression during the past 12 months and life-time may be as elevated as 51% and 67.5%, respectively [5,6,10,12-14]. Different types of IPV often co-occur, and a review of IPV in 7 African countries (Cameron, Kenya, Malawi,
* Correspondence:antonio.zacarias@ki.se
1
Department of Public Health Sciences, Division of Social Medicine, Karolinska Institutet, Stockholm SE-17176, Sweden
2
Eduardo Mondlane University, Faculty of Medicine, Maputo City, Mozambique
Full list of author information is available at the end of the article
Rwanda, Uganda, Zambia and Zimbabwe), showed that rates of co-occurring emotional aggression, physical assault and sexual coercion varied between 3.6 - 8.3%, and physical assault and sexual coercion between 6.8 -30.1% [5].
Male coercion or controlling behaviour (e.g. my part-ner always wants to know where I am) has been asso-ciated with high IPV risk for women [2,5,14-16], but in certain conditions (e.g. women’s unfaithfulness) both men and women may condone abuse [12,17]. Controlling be-haviour in intimate relationships has been described as “when one partner (most commonly the man) uses threats and emotional abuse to maintain control over the other partner (most commonly the woman)” [18]. Controlling behaviour reflects a power structure within the relation-ship, and has been shown to be significantly associated with higher likelihood of use of violence [16], by men against women. A recent study with university students from Ghana showed that the frequency of use of control-ling behaviours and victimization/perpetration amongst men and women (e.g. control the other’s money) were similar, and that controlling behaviours were a“predictor” of IPV [19]. Women’s experiences of abuse during child-hood in SSA may be relatively common [1,8,20-24]; how-ever, few studies seem to have addressed the relation between abuse during childhood and IPV exposure in adulthood, with results showing a positive association [8,24]. Data on the relation between IPV and socio-economic status are conflicting, with some studies report-ing that women livreport-ing in poor socio-economic conditions (e.g. unemployed) are more exposed to IPV [8,25], whilst others suggest that empowered women (e.g. employed) are at higher risk [13,15]. Heavy alcohol use by men and women has also been associated with IPV [8,12,26,27]. The influence of women’s IPV perpetration on their own victimization in SSA has attracted little attention, but studies indicate that women perpetrate abuse against their male intimate partners at rates from 0.5–27% [2,10,12-15,26,28]. Two studies in Mozambique reported that 8% [25] and 37% [29] of men, respectively, were physically assaulted by their female intimate partners during the past 12 months.
Few studies have addressed the association between controlling behaviours and women’s exposure to IPV in Sub-Saharan Africa, and only one study has examined the connection between controlling behaviours and victimization/perpetration among both sexes [19]. Evi-dence suggests also that women`s use of coercion is related to their IPV victimization/perpetration [19]; such knowledge may be important to tailor specific interven-tions to deal with the influence of control in violence, but also to deal with dominance issues in general. Thus, to fill this gap, the current study investigated the fre-quency, severity and chronicity of IPV (psychological
aggression, physical assault, sexual coercion, physical as-sault with injury) experienced by women seeking help for abuse by partner using the Conflict Tactics Scales 2 (CTS2) [30], as well as the help-seeking women’s experi-ences of being controlled and using controlling behaviours in relation to their IPV exposure using the Controlling Behaviour Scale Revised (CBS-R) [31,32].
Conceptual framework
Feminist theory argues that the risk factors of IPV are at socio-political levels. This theory looks at how men and women are acculturated into protagonists of power/ controlling behaviours [33-35]. This framework concep-tualizes that power imbalances within the patriarchal so-cieties create a gender social order that gives men rights and authority within the family/relationship over women. This results in men exercising power and control over women in several ways including the use violence/abuse as a tool to keep power/controlling behaviour [33-35]. This theory offers a comprehensive understanding of fac-tors that may influence IPV exposure. The approach used reflect that causes and outcomes of IPV due the protagon-ist of power/controlling behaviours surrounded by the relationship/family associated with demographic, socio-economic and life-style factors.
The aim of this study was therefore to: (i) describe women’s experiences of IPV by type (psychological aggres-sion, physical assault, sexual coercion, physical assault with injury), overall IPV and co-occurring IPV during the past 12 months; (ii) examine the association between IPV types, and demographic, socio-economic and life-style variables; and (iii) Identify and quantify factors associated with IPV by type (e.g. controlling behaviours).
It is hypothesized that the traditional gender role asso-ciated with demographic/socio-economic factors and controlling behaviours by partner increase the likelihood of being victimized of IPV.
Methods
Participants/Setting
Table 1 Demographic/socio-economic and life-style characteristics of women as victims of IPV during the past 12 months
Variables Psychological aggression (n = 1433) Physical assault (n = 1432)
Yes No Yes No
n % n % n % n %
Age(years) (n) NS NS
Mean ± SD 28.7 ± 8.1 28.8 ± 8.7 28.7 ± 7.9 29.5 ± 8.8
Marital status(n) (1405) χ2(3) = 51.7, p < 0.0001 (1404) χ2(3) = 22.6, p < 0.0001
Single 489 53.5 251 51.2 388 51.1 352 54.6
Married/cohabitant 302 33 103 21 253 33.4 151 23.4
Divorced/separated 88 9.6 90 18.4 86 11.3 92 14.3
Widow 36 3.9 46 9.4 32 4.2 50 7.7
Children at home(n) (1348) NS (1347) NS
Yes 649 73.1 352 76.5 554 75 446 73.4
Housing(n) (1408) NS (1407) NS
Conventionala 787 85.5 411 84.4 650 84.8 547 85.3
Non-conventionalb 134 14.5 76 15.6 116 15.2 94 14.7
Education(n) (1423) χ2(3) = 17.2, p = 0.0006 (1422) NS
Noc 45 4.8 46 9.4 43 5.5 48 7.4
Lowd 236 25.4 148 30.1 206 26.6 178 27.5
Intere 519 55.7 241 49 427 55.2 333 51.4
Highf 131 14.1 57 11.5 98 12.7 89 13.7
Occupational status(n) (1381) NS (1380) NS
Blue-collar worker 504 55.8 294 61.5 440 58.8 358 56.7
Low white-collar worker 47 5.2 18 3.8 35 4.7 30 4.7
Middle/high white-collar worker 103 11.4 50 10.5 86 11.5 67 10.6
Student/other 249 27.6 116 24.2 187 25 177 28
Socio-economic status(n) (1417) NS (1416) NS
Work for othersg 320 34.4 145 29.8 277 35.8 188 29.3
Liberal/own businessh 149 16 99 20.3 124 16 124 19.3
Student 251 27 115 23.6 190 24.6 175 27.3
Domestic/otheri 210 22.6 128 26.3 183 23.6 155 24.1
Salary/financial resources(n) (1386) NS (1386) NS
Yes 424 46.4 213 45.1 362 47.5 275 44.1
Financial strain(n) (1405) NS (1404) NS
Yes 774 83.9 420 87.1 651 84.8 542 85.2
BMI(n) (1316) NS (1315) NS
Mean ± SD 25 ± 4.6 24.5 ± 4.8 25.1 ± 4.6 24.5 ± 4.8
Alcohol use(n) (1412) χ2(1) = 8, p = 0.0046 (1411) χ2(1) = 9.4, p = 0.0021
Yes 364 39.5 156 31.8 310 40.5 210 32.6
Cigarette use(n) (1399) NS (1398) NS
Yes 65 7.1 33 6.8 60 7.9 38 5.9
Age(years) (n) NS NS
Mean ± SD 28.6 ± 7.9 29.6 ± 8.7 29.6 ± 7.7 28.8 ± 8.7
Marital status(n) (1405) χ2(3) = 30.1, p < 0.0001 (1404) χ2(3) = 32.8, p < 0.0001
Single 390 54.6 350 50.7 209 43.5 531 57.5
Married/cohabitant 230 32.2 175 25.3 174 36.3 230 24.9
Divorced/separated 68 9.5 110 15.9 75 15.6 103 11.1
Measures
Dependent variables: Intimate partner violence (IPV) was assessed with the CTS2 scales [30], from which the dependent variables (psychological aggression, physical assault, sexual coercion, physical assault with injury) were derived. The women were asked whether they per-petrated the various types of IPV (39 items) and then whether they had been victims of the same IPV types (39 items). Thus, the CTS2 has a total number of 78 items. The CTS2 covers negotiation, emotional (e.g. said I was sure we could work out a problem) and cognitive (e.g. explained my side of a disagreement to my partner); psychological aggression, severe (e.g. called my partner fat or ugly) and minor (e.g. shouted or yelled at my part-ner); physical assault, severe (e.g. kicked my partner) and minor (e.g. grabbed my partner); sexual coercion, severe
(e.g. used threats to make my partner have sex) and minor (e.g. made my partner have sex without a con-dom); physical assault with injury, severe (e.g. had a broken bone from a fight with my partner) and minor (e.g. had a sprain, bruise, or small cut because of a fight with my partner); and chronicity (how often the acts happened). Frequency of the acts was categorized as once, twice, 3–5, 6–10, 11–20 or >20 times during the past year, and did not occur within the past year, but be-fore the last year or never occurred.b Chronicity was assessed by calculating the mean number of times the violent acts in each scale (minor, severe, overall) oc-curred among those who experienced at least one vio-lent act [30]. The validity and reliability of CTS2 has been shown to be good [30]. Further, we measured who initiated the physical assault.cIn this study, the questions
Table 1 Demographic/socio-economic and life-style characteristics of women as victims of IPV during the past 12 months(Continued)
Children at home(n) (1348) NS (1347) χ2(1) = 42.1, p < 0.0001
Yes 513 74.2 488 74.3 397 84.8 603 68.6
Housing(n) (1408) NS (1407) χ2(1) = 6.6, p = 0.0103
Conventionala 615 85.5 583 84.6 398 81.8 799 86.8
Non-conventionalb 104 14.5 106 15.4 89 18.2 121 13.2
Education(n) (1423) NS (1422) NS
Noc 37 5.1 54 7.7 34 7 57 6.1
Lowd 185 25.5 199 28.6 145 29.6 239 25.7
Intere 399 54.9 361 51.8 252 51.4 508 54.5
Highf 105 114.5 83 11.9 59 12 128 13.7
Occupational status(n) (1381) NS (1380) χ2(3) = 36.9, p < 0.0001
Blue-collar worker 403 57.4 395 58.2 300 64.1 498 54.6
Low white-collar worker 35 5 30 4.4 23 4.9 42 4.6
Middle/high white-collar worker 82 11.7 71 10.4 67 14.3 86 9.4
Student/other 182 25.9 183 27 78 16.7 286 31.4
Socio-economic status(n) (1417) NS (1416) χ2(3) = 39.4, p < 0.0001
Work for othersg 264 36.4 201 29 197 40.2 268 29
Liberal/own businessh 118 16.3 130 18.8 87 17.8 161 17.4
Student 184 25.3 182 26.3 80 16.3 285 30.8
Domestic/othersi 159 22 179 25.9 126 25.7 212 22.8
Salary/financial resources(n) (1386) NS (1386) χ2(1) = 16.1, p = 0.0001
Yes 344 48.4 293 43.4 256 53.3 381 42.1
Financial strain(n) (1405) NS (1404) χ2(1) = 6.3, p = .012
Yes 605 84.1 589 85.7 429 88.3 764 83.2
BMI(n) (1316) NS (1315) (F(1,1313) = 10.7, p = 0.0011
Mean ± SD 24.9 ± 4.5 24.7 ± 4.9 25.4 ± 4.7 24.5 ± 4.7
Alcohol use(n) (1412) χ2(1) = 15.1, p < 0.0001 (1411) χ2(1) = 9, p = 0.0026
Yes 300 41.7 220 31.7 205 42.2 315 34.1
Cigarette use(n) (1399) χ2(1) = 6.6, p = 0.011 (1398) χ2(1) = 23.8, p < 0.0001
Yes 62 8.7 36 5.2 56 11.6 42 4.6
a
= e.g. own/rent housing in cement;b= e.g. own/rent housing in local materials wood;c= cannot read/write;d= primary school/similar
e
= secondary school/similar;f
= university/similar;g
= e.g. clerks;h
= e.g. accountants;i
on negotiation and who initiated the physical assault were not processed. Detailed bivariate data on perpetra-tion are not presented here. The Cronbach α´s were 0.82 for psychological aggression, 0.89 for physical sault, 0.73 for sexual coercion and 0.65 for physical as-sault with injury.
Abuse as a child was assessed with 4 open questions, one each for psychological abuse (e.g. shouted or yelled at), physical abuse (e.g. beaten up), sexual abuse (e.g. forced to have sex) and injury (e.g. bruised). Addition-ally, chronicity (how often the acts happened) was assessed. Frequency of the acts was assessed as: once, twice, 3–5, 6–10, 11–20 or >20 times or never happened.d The questions provided information about the respon-dent’s exposure to abuse before the age of 15 years. Detailed bivariate data on childhood abuse are not pre-sented here. The Cronbach α´s were 0.70 for psycho-logical abuse, 0.72 for physical abuse, 0.68 for sexual abuse and 0.71 for injury.
Controlling behaviours were assessed with the Control-ling Behaviour Scale Revised (CBS-R) [31,32]. The CBS-R consists of 24 questions, does not involve questions of physical assault and has good discriminative ability [31,32]. Questions include controlling the other’s money and try to restrict time one spent with family or friends. The response format has a range of 0–4 (never to always), and a total range of 0–96. The women were required to report how often they used each act of control toward their partners in the last year and how often their partners used each act on them; high scores correspond to high control. Detailed bivariate data on controlling behaviours are not presented here. Cronbach α’s for women being controlled and using controlling behaviours were 0.93 and 0.91, respectively.
Life-style variables: (i) Use of alcohol and cigarettes (yes or no); (ii) A Body Mass Index (BMI), based on self-reported height and weight, and computed for each woman with the formula kg/m2. BMI was computed be-cause evidence has shown that eating disorders (e.g., anorexia, bulimia) are among the mental health conse-quences of IPV. Thus, excessive weight gain or loss may be some of the first indications of such trauma [36].
Demographic/socio-economic variables included: age (in years), marital status (single, married/cohabitant, divorced/ separated, widow), children at women (yes or no), housing (conventional or non-conventional), education (cannot read/write, low, intermediate, high), occupational status (blue collar, low white-collar, middle/high white-collar, student/other), socio-economic status (work for others, liberal/own business, student, domestic/other), salary/ financial resources (yes or no), and financial strain i.e. con-cerns about how to make ends meet or provide for her needs, was assessed with one question in a no/sometimes/ often/always format. A woman was defined as experiencing
financial strain if she selected any response other than no. These items were largely derived from a classification sys-tem concerning socio-economics etc., which is used in Mozambique (Ministry Council–Ministry of Finances).
Design/procedure
Data from this cross-sectional study were collected dur-ing 12 months (consecutive cases) among women who had contact with the Forensic Services at the Maputo Central Hospital (Maputo City, Mozambique) for their IPV experiences between April 1, 2007 and March 31, 2008. The women were either self-referred, referred by female organizations, or referred by the Police, with the majority being referred by female organizations or self-referred. No annotations were made concerning how many of the women were referred by female organisa-tions and police, and self-referred. Trained female inter-viewers (medical students at the Faculty of Medicine and nurses at the Forensic Services) informed the women about all details of the research, what was expected of them and the way information would be handled (ver-bally or ver(ver-bally/in writing). Strong emphasis was put on voluntariness, confidentiality and that non-participation would not lead to any negative effects. After receiving permission, the women were interviewed (on average 1 hour) in a private room by means of a questionnaire. Data management (e.g. processing) were conducted according to usual anonymous and confidentiality rules, and findings from the study would be published, using aggregated and de-identified data only. Feed-back infor-mation on the study will be made available to partici-pants, at request, as aggregate data relationships. The National Ethical Committee at the Ministry of Health of Mozambique approved the study.
Statistical analyses
Data on IPV types (psychological aggression, physical assault, sexual coercion, physical assault with injury) during the past 12 months were described in form of raw figures, percentages, means and standard deviation (SD). The relation between IPV types, demographic/ socio-economic and life-style variables were examined with analysis of variance (ANOVAs) and chi-square tests (χ2). The significance level for bivariate analyses was set at p < 0.0125 and for multivariate analyses at p < 0.05.
descriptive goodness-of-fit statistics to assess the fit of the proposed logistic model (quantify the strength of associ-ation between variables) [37]. Results were expressed in form of odds ratios (ORs) and 95% confidence intervals (95% CI).
In the regressions, the independent factors included were variables significantly related to each IPV type in the bivariate analyses. Demographics/socio-economics were entered first in the models followed by life-style, controlling behaviours, perpetration, victimisation and abuse as a child, a procedure often used in studies in the field. Concretely, the included independent factors were marital status, having children at home, housing, education, occupational status, socio-economic status, having salary/financial resources, financial strain, BMI, and smoking and alcohol use (yes/no). Further, we added controlling behaviours over/by partner, women’s IPV perpetration and victimisation by type (e.g. psycho-logical aggression)e and childhood abuse (e.g. psycho-logical). The regression models differed for each IPV type depending on results of the bivariate analyses, but some of the variables (e.g. control) were used in all models. All variables with more than two categories were transformed into dummy variables.
Results
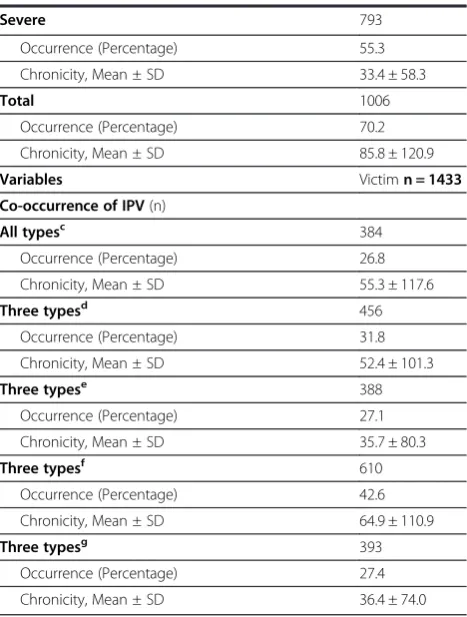
Occurrence, chronicity, severity and co-occurrence of IPV As shown in Table 2, 45.9% (chronicity, 11.4 ± 19.8)f of the women experienced severe psychological aggression; 44% (chronicity, 12.8 ± 26.9) severe physical assault; 29.2% (mean chronicity, 6.1 ± 15.1) severe sexual coer-cion; and 26.3% severe physical assault with injury (chronicity, 3.1 ± 9.1). The overall experienced IPV across severity (one or more types, minor and severe) was 70.2% (chronicity, 85.8 ± 120.9), of which 55.3% was severe abuse (chronicity, 33.4 ± 58.3). Further, co-occurring IPV exposure across severity showed the fol-lowing patterns: 26.8% (chronicity, 55.3 ± 117.6) of the women experienced all IPV types; 31.8% (chronicity, 52.4 ± 101.3) experienced a combination of psychological aggression, physical assault and physical assault with in-jury; 27.1% (chronicity, 35.7 ± 80.3) experienced a com-bination of physical assault, sexual coercion and physical assault with injury; 42.6% (chronicity, 64.9 ± 110.9) experienced a combination of psychological aggression, physical assault and sexual coercion; and 27.4% (chron-icity, 36.4 ± 74.0) experienced a combination of psycho-logical aggression, sexual coercion and physical assault with injury.
Demographics/socio-economics, life-style and IPV
Psychological aggression. As shown in Table 1, psycho-logically aggressed women compared to counterparts more often were single, more often had secondary
education levels and more often used alcohol. Physical assault. Physically assaulted women compared to coun-terparts more often were single and more often used al-cohol. Sexual coercion. Sexually coerced women more often were single and more often used alcohol/cigarettes. Physical assault with injury. Injured women compared to counterparts more often were single and blue-collar workers, more often worked for others and resided in conventional housing, more often had salary/financial resources and children at home, and experienced greater financial strain. They also had a higher BMI and more often used alcohol/cigarettes.
Factors associated with IPV
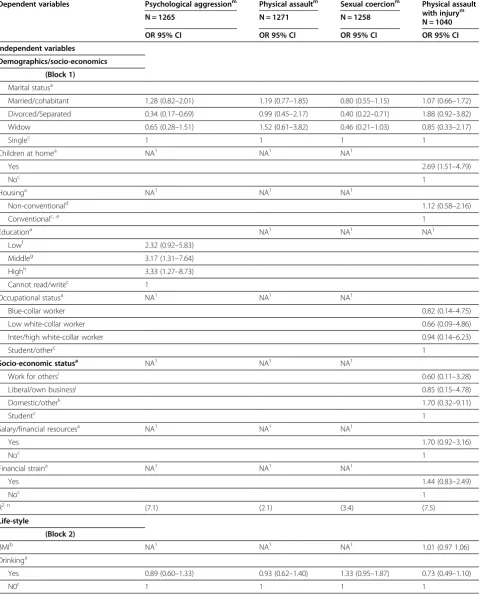
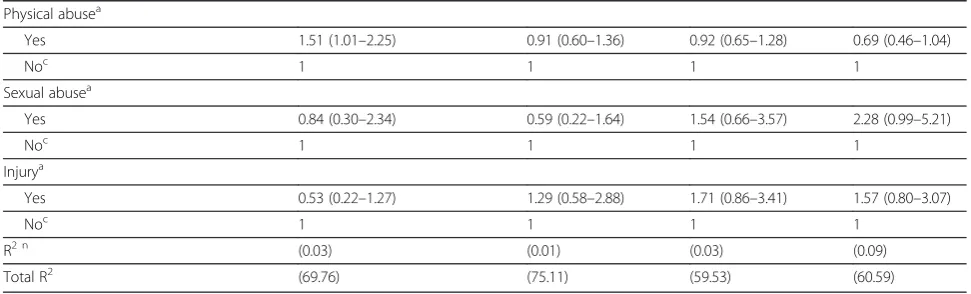
As shown in Table 3, the likelihood of psychological ag-gression was lower among divorced/separated women (OR = 0.34; 95% CI = 0.17-0.69) compared to single women, and women who were controlled by partner (OR = 0.98; 95% CI = 0.97-0.99) compared women who were not controlled. In contrast, the likelihood of psy-chological aggression was higher among women with middle (OR = 3.17; 95% CI = 1.31- 7.64) and high educa-tion (OR = 3.33; 95 CI = 1.27-8.73) compared to women who could not read or write. Women who controlled their partner (OR = 1.03; 95% CI = 1.01-1.05) were more likely to experience psychological aggression. In addition, the likelihood of being victimised was higher among women who perpetrated physical assault against male partner (OR = 2.40; 95% CI = 1.22-4.74) compared to those who did not, and among women who experi-enced co-occurrence of victimization [physical assault & psychological aggression (OR = 13.63; 95% CI = 1.65-24.29); sexual coercion & psychological aggression (OR = 8.23; 95% CI = 4.69-14.44); and physical assault with injury & psychological aggression (OR = 4.25; 95% CI = 2.01-8.98), compared to those who did not experi-ence co-occurring victimization. Women who were physically abused as a child (OR = 1.51; 95% CI = 1.01-2.25) were more likely to experience psychological ag-gression compared to those who did not.
The likelihood of being sexually coerced was lower among divorced and separated women (OR = 0.40; 95% CI = 0.22-0.71) compared to those who were single. Sex-ual coercion was more likely among women who perpe-trated psychological aggression (OR = 1.89; 95% CI = 1.10-3.27) and physical assault with injury (OR = 2.02; 95% CI = 1.22-3.32), among women who experienced co-occurring psychological aggression & sexual coercion (OR = 5.80; 95% CI = 3.24-10.39), and physical assault & sexual coercion (OR = 3.71; 95% CI = 2.41-5.70) com-pared to women who did not.
Physical assault with injury was more likely among women who had children at home (OR = 2.69; 95% CI = 1.51-4.79) compared to those who did not have children at home, as well as by women who were controlled by partner (OR = 1.04; 95% CI = 1.03-1.05) compared to those who were not. Women who perpetrated sexual co-ercion (OR = 1.95; 95% CI = 1.22-3.11) were more likely to experience physical assault with injury compared to Table 2 The distribution of IPV by single and
co-occurring types and chronicity during the past 12 months among women
Variables Victim n = 1433 Psychological aggression(n)
Minor 913
Occurrence (Percentage) 63.7
Chronicity, Mean ± SD 23.9 ± 29.8
Severe 658
Occurrence (Percentage) 45.9
Chronicity, Mean ± SD 11.4 ± 19.8
Totala 936
Occurrence (Percentage) 65.3
Chronicity, Mean ± SD 35.3 ± 45.5
Physical assault(n) (1432)
Minor 729
Occurrence (Percentage) 50.9
Chronicity, Mean ± SD 14.9 ± 27.6
Severe 629
Occurrence (Percentage) 44
Chronicity, Mean ± SD 12.8 ± 26.9
Totala 778
Occurrence (Percentage) 54.3
Chronicity, Mean ± SD 27.7 ± 51.5
Sexual coercion(n)
Minor 686
Occurrence (Percentage) 47.9
Chronicity, Mean ± SD 10.2 ± 16.4
Severe 418
Occurrence (Percentage) 29.2
Chronicity, Mean ± SD 6.1 ± 15.1
Totala 730
Occurrence (Percentage) 50.9
Chronicity, Mean ± SD 16.3 ± 28.3
Physical assault with injury(n) (1432)
Minor 432
Occurrence (Percentage) 30.2
Chronicity, Mean ± SD 3.3 ± 8.9
Severe 377
Occurrence (Percentage) 26.3
Chronicity, Mean ± SD 3.1 ± 9.1
Totala 492
Occurrence (Percentage) 34.4
Chronicity, Mean ± SD 6.4 ± 15.4
Overall IPVb
Minor 987
Occurrence (Percentage) 68.9
Chronicity, Mean ± SD 52.4 ± 67.8
Table 2 The distribution of IPV by single and co-occurring types and chronicity during the past 12 months among women(Continued)
Severe 793
Occurrence (Percentage) 55.3
Chronicity, Mean ± SD 33.4 ± 58.3
Total 1006
Occurrence (Percentage) 70.2
Chronicity, Mean ± SD 85.8 ± 120.9
Variables Victimn = 1433 Co-occurrence of IPV(n)
All typesc 384
Occurrence (Percentage) 26.8
Chronicity, Mean ± SD 55.3 ± 117.6
Three typesd 456
Occurrence (Percentage) 31.8
Chronicity, Mean ± SD 52.4 ± 101.3
Three typese 388
Occurrence (Percentage) 27.1
Chronicity, Mean ± SD 35.7 ± 80.3
Three typesf 610
Occurrence (Percentage) 42.6
Chronicity, Mean ± SD 64.9 ± 110.9
Three typesg 393
Occurrence (Percentage) 27.4
Chronicity, Mean ± SD 36.4 ± 74.0
a
= exposed to minor and severe IPV;b
= exposed to minor, severe IPV (one or more types);c
= all types (psychological aggression, physical assault, sexual coercion and physical assault with injury across severity);d
= psychological aggression, physical assault and physical assault with injury across severity;
e
= physical assault, sexual coercion and physical assault with injury across severity;f
= psychological aggression, physical assault and sexual coercion across severity;g
Table 3 Variables associated with IPV by type among women during the 12 months prior to the survey
Dependent variables Psychological aggressionm Physical assaultm Sexual coercionm Physical assault with injurym
N = 1040 N = 1265 N = 1271 N = 1258
OR 95% CI OR 95% CI OR 95% CI OR 95% CI Independent variables
Demographics/socio-economics (Block 1)
Marital statusa
Married/cohabitant 1.28 (0.82–2.01) 1.19 (0.77–1.85) 0.80 (0.55–1.15) 1.07 (0.66–1.72)
Divorced/Separated 0.34 (0.17–0.69) 0.99 (0.45–2.17) 0.40 (0.22–0.71) 1.88 (0.92–3.82)
Widow 0.65 (0.28–1.51) 1.52 (0.61–3.82) 0.46 (0.21–1.03) 0.85 (0.33–2.17)
Singlec 1 1 1 1
Children at homea NA1 NA1 NA1
Yes 2.69 (1.51–4.79)
Noc 1
Housinga NA1 NA1 NA1
Non-conventionald 1.12 (0.58–2.16)
Conventionalc, e 1
Educationa NA1 NA1 NA1
Lowf 2.32 (0.92–5.83)
Middleg 3.17 (1.31–7.64)
Highh 3.33 (1.27–8.73)
Cannot read/writec 1
Occupational statusa NA1 NA1 NA1
Blue-collar worker 0.82 (0.14–4.75)
Low white-collar worker 0.66 (0.09–4.86)
Inter/high white-collar worker 0.94 (0.14–6.23)
Student/otherc 1
Socio-economic statusa NA1 NA1 NA1
Work for othersi 0.60 (0.11
–3.28)
Liberal/own businessj 0.85 (0.15–4.78)
Domestic/otherk 1.70 (0.32–9.11)
Studentc 1
Salary/financial resourcesa NA1 NA1 NA1
Yes 1.70 (0.92–3.16)
Noc 1
Financial straina NA1 NA1 NA1
Yes 1.44 (0.83–2.49)
Noc 1
R2 n (7.1) (2.1) (3.4) (7.5)
Life-style
(Block 2)
BMIb NA1 NA1 NA1 1.01 (0.97 1.06)
Drinkinga
Yes 0.89 (0.60–1.33) 0.93 (0.62–1.40) 1.33 (0.95–1.87) 0.73 (0.49–1.10)
Table 3 Variables associated with IPV by type among women during the 12 months prior to the survey(Continued)
Smokinga NA1 NA1
Yes 1.43 (0.65–3.14) 2.22 (0.92–5.33)
Noc 1 1
R2 n (0.08) (1) (2.1) (2.3)
Controlling behaviours over partner (Block 3)
Controlb 1.03 (1.01–1.05) 1.00 (0.98–1.02) 1.02 (1.00–1.03) 1.00 (0.98–1.02)
R2 n (12.8) (16.2) (15) (12.6)
Controlling behaviours by partner (Block 4)
Controlb 0.98 (0.97
–0.99) 1.03 (1.02–1.04) 1.00 (0.99–1.01) 1.04 (1.03–1.05)
R2 n (0.05) (4.1) (1) (6.6)
Perpetration
(Block 5)
Psychological aggressiona NA1
Yes 4.04 (2.22–7.33) 1.89 (1.10–3.27) 1.95 (0.86–4.42)
Noc 1 1 1
Physical assaulta NA1
Yes 2.40 (1.22–4.74) 1.31 (0.88–1.94) 1.39 (0.89–2.16)
Noc 1 1 1
Sexual coerciona NA1
Yes 0.95 (0.53–1.71) 0.93 (0.57–1.52) 1.95 (1.22–3.11)
Noc 1 1
Physical assault with injurya NA1
Yes 0.89 (0.33–2.40) 3.56 (1.55–8.15) 2.02 (1.22–3.32)
Noc 1 1 1
R2 n (29.8) (42.5) (31.5) (25.3)
Victimization (Block 6)
Psychological aggressiona NA1
Yes 8.37 (4.36–16.06) 5.80 (3.24–10.39) 2.81 (1.08–7.35)
Noc 1 1 1
Physical assaulta NA1
Yes 13.63 (1.65–24.29) 3.71 (2.41–5.70) 10.61 (5.21–21.61)
Noc 1 1 1
Sexual coerciona NA1
Yes 8.23 (4.69–14.44) 4.33 (2.70–6.95) 1.14 (0.68–1.93)
Noc 1 1 1
Physical assault with injurya NA1
Yes 4.25 (2.01–8.98) 7.54 (4.21–13.53) 1.11 (0.72–1.71)
Noc 1 1 1
R2 n (19.9) (9.2) (6.5) (6.2)
Abuse as a child (Block 7)
Psychological abusea
Yes 1.40 (0.51–3.84) 0.94 (0.40–2.24) 1.56 (0.68–3.57) 0.42 (0.18–1.02)
those who did not perpetrate abuse. In addition, women who experienced co-occurring victimization [psycho-logical aggression & physical assault with injury (OR = 2.81; 95% CI = 1.08-7.35), and physical assault & physical assault with injury (OR = 10.61; 95% CI = 5.21-21.61) compared to those who did not experience co-occurring victimization.
Discussion
This study of women who contacted the Forensic Ser-vices at the Maputo Central Hospital for abuse assessed women’s experiences of IPV by type during the preced-ing 12 months, examined the association between IPV types and predictor variables.
Occurrence, chronicity and severity of IPV
This cross-sectional study showed that majority (70.2%, chronicity, 85.8 ± 120.9) of the women had experienced one or more IPV types during the past 12 months, of which more than half the number (55.3%, chronicity, 33.4 ± 58.3) of cases were severe acts., The overall figures in this study were higher than those reported in SSA and elsewhere with different population samples, which varies between 2 - 51% [1,2,4-7,14,38,39]. Variation in the operationalization of IPV, collecting data procedures and characteristics of the samples may explain differ-ences in abuse rates. The chronicity and severity findings in our study are not comparable with those of other studies, given that such data are either not provided or are reported differently.
The most common form of IPV was psychological ag-gression, 65.3%; chronicity, 35.3 ± 45.5), with severe acts amounting to 45.9% (chronicity, 11.4 ± 19.8). Our find-ings are higher than those observed in SSA and else-where with various types of populations, which range from 18.2–51% [6,10,13,14,38,40], and slightly lower
than those reported in a Russian study with female students using the same operational definition of psy-chological aggression (66.7%) [41]. The chronicity and severity rates in the present study are however higher than those reported in this Russian study using the same operational definitions (4.3%; mean chronicity of 13) [41]. These differences may be related to these factors being more common/salient in women seeking help for abuse by partner than amongst students.
Our finding that physical assault was experienced by 54.3% (chronicity, 27.7 ± 51.5) of the women, with 44% (chronicity, 12.8 ± 26.9) being severe acts, are greater than those shown in SSA and elsewhere (5–38%) [1,6,9,14,38,41,42], and in a study from Mozambique (11%) [25] that addressed a limited number of acts of physical assault. In contrast, a study of physical assault in Canada showed higher rates of physical assault than those reported by women in the present study (67% and 68% of women were exposed to minor and severe physical assault, respectively) [43]. Discrepancies in abuse rates could reflect differences in the operational definition of physical assault, types of participants and how the data are collected, although the figures from Canada suggest that factors other than sample charac-teristics and culture may be more important, requiring further investigation.
Sexual coercion was reported by 50.9% (chronicity, 16.3 ± 28.3) of the women, and 29.2% (chronicity, 6.1 ± 15.1) were severe acts. Our figures are higher than those observed in Sub-Saharan Africa and elsewhere among different samples, which range from 5.2–44.4% [5-7,9,11,38,41,42,44]. In this study the willingness of our respondents to disclose their experiences of sexual abuse may explain differences in rates
Physical assault with injury was reported by 34.4% (chronicity, 6.4 ± 15.4) of the women, and 26.3%
Table 3 Variables associated with IPV by type among women during the 12 months prior to the survey(Continued)
Physical abusea
Yes 1.51 (1.01–2.25) 0.91 (0.60–1.36) 0.92 (0.65–1.28) 0.69 (0.46–1.04)
Noc 1 1 1 1
Sexual abusea
Yes 0.84 (0.30–2.34) 0.59 (0.22–1.64) 1.54 (0.66–3.57) 2.28 (0.99–5.21)
Noc 1 1 1 1
Injurya
Yes 0.53 (0.22–1.27) 1.29 (0.58–2.88) 1.71 (0.86–3.41) 1.57 (0.80–3.07)
Noc 1 1 1 1
R2 n (0.03) (0.01) (0.03) (0.09)
Total R2 (69.76) (75.11) (59.53) (60.59)
a
= category variables;b
= continuous variables;c
= comparison categories;d
= e.g. own/rent housing in local materials such as wood;e
= e.g. own/rent housing in cement;f
= primary school/similar.
g
= secondary school/similar;h
= university/similar;i
= e.g. clerks;j
= e.g. accountants;k
= at home/unemployed;l
= NA, non-applicable;m
(chronicity, 3.1 ± 9.1) were severe acts. Our rates are consistent with those of previous observations, although in some cases in the upper range, in SSA and elsewhere (e.g. Canada) with different samples (e.g. community), which vary between 9 - 45.9% [8,10,43], suggesting that the sample type may not have a major importance in the occurrence of physical assault with injury. Similarly to the other forms of abuse, our results concerning the chronicity and severity of injuries may be difficult to compare with those of other studies due to a lack of such data or shown differently (e.g. chronicity, 0 times, 1–2 times, 3–5 times, >5 times). However, our figures are greater than those shown in a Russian study with fe-male students using the same operational definition of chronicity and severity (7.7% were severe acts at a mean chronicity of 1.2) [41].
Co-occurrence and chronicity of IPV
Co-occurring victimization across severity was common, with 26.8% (chronicity, 55.3 ± 117.6) of the women ex-periencing all IPV types. The rates of victimisation regarding the other composite forms of IPV across severity (4 combinations with 3 types in each) varied between 27.1 42.6% and chronicity between 35.7 ± 80.3 -64.9 ± 110.9, depending on the combination. The combin-ation psychological aggression, physical assault and phys-ical assault with injury had the highest figures contrasted to the other combinations. In this study rates of co-occurring IPV, in case combinations are similar, compared to those reported in Sub-Saharan Africa and elsewhere are higher [5,38] and lower [45,46]. For example, in a review of IPV in 7 African countries among general population samples (Cameron, Kenya, Malawi, Rwanda, Uganda, Zambia, and Zimbabwe), the rates of co-occurring emo-tional aggression, physical assault and sexual coercion var-ied between 3.6-8.3% [4], whereas our rate was 27.4%. On the other hand, a study from Japan with a sample of con-venience reported a much higher figure for the emotional aggression, physical assault and sexual coercion con-stellation, i.e. 57% [46]. The differences in the findings concerning women´s experience of all IPV types are not comparable to those of other studies, reasons most likely being methodological as well as differences in social con-text. Our figures on the chronicity and severity of the composite abuse are difficult to contrast with those of other studies as they either do not present such data or re-port differently (e.g. chronicity, never to all the time). Dis-crepancies in the co-occurring abuse rates may be due to several factors such as differences in how co-occurring abuse is combined, the operational definition of IPV and the characteristics of the samples. Culture may not be an important factor in the co-occurrence of IPV as exempli-fied by our findings and those of the Japanese study [46]. In any case, we are facing a group of women with multiple
and frequent experiences of IPV. We posit that the higher prevalence of IPV found among women in our study may reflect higher disclosure facilitated by the use of the ascer-tainment tools–the CTS2 and the CBS-R in this study, which aided in the facilitation of women’s interpreta-tions of these abusive acts, thereby increasing disclos-ure of abuse.
The rates of IPV in this study tend to surpass those observed in other studies with different populations (e.g. women attending antenatal clinics), including studies from Sub-Saharan Africa, although there are exceptions con-cerning physical assault and physical assault with injury. Indeed, in some cases our rates of physical assault and physical assault with injury are lower than those reported in general population samples. In several instances, differ-ences in abuse rates may be partly explained by discrepan-cies in the operational definition of IPV (as evidenced by the increased disclosure when using ascertainment tools in this case of this study), the number of violence items assessed and the population characteristics (women who sought help for IPV experiences). However, the issue of culture was not addressed here. Other explanations (as shown in the regressions) could be that the women were also abusive. Reciprocal abuse was common and control-ling behaviours was an important component in the abuse. The data on the chronicity and severity of abuse are difficult to compare with other observations due to a lack of such information or reported differently, but our figures were higher than those shown in a study using the same operational definition of IPV, chron-icity and severity. In any case, our findings point for instance to the necessity of using the same oper-ational definition of IPV, chronicity and severity when doing research about abuse against women as well as the need of further research across cultures and types of respondents.
Differences in demographics/socio-economics/life-style and correlates of IPV
sexual coercion and physical assault with injury are in line with those from previous studies [8,12,26]. This may be attributed to alcohol consumption and intoxication leading to irresponsible behaviour, thus increasing the likelihood of violence.
Results of the logistic regression analyses revealed that of the demographic, socio-economic and life-style variables, only middle/high education levels, divorce/ separation and having children at home were independ-ently associated with experienced IPV, in addition to con-trolling behaviours over/by partners, own perpetration, co-occurring victimization and abuse as a child.
The finding that higher educational levels were posi-tively associated with exposure to psychological aggression may be associated with the notion that in Mozambique, the empowerment conferred by better education may have been insufficient to counteract traditional gender roles; ra-ther, women’s higher education tends be associated with increased vulnerability to violence. It is also possible that the more educated and empowered the women were, the more assertive they became about their rights, being less inclined to accept traditional cultural and gender roles in which women are expected to be submissive to men, thus triggering abuse. Our results are in contrast with studies in SSA and elsewhere (e.g. USA), which report no effects of education on IPV/reduced IPV risk among high edu-cated women [13,38,44,47-49] or an increased IPV risk among low educated women [8,50,51].
Divorce/separation was negatively associated with experienced psychological aggression/sexual coercion in this study. One could hypothesize that by terminating the relationship the women reduced the likelihood of further violence, which is in agreement with findings from a study in Malawi with a general population sam-ple indicating that IPV is a contributing factor for di-vorce/separation [13]. Available data on this issue with various types of respondents (e.g. women who had sur-vived an attempted homicide and controls), often about physical assault/sexual coercion, in SSA and elsewhere are otherwise conflicting, with some studies reporting that divorce/separation is connected with increased IPV risk [27,38,48,52-54] and others not finding such con-nections [8,55].
Having children at home was positively associated with the experience of physical assault with injury. Though it is not possible to draw causal inference between number of children at home and the likelihood of abuse due to the cross-sectional design of this study, the absence of an association between age and violence suggests that violence may also have begun before some women have started bearing children, which is consistent with find-ings from other studies [51,55]. This may also be related to the increased economic stress associated with increas-ing number of children, as indicated by other studies
which indicate increased likelihood of domestic violence associated with increasing financial strain [56]. However, caution needs to be exercised when interpreting this finding, given that the relationship may also be recipro-cal in nature i.e. domestic violence may also cause finan-cial problems for victims of domestic violence, thus entrapping them in poverty and an abusive relationship [57]. Studies have also shown that individuals are more reluctant to leave abusive relationships when they have investments such as children in the relationship, emo-tional attachment etc. [58]. Other studies from SSA and elsewhere (e.g. Spain) have produced conflicting results, with some showing positive [42,44,48,50] and some show-ing negative results [49,55].
Controlling behaviours over partners were positively associated with exposure to psychological aggression/ sexual coercion. No previous study in Mozambique has addressed the effect of women’s control over partners on their own victimization. It is possible that in Mozambique, where traditional gender roles seem to remain strong, women’s control over partners is not accepted resulting in increased abuse vulnerability. Other explanations could be that women used control to counter dominant partners, reduce violence, attain something blocked by dominant partners or change the power structure in the relationship, and thereby increased their abuse vulnerability rather than the opposite. In any case, our findings are in line with a study involving physical assault from Ghana with univer-sity students using the same operational definition of con-trolling behaviours [19], which showed that female and male students used a similar frequency of controlling behaviours victimization/perpetration, and that control-ling behaviours“predicted”IPV. Studies from the United Kingdom (UK) with different samples (e.g. battered women) partly using the same operational definition, mostly about physical assault/sexual coercion, have also reported a relation between controlling behaviours and victimization/perpetration among both sexes [31,41,59].
relation to physical assault/sexual coercion in investiga-tions from the UK) with for instance battered women [31,41,59], and in Ghana with university students [19] using partly the same/same operational definition. Our results thus suggest that controlling behaviours may be more significant to the occurrence of victimisation/ perpetration than sample characteristics and culture.
Women’s perpetration of abuse
Women’s abuse of their partners (physical assault, psychological aggression, sexual coercion, physical as-sault with injury) was positively associated with their own victimization (physical assault, psychological ag-gression, sexual coercion, physical assault with injury). As far as we know, our study is the first in SSA (includ-ing Mozambique) to address the influence of women’s perpetration on their own victimization. It is plausible that women’s perpetration of IPV may have been a de-fensive reaction to their partners aggression, retribution to it or as a kind of preventive measure to avoid future aggression, but resulted in increased abuse vulnerability. This pattern however indicates that the women may have been involved in relationships where mutual ag-gression may be common. Our results are in line, for ex-ample, with studies of women selected to represent victims of male IPV from USA, mostly about physical as-sault, reporting that women use violence against their male partners [31,61]. While some authors suggested that women’s partner violence happens as a reaction/de-fence to men’s violence [62-64], others have observed that where one partner is the sole perpetrator, it is not uncommon for this individual to be a woman than a man [65], with higher incidence in younger women [59]. Interestingly, various studies from SSA with different types of respondents (e.g. outpatients presenting to prenatal and paediatric clinics), mostly about physical as-sault/sexual coercion, have reported that women may also initiate and abuse their male partners [10,12-15,26,28].
We found that the different IPV types tended to co-occur. Whether one form of IPV is triggering off to an-other or occurred more or less simultaneously was not ascertained, but the women were involved in highly violent relationships. While it is unclear why women endured such relationships, we postulate that part of the explanation may be denial, fear, self-blame, lack of sup-port and/or inability to challenge the cultural norms that may tolerate violence against women [34]. Apparently, as indicated by the regressions, socio-economic condi-tions and life-style did not play a major role. On the other hand, women also used IPV suggesting some de-gree of mutuality in their violent relationships. In any case, our data are in line with other observations from Sub-Saharan Africa and elsewhere (e.g. USA) with
different samples (e.g. help seeking women) showing that different IPV forms often co-occur [1,2,5,38,55].
Of all types of victimization during childhood, only physical abuse was positively associated with exposure to IPV during adulthood i.e. psychological aggression. This is in line with findings from other studies with various samples that show a higher risk of IPV during adulthood among victims of child abuse [8,24,66-69], and may be attributed to the acceptance of violence as a norm among women who were abused in childhood. The women would have learned to conform to societal views of power imbalances within relationships, and are prone to increased likelihood of exposure to violence in intim-ate relationship. The women could also have a tendency to select partners that are consistent with the distorted views within the context in which they live.
Strengths and limitations
Conclusions
The chronicity and frequency of severe sustained IPV among women in our sample as well as the amount of co-occurring abuse were remarkable. Controlling beha-viours, own perpetration, co-occurring victimization, and some extent of childhood, having better education and children at home were more important factors in “explaining” experienced IPV than demographic/socio-economic and life styles variables.
The broad and complex spectrum of these women’s problems should be a cause of great concern for many groups (e.g. policy makers, health care provi-ders). Urgent attention is required as their problems are likely to have profound negative consequences for themselves, others and society. In view of our find-ings, the urgent development of prevention and treat-ment interventions is necessary. Such approaches should not only consider the women’s problems, but also both partners’ conflict-related behaviours. Add-itionally, considering the complexity of the problems that these women and their partners seem to face, interventions are likely to require for instance differ-ent approaches and varying time frames, and con-ducted by various types of professionals. Finally, more research into; for example, the influence of women’s use of control and perpetration on their victimisation is warrant, not least in a Sub-Saharan context.
Policy implications and recommendations
Findings in this study have policy implications, among which are that the findings might be useful for changing advocacy and legal guidelines concerning IPV, might be valuable for the development of prevention and conduct interventions that consider both partners conflict-related behaviours, and might encourage further research regarding, for instance the association between women’s use of control, violence and co-occurring violence upon partners and own perpetration, not least in the context of Sub-Saharan Africa.
Endnotes a
In all cases of chronicity, mean/SD b
The CTS2 are scored by adding the midpoints of the response categories. For the categories 0, 1 and 2 the midpoints are the same. For category 3 (3–5 times) the midpoint is 4; for category 4 (6–10 times) the midpoint is 8; for category 5 (11–20 times) the midpoint is 15; and for category 6 (>20 times) the midpoint is 25.
c
If you have been physically assaulted by your partner or you physically assaulted your partner, who did it first. Your partner assaulted you first, you assaulted your part-ner first or it never happened.
d
The“scaling”was based on CTS2.
e
Due to multicollinearity, abuse as a perpetrator (e.g. physical assault) was not used as an independent factor for physical assault as a victim and so forth. The same procedure was used for women as perpetrators.
f
In all cases of chronicity, mean/SD.
Competing interest
The authors declare that they have no competing interest.
Authors’contributions
AEZ: Major role in study conception and coordination, collected data, performed statistical analysis and writing the manuscript. GM: participated in discussion and manuscript writing. LS: participated in discussion and manuscript writing. JJFS: participated in the design of the study, statistical analysis and manuscript writing. DA: participated in discussion, coordination and manuscript writing. All authors read and approved the final manuscript.
Author details
1Department of Public Health Sciences, Division of Social Medicine,
Karolinska Institutet, Stockholm SE-17176, Sweden.2Eduardo Mondlane University, Faculty of Medicine, Maputo City, Mozambique.3Department of Occupational and Public Health Sciences, University of Gävle, Gävle, Sweden. 4Department of Health Sciences, Division of Public Health Sciences, Mid
Sweden University, Sundsvall, Sweden.5Center for Global & Population Health, The Angels Trust Nigeria, Abuja, Nigeria.
Received: 11 November 2011 Accepted: 6 December 2012 Published: 14 December 2012
References
1. World Health Organization:World report on violence and health. Geneva: WHO; 2002.
2. World Health Organization:WHO multi-country study on women’s health and domestic violence against women: Initial results on prevalence, health and outcomes and women’s responses. Geneva: WHO; 2005.
3. Saltzman LE, Fanslow JL, McMahon PM, Shelley GA:Intimate partner violence surveillance: uniform definitions and recommended data elements, version 1.0. Atlanta (GA): Centers for Disease Control and Prevention, National Center for Injury Prevention and Control; 2002.
4. Amokohene MI:Violence against women in Ghana: a look at women’s perceptions and review of policy and social responses.Soc Sci Med2004,
59:2373–85.
5. Borwankar R, Diallo R, Sommerfelt AE:Gender based Violence in Sub-Saharan Africa: A review of Demographic and Health Survey findings and their use in National Planning. Washington DC: USAID/AFR/SD and Africa’s Health in 2010/AED; 2008.
6. Dunkle KL, Jewkes RK, Brown HC, Yoshihama M, Gray GE, McIntyre JA, Harlow SD:Prevalence and partners of gender-based violence and revictimization among women attending antenatal clinics in Soweto. South Africa. Am J Epidemiol2004,160:230–9.
7. Jewkes R, Penn-Kekana L, Levin J, Ratsaka M, Schrieber M:The prevalence of physical, sexual and emotional violence against women in three South Africa Provinces.SAMJ2001,91:421–28.
8. Jewkes R, Levi J, Penn-Kekana L:Risk factors for domestic violence: finding from a South African cross-sectional study.Soc Sci Med2002,55:1603–17. 9. Karamagi CAS, Tumwine JK, Tylleskar T, Heggenhougen K:Intimate partner
violence against women in eastern Uganda: implications for HIV prevention.BMC Public Health2006,6:1–12.
10. Khasakhala-Mwenesi B, Buluma RCB, Kong’ani RU, Nyarunda VM:Gender violence. Kenya Demographic and Health Survey 2003. Central Bureau of Statistics (CBS) [Kenya], Ministry of Health (MOH) [Kenya], and ORC Macro. Calverton, Maryland: CBS, MOH, and ORC Macro; 2004.
11. Koenig MA, Lutalo T, Zhao F, Nalugoda F, Kiwanuka N, Wabwire-Mangen F,
et al:Coercive sex in rural Uganda: prevalence and risk factors.Soc Sci Med2004,58:787–98.
12. Koenig MA, Lutalo T, Zhao F, Nalugoda F, Wabwire-Mangen F, Kiwanuka N,
13. Chakwana CD:Domestic violence. National Statistical Office (NSO) [Malawi], and ORC Macro. Malawi Demographic and Health Survey 2004. Calverton, Maryland: NSO and ORC Macro; 2005.
14. Ghana Statistical Service (GSS), Ghana Health Service (GHS) and ICF Macro:
Ghana Demographic and Health Survey 2008. Accra, Ghana: GSS, GHS, and ICF Macro; 2009.
15. Central Statistical Office (CSO) [Zimbabwe] and Macro International Inc. Zimbabwe:Demographic and Health Survey 2005–06. Calverton, Maryland: CSO and Macro International Inc; 2007.
16. Dunkle KL, Jewkes RK, Brown HC, Gray GE, McIntryre JA, Harlow SD:
Gender based violence, relationship power, and risk of HIV infection in women attending antenatal clinics in South Africa.Lancet2004,
363:1415–21.
17. Klomengah RY:Intimate partner violence in Zambia: an examination of risk factors and gender perceptions.JCFS2008,4:557–69.
18. Johnson MP:Conflict and control: gender symmetry and asymmetry in domestic violence.Violence Against Women2006,12:1003–08. 19. Próspero P, Dwumah P, Ofori-Dua K:Violent attitudes & mental health
symptoms among mutual violent Ghanaian couples.J Aggress Confl Peace Res2009,1:16–23.
20. Finkehor D:The international epidemiology of child abuse.Child Abuse Negl1994,18:409–17.
21. Lalor K:Child abuse in Tanzania and Kenya.Child Abuse Negl2004,
28:833–44.
22. Lalor K:Child sexual abuse in sub-Saharan Africa: a literature review. Child Abuse Negl2004,28:439–60.
23. McCrann D, Lalor K, Katabaro JK:Childhood sexual abuse among university students in Tanzania.Child Abuse Negl2006,30:1343–51. 24. Ntaganira J, Muula AS, Masaisa F, Dusabeyezu F, Siziya S, Rudatsikira E:
Intimate partner violence among pregnant women in Rwanda.BMC Womens Health2008,8:17–23.
25. Andersson N, Ho-Foster A, Mitchell S, Scheepers E, Goldstein S:Risk factors for domestic physical violence: national cross-sectional household surveys in eight southern Africa countries.BMC Womens Health2007,7:1–13. 26. van der Straten A, King R, Grinstead O, Vittinghoff E, Serufilira A, Allen S:
Sexual coercion, physical violence and HIV infection among women in steady relationships in Kigali Rwanda.AIDS Behav1998,2:61–73. 27. Watts C, Keogh E, Ndlava M, Kwaramba R:Withholding sex and forced sex:
dimensions of violence against Zimbabwean women.Reprod Health Matters1998,12:57–65.
28. Uganda Bureau of Statistics (UBOS) and Macro International Inc:Uganda Demographic and Health Survey 2006. Calverton, Maryland, USA: UBOS and Macro International Inc; 2007.
29. Jethá EA, Lynch CA, Houry DE, Rodrigues MA, Chilundo B, Sasser SM, Wright DW:Characteristic of victims of family violence seeking care at health centers in Maputo Mozambique.J Emerg Trauma Shock2011,
4:369–73.
30. Straus MA, Hamby SL, Boney-McCoy S, Sugarman DB:The revised Conflict Tactics Scales (CTS2): development and preliminary psychometric data. J Fam Issues1996,17:283–316.
31. Graham-Kevan N, Archer J:Intimate terrorism and common couple violence: a test of Johnson’s predictions in four British samples. J Interpers Violence2003,18:1247–70.
32. Graham-Kevan N, Archer J:Investigating three explanations of women’s relationship aggression.Psychol Women Quart2005,29:270–77. 33. Dobash RE, Dobash RP:Violence against wives: a case against the Patriarchy.
New York: Free Press; 1979.
34. Hines DA:Predictors of sexual coercion against women and men: a multilevel, multinational study of university students.Arch Sex Behav
2007,36:403–422.
35. Scott K, Straus MA:Denial, minimization, partner blaming, and intimate aggression in dating partners.J Interpers Violence2007,22:851–871. 36. Yount KM, Li L:Domestic violence and obesity in Egyptian women.
J Biosoc Sci2011,43:85–99.
37. Peng C-H, Lee KL, Ingersool GM:An introduction to logistic regression analysis and reporting.J Educ Res2002,96:3–14.
38. Coker AL, Smith PH, Mckeown R, King MJ:Frequency and correlates of intimate partner violence by type: physical, sexual and psychological battering.Am J Public Health2000,9:553–59.
39. Tjaden P, Thoennes N:“Extent, nature and consequences of intimate partner violence: Findings from the National Violence Against Women Survey”. Atlanta,
GA: National Institute of Justice, Washington, DC; Centers for Disease Control and Prevention; 2000.
40. Pico-Alfonso MA, Garcia-Linares MI, Celda-Navarro N, Blasco-Ros C, Echeburua E, Martinez M:The impact of physical, psychological, and sexual intimate male partner violence on women’s mental health: depressive symptoms, posttraumatic stress disorder, state anxiety, and suicide.J Women’s Health2006,15:599–613.
41. Lysova AV, Douglas EM:Intimate partner violence among male and female Russian university students.J Interpers Violence2008,23:1579–99. 42. Gage AJ:Women’s experience of intimate partner violence in Haiti.Soc
Sci Med2005,61:343–64.
43. Laroche D:Aspects of the context and consequences of Domestic Violence– Situational Couple Violence and Intimate Terrorism in Canada in 1999. Canada: Institute de la Statistique du Quebec; 2005.
44. Okenwa L, Lawoko S, Jansson B:Exposure to intimate partner violence amongst women of reproductive age in Lagos, Nigeria: prevalence and predictors.J Fam Violence2009,24:517–30.
45. Granados Shiroma M:Salud reproductiva y violencia contra la mujer: un análisis desde la perspectiva de género [An analysis of the implications of violence against women on women’s reproductive health]. Mexico: Nuevo León, Asociación Mexicana de Población, Consejo Estatal de Población; 1996.
46. Yoshihama M, Sorenson SB:Physical, sexual, and emotional abuse by male intimates: experiences of women in Japan.Violence Vict1994,9:63–77. 47. Martin SL, Tsui AO, Maitra K, Marinshaw R:Domestic violence in Northern
India.Am J Epidemiol1999,150:417–26.
48. Romans S, Forte T, Cohen MM, Du Mont J, Hyman I:Who is most at risk for intimate partner violence? A Canadian population-based study. J Interpers Violence2007,22:1495–1514.
49. Walton-Moss BJ, Manganello J, Frye V, Campbell JC:Risk factors for intimate partner violence and associated injury among urban women. J Commun Health2005,30:377–89.
50. Vives-Cases C, Alvarez-Dardet C, Gil-Gonzalez D, Torrubiano-Dominguez J, Rohlfs I, Escriba-Aguir V:Sociodemographic profile of women affected by intimate partner violence in Spain.Gaz Sanit2009,23:410–14.
51. McCloskey LA, Williams C, Larsen U:Gender inequality and intimate partner violence among women in Moshi Tanzania.Int Fam Plan Perspect
2005,31:124–130.
52. Bachman R, Saltzman L:Violence against women: Estimates from the redesigned survey (No. NCJ-154348). Washington, DC: U.S. Department of Justice, Bureau of Justice Statistics; 1995.
53. Ruiz-Perez I, Plazaola-Castano J, del Rio-Lozano M,et al:How do women in Spain deal with an abusive relationship?J Epidemiol Community Health
2006,60:706–11.
54. Vest RJ, Catlin TK, Chen JJ, Brownson RC:Multistate analysis of factors associated with intimate partner violence.Am J Prev Med2002,22:156–64. 55. Ellsberg MC, Peña R, Herrera A, Lijestrand J, Winkvist A:Wife abuse among
women of childbearing age in Nicaragua.Am J Public Health1999,
89:241–4.
56. Benson ML, Fox GL:When violence hits home: How economics and neighborhood play a role. Washington, DC: U.S. Department of Justice, National Institute of Justice; 2004.
57. Renzetti CM:Economic Stress and Domestic Violence. Harrisburg, PA: VAWnet, a project of the National Resource Center on Domestic Violence; 2009. Retrieved May/5/2012, from: http://www.vawnet.org.
58. Johnson IM:Economic, situational, and psychological correlates of the decision-making process of battered women.Fam Soc1992,23:168–176. 59. Capaldi DM, Kim HK, Shortt JW:Observed initiation and reciprocity of
physical aggression in young, at-risk couples.J Fam Violence2007,
22:101–11.
60. Machel JZ:Unsafe sexual behaviour among schoolgirls in Mozambique: a matter of gender and class.Reprod Health Matters2001,9:82–90. 61. Giles-Sims J:Wife battering: A systems theory approach. New York: Guilford
Press; 1983.
62. Dobash RP, Dobash RE, Wilson M, Daly M:The myth of sexual symmetry in marital violence.Soc Problems1992,39:71–91.
63. Hendy HM, Weiner K, Bakerofskie J, Eggen D, Gustitus C, McLeod KC:
Comparison of six models for violent romantic relationships in college men and women.J Interpers Violence2003,18:645–65.
65. Archer J:Sex differences in aggression between heterosexual partners: a meta-analytic review.Psychol Bull2000,126:651–680.
66. Carlson BE, McNutt LA, Choi DY:Childhood and adult abuse in primary health care: effects on mental health.J Interpers Violence2003,
18:924–41.
67. Desai S, Arias I, Thompson MP, Basile KC:Childhood victimization and subsequent adult revictimization assessed in a nationally representative sample of women and men.Violence Vict2002,17:639–53.
68. Roodman AA, Clum GA:Revictimization rates and method variance: a meta-analysis.Clin Psychol Rev2002,21:183–204.
69. Whitfield L, Anda RF, Dube SR, Felitti V:Violent childhood experiences and the risk of intimate partner violence in adults: assessment in a large health organization.J Interpers Violence2003,18:166–85.
doi:10.1186/1472-698X-12-35
Cite this article as:Zacariaset al.:Intimate partner violence against
women in Maputo city, Mozambique.BMC International Health and
Human Rights201212:35.
Submit your next manuscript to BioMed Central and take full advantage of:
• Convenient online submission
• Thorough peer review
• No space constraints or color figure charges
• Immediate publication on acceptance
• Inclusion in PubMed, CAS, Scopus and Google Scholar
• Research which is freely available for redistribution