R E S E A R C H A R T I C L E
Open Access
A validated natural language processing
algorithm for brain imaging phenotypes
from radiology reports in UK electronic
health records
Emily Wheater
1, Grant Mair
1, Cathie Sudlow
1,2,3, Beatrice Alex
4,5, Claire Grover
4,5and William Whiteley
1,6*Abstract
Background:Manual coding of phenotypes in brain radiology reports is time consuming. We developed a natural language processing (NLP) algorithm to enable automatic identification of brain imaging in radiology reports performed in routine clinical practice in the UK National Health Service (NHS).
Methods:We used anonymized text brain imaging reports from a cohort study of stroke/TIA patients and from a regional hospital to develop and test an NLP algorithm. Two experts marked up text in 1692 reports for 24 cerebrovascular and other neurological phenotypes. We developed and tested a rule-based NLP algorithm first within the cohort study, and further evaluated it in the reports from the regional hospital.
Results:The agreement between expert readers was excellent (Cohen’sκ=0.93) in both datasets. In the final test dataset (n= 700) in unseen regional hospital reports, the algorithm had very good performance for a report of any ischaemic stroke [sensitivity 89% (95% CI:81–94); positive predictive value (PPV) 85% (76–90); specificity 100% (95% CI:0.99–1.00)]; any haemorrhagic stroke [sensitivity 96% (95% CI: 80–99), PPV 72% (95% CI:55–84); specificity 100% (95% CI:0.99–1.00)]; brain tumours [sensitivity 96% (CI:87–99); PPV 84% (73–91); specificity: 100% (95% CI:0.99–1.00)] and cerebral small vessel disease and cerebral atrophy (sensitivity, PPV and specificity all > 97%). We obtained few reports of subarachnoid haemorrhage, microbleeds or subdural haematomas. In 110,695 reports from NHS Tayside, atrophy (n= 28,757, 26%), small vessel disease (15,015, 14%) and old, deep ischaemic strokes (10,636, 10%) were the commonest findings.
Conclusions:An NLP algorithm can be developed in UK NHS radiology records to allow identification of cohorts of patients with important brain imaging phenotypes at a scale that would otherwise not be possible.
Keywords:Radiology, Natural language processing, Brain imaging, Phenotyping, Radiology reports, Stroke
Key messages
Brain imaging is expensive to perform at scale for research purposes, and automated reading of base images is yet to be developed for most important disease phenotypes. Therefore reading of brain imaging text reports at scale would be useful for research and clinical purposes.
We developed a natural language processing (NLP) algorithm to identify 24 brain imaging phenotypes in two areas of NHS Scotland which had excellent positive predictive value for cerebrovascular and neurodegenerative phenotypes.
Use of radiologists’reports of brain imaging in clinical practice can be useful for cohort development and outcome ascertainment of neurological phenotypes.
Background
Brain imaging with computerized tomography (CT) and magnetic resonance imaging (MRI) can identify biomarkers
© The Author(s). 2019Open AccessThis article is distributed under the terms of the Creative Commons Attribution 4.0 International License (http://creativecommons.org/licenses/by/4.0/), which permits unrestricted use, distribution, and reproduction in any medium, provided you give appropriate credit to the original author(s) and the source, provide a link to the Creative Commons license, and indicate if changes were made. The Creative Commons Public Domain Dedication waiver (http://creativecommons.org/publicdomain/zero/1.0/) applies to the data made available in this article, unless otherwise stated.
* Correspondence:[email protected]
1Centre for Clinical Brain Sciences, University of Edinburgh, Edinburgh, UK 6Nuffield Department of Population Health, University of Oxford, Oxford, UK
of brain pathology that are important for the accurate diag-nosis and phenotyping of many neurological diseases. How-ever, brain imaging is expensive, and there are practical constraints to its use for research purposes, particularly in elderly and frail populations. Brain imaging reported by ex-pert radiologists is nevertheless performed very frequently in clinical practice: in NHS England, for example, ~ 700,000 brain MRIs were performed between 2016 and 2017 [1]. Therefore, the reports of brain imaging could aid pheno-type definition at lower costs, and be used for large-scale epidemiological studies of volunteers (e.g. UK Biobank) [2], cohorts of patients with disease, cataloguing clinical images, and for system-wide health care quality improvement.
In clinical practice, a radiologist reads a brain image and produces a text report of the findings. However, it is difficult to use these text reports in large scale research studies, because manually coding many thousands of re-ports is time consuming, and subject to inter- and intra-annotator variation [3]. Many radiology reports are un-structured, despite initiatives to improve this by the Radiological Society of America and other organizations, and therefore are difficult to use with the simplest auto-mated methods of text searching.
One solution is to use natural language processing (NLP) methods to extract information from unstruc-tured text in a radiology report. NLP algorithms can be constructed to identify clinically relevant phenotypes within text and to determine the grammatical relation-ship between different phrases. Rule-based NLP algo-rithms can have a high sensitivity (i.e. identify a high proportion of true cases) and high positive predictive value (i.e. a high proportion of those identified are true cases) in clinical records, for example identifying appen-dicitis, acute lung injury and cancer for use in cohort building, query based case retrieval and quality assess-ment of neurological practice [4]. For example a US-based study from Partner’s Healthcare identified ~ 6000 cases of cerebral aneurysms and ~ 6000 matched con-trols with a penalized logistic regression NLP model using radiology reports and other text and routine cod-ing, giving a positive predictive value of 91% for the presence of aneurysms [5]. For the identification of stroke phenotypes, a study of 400 reports from the Mayo Clinic and Tufts Medical Center demonstrated that a rule-based NLP system had an excellent positive predict-ive value (1.0) for the identification of ‘silent brain in-farcts’ and a convolutional neural network had an excellent positive predictive value (0.99) for the identifi-cation of white matter disease [6].
We aimed to develop and test an NLP algorithm to ex-tract brain phenotypes from CT and MR brain radiology reports in NHS Scotland. We developed a list of brain phenotypes, primarily related to cerebrovascular disease that could be extracted from reports; determined ground
truth in each report by expert review of the text; and de-veloped and validated an NLP algorithm in two different datasets from different regions of NHS Scotland.
Methods
The datasets used to create the algorithm are available, sub-ject to potential users obtaining the necessary ethical, re-search and data governance approvals, from Edinburgh Stroke Study (www.dcn.ed.ac.uk/ess) and Health Informatics Centre Services, Dundee (www.dundee.ac.uk/hic/hicservices).
Datasets
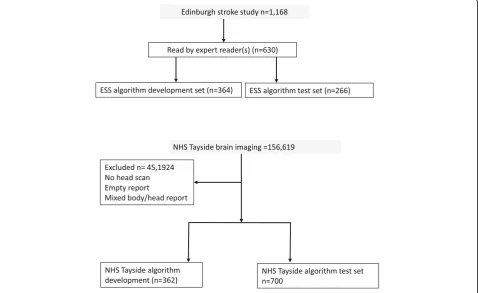
We used two sources of radiology reports to develop and test our automated reading and labelling algorithm: (i) all the brain imaging reports between 2002 and 2014 of participants in the Edinburgh Stroke Study (ESS), a hospital based register of 2160 stroke and transient is-chaemic attack (TIA) patients [7] (of whom 1168 could be linked to local radiology reports) and (ii) MR and CT brain reports from NHS Tayside (a different NHS health board within Scotland) performed in unselected in- and out-patients between December 1994 and January 2015 (n= 156,619). We received reports stripped of identifiers. We excluded reports of non-brain imaging that were of mixed brain and other body areas, or did not contain a complete radiologist’s report.
We divided each set of reports into datasets for algo-rithm development (dev) and algoalgo-rithm validation (test). The ESS data as we received it appeared to be random-ized. We reserved the first 500 reports as development data, of which 364 were manually annotated. The remaining 668 reports were further randomized and, of these, 266 were manually annotated to make a test data-set. The Tayside data contained 156,619 reports and we first split this into four equal parts. We used the first part to create manually annotated development data (362 reports) and a randomised version of the fourth part to create manually annotated test data (700 reports). The Tayside data contained a high proportion of ‘ nor-mal’reports, so to enrich it for pathological findings, we used a regular expression search (“ blood|bleed|haemor|-hemor”) to select reports for the development set. We did not do this for the Tayside test data in order to en-sure that it was truly random (of the 700 test reports, only 295 matched the above regular expression).
Phenotypes of interest, ground truth and agreement between expert readers
reports: stroke (haemorrhagic vs ischaemic vs under-specified, deep vs cortical, recent vs old); atrophy (present vs absent); changes of small vessel disease (present vs absent); brain tumours (meningioma, gli-oma, metastasis, other); subdural hematoma (present vs absent); subarachnoid haemorrhage (aneurysmal or other); microbleeds (deep vs lobar vs unspecified); haemorrhagic transformation of infarct (present vs ab-sent. We combined these annotations into 24 clinic-ally meaningful phenotypes (e.g. old deep ischaemic stroke, recent cortical stroke etc., see Table 1), which the expert readers also identified for each report as
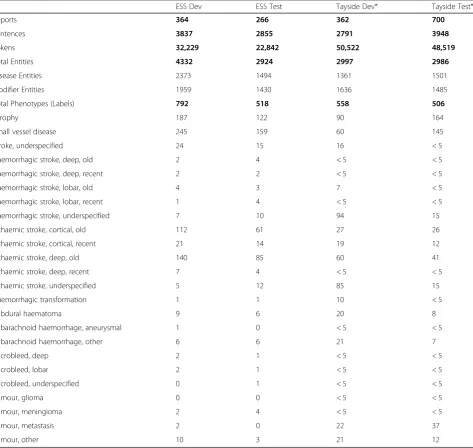
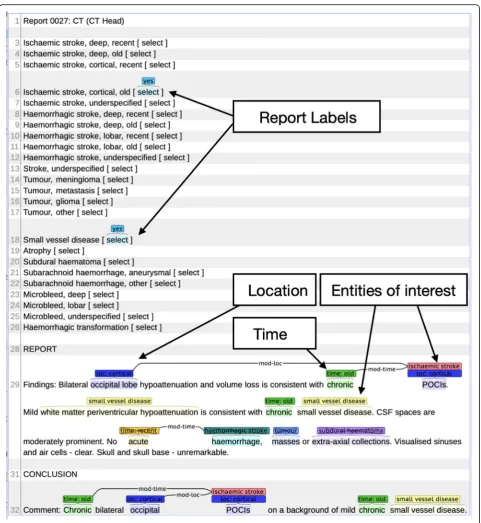
annotations on the document level. Stroke types were defined as ‘underspecified’ when it was not possible to assign a location, age or stroke type. Table 1 lists the number of reports, sentences, tokens and annota-tions for each of the datasets and partiannota-tions and also provides detailed counts for each phenotype per parti-tion. An example of an annotated and synthetic but realistic brain imaging report with entity and label (phenotype) annotation displayed via the Brat annota-tion tool is shown in Fig. 1. A report can be labelled with zero or more phenotypes (min = 0, max = 7, aver-age = 1.4). In the chosen example the report is
Table 1Dataset statistics: number of reports, sentences, entity, modifier and phenotype (label) annotation per data set (ESS dev/test vs Tayside dev/test) for annotator 1
ESS Dev ESS Test Tayside Dev* Tayside Test*
Reports 364 266 362 700
Sentences 3837 2855 2791 3948
Tokens 32,229 22,842 50,522 48,519
Total Entities 4332 2924 2997 2986
Disease Entities 2373 1494 1361 1501
Modifier Entities 1959 1430 1636 1485
Total Phenotypes (Labels) 792 518 558 506
Atrophy 187 122 90 164
Small vessel disease 245 159 60 145
Stroke, underspecified 24 15 16 < 5
Haemorrhagic stroke, deep, old 2 4 < 5 < 5
Haemorrhagic stroke, deep, recent 2 2 < 5 < 5
Haemorrhagic stroke, lobar, old 4 3 7 < 5
Haemorrhagic stroke, lobar, recent 1 4 < 5 < 5
Haemorrhagic stroke, underspecified 7 10 94 15
Ischaemic stroke, cortical, old 112 61 27 26
Ischaemic stroke, cortical, recent 21 14 19 12
Ischaemic stroke, deep, old 140 85 60 41
Ischaemic stroke, deep, recent 7 4 < 5 < 5
Ischaemic stroke, underspecified 5 12 85 15
Haemorrhagic transformation 1 1 10 < 5
Subdural haematoma 9 6 20 8
Subarachnoid haemorrhage, aneurysmal 1 0 < 5 < 5
Subarachnoid haemorrhage, other 6 6 21 7
Microbleed, deep 2 1 < 5 < 5
Microbleed, lobar 2 1 < 5 < 5
Microbleed, underspecified 0 1 < 5 < 5
Tumour, glioma 0 0 < 5 < 5
Tumour, meningioma 2 4 < 5 < 5
Tumour, metastasis 2 0 22 37
Tumour, other 10 3 21 12
labelled with two phenotypes (Ischaemic stroke, cor-tical, old and small vessel disease).
We calculated inter-annotator agreement (IAA) be-tween the two clinician annotators for each of the phenotypes in the ESS test dataset (n = 266) and a subset of the NHS Tayside test dataset (n = 100). We selected a subset of Tayside data for double an-notation because we did not have the resources to
annotate all test reports twice. The double annotated sample was the final 100 of the 700 randomly se-lected test reports. We use precision, recall and F1-score for entity annotation agreement because Cohen’s Kappa has been found to be an inappropri-ate metric for measuring IAA for named entities [9].. We use Cohen’s Kappa for the label (phenotype) an-notations [9].
Natural language processing
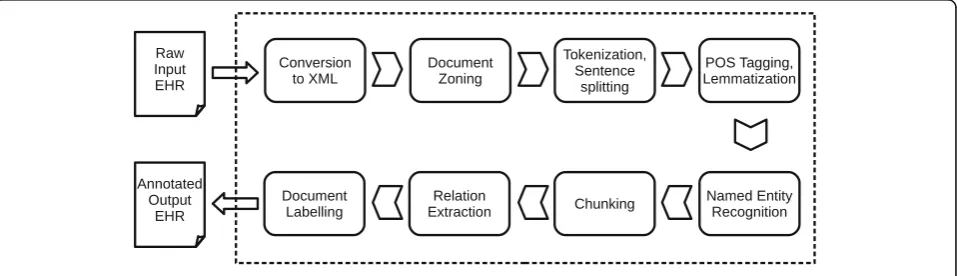
We iteratively developed an NLP system to identify the 24 phenotypes in radiology reports. The NLP system, Edinburgh Information Extraction for Radiology reports (EdIE-R), is a staged pipeline process (see Fig. 2), with XML rule-based text mining software at its core [10]. Scan reports are first converted from text format into XML. Each report is then zoned into relevant sections (request, body of report, conclusions) using regular ex-pressions. The text of the body of each report is then split into paragraphs, sentences and word tokens by a tokenization component. This is followed by part-of-speech (POS) tagging where words are labeled with their syntactic categories using the C&C POS tagger [11] in combination with two models, one trained on newspaper text and one on the Genia biomedical corpus [12]. This is followed by a lemmatization step using morpha [13] to analyze inflected nouns and verbs and determine their canonical form (e.g. bleed for bleed, bled, bleeding and
bleeds). All information computed up to this point is the basis for named entity recognition (NER), negation de-tection and relation extraction. These processes are rule-based and also involve look-up from two manually cre-ated domain lexicons (i.e. dictionaries), developed by ex-pert readers’ mark-up of text. These lexicons total around 400 entries though many of these are near dupli-cates arising from hyphenation and spelling variants (e.g.
‘intracranial’,‘intra-cranial’,‘intra cranial’;‘haemorrhage’,
‘haemorrhage’). The negation detection and relation ex-traction also rely on an additional chunking step which determines noun and verb phrases in the text. Finally, document-level labels on the patient’s type of stroke or other diseases discussed in the report (phenotypes) are assigned based on the entities and relations present in the text. The rules for this step are a simple mapping from the previous layers of mark-up to the labels. For example, to choose a‘small vessel disease’label, the rules need only to check that there is a non-negative small vessel disease entity in either the report or conclusions part of the report. To choose the label‘Ischaemic stroke,
cortical, recent’there needs to be a non-negative ischae-mic stroke entity which is in a location relation with a loc:cortical entity as well as in a time relation with a time:recent entity.
Assessment of performance
We developed EdIE-R first on the ESS development data set and validated the system on separate, novel reports from the ESS validation data set. We then validated the EdIE-R system in the NHS Tayside dataset, and further developed and improved its performance, before validat-ing it again on unselected unseen NHS Tayside and ESS data. The main further developments were additions to the domain lexicons for named entities that had not pre-viously been encountered, extensions of the rules to recognize negative contexts (e.g. ‘Exclude subdural bleed.’) and fine-tuning of the relation extraction rules.
We report the performance of EdIE-R phenotyping of reports against the reference phenotyping standard of clinical expert reading of reports. For each phenotype, we report sensitivity (proportion of true positive reports identified by EdIE-R), specificity (proportion of true negative reports identified by EdIE-R) and positive pre-dictive value (proportion of EdIE-R positive reports that are true positive). For each measure and phenotype, we calculated 95% confidence intervals using the Wilson method, which generates asymmetrical confidence inter-vals suitable for values very close to either 100% or 0% [14]. We also report F1-scores which is the harmonic mean of precision (positive predicted value) and recall (sensitivity) and a standard metric used in NLP research.
Sample size
We based the sample size, n = 700, of the validation of the final version of EdIE-R in the Tayside dataset on a sensitivity of 95% for a phenotype of particular interest, old deep ischaemic stroke, with an estimated prevalence of 12% with a 95% Wilson interval width of 10%. The 700 reports were selected at random from the final
quarter, n= 39,154, of the original Tayside dataset. The development data was selected from the first quarter.
Results
We first developed the EdIE-R algorithm in 364 reports from the ESS dataset, and internally validated it on 266 further reports from the ESS dataset. We externally vali-dated the algorithm on 362 reports from the NHS Tay-side dataset, then further developed the algorithm with different data before a final external validation in 700 re-ports from NHS Tayside (Fig.3).
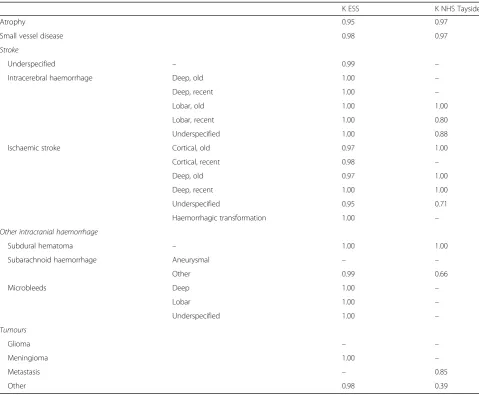
IAA for the entity annotations was high for both sub-sets. In the ESS subset, we found a precision of 0.96, a recall of 0.98 and an F1-score of 0.97. For the Tayside subset, precision was 0.95, recall was 0.96 and F1 was 0.96 [15]. The agreement between the two expert anno-tators for all phenotypes was generally excellent in ESS (all Cohen’sκ> 0.95), less so in NHS Tayside (Cohen’sκ 0.39–1.00, see Table2).
We developed the NLP algorithm using the ESS data-set, which is enriched for cerebrovascular phenotypes. In unseen ESS validation data, the algorithm had an excel-lent specificity (≥99%) for all phenotypes and excellent sensitivity for stroke phenotypes, atrophy and small ves-sel disease (≥95%). However, we identified few cases of
haemorrhagic stroke, subdural or subarachnoid haemor-rhage, or brain tumours.
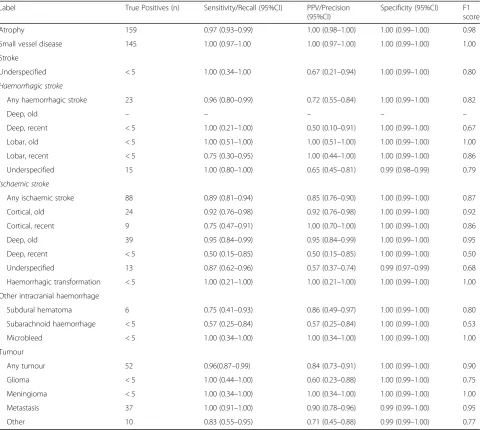
We further developed our model in 362 expert-anno-tated reports in NHS Tayside, and then tested the final EdIE-R model in 700 unselected expert-annotated NHS Tayside reports. The final EdIE-R model had excellent sensitivity, specificity and positive predictive value (all
≥95%) for the following phenotypes: cerebral atrophy, cerebral small vessel disease, and old deep infarcts. The algorithm identified any ischaemic stroke (n= 88) with a sensitivity of 89% (95% CI:81–94), positive predictive value of 85% (76–90) and specificity of 100% (0.99– 1.00); haemorrhagic stroke (n = 23) with a sensitivity of 96% (95% CI: 80–99), positive predictive value of 72% (55–84) and specificity of 100% (0.99–1.00); and any brain tumour with a sensitivity of 96% (95% CI: 87–99), positive predictive value of 84% (73–91) and specificity of 100% (0.99–1.00). For individual stroke and tumour types, the number of patients with any one type was small, and therefore point estimates had wide confidence intervals (see Table3).
We tested the potential of the final EdIE-R algorithm to identify patients with particular brain phenotypes in the routinely acquired brain imaging reports from the Tayside region of Scotland. Of 98,036 patients, there was a preponderance of women (54.7%), particularly in the
youngest (0–50, 54.9%) and oldest (> 75 yrs. 61.7%) age groups. A minority of patients had been admitted or died with stroke within 30 days of the date of scan (over-all 6, 1.5% < 50 yrs., 9.5% > 75 years) (see Table4). In the 110,695 scan reports of these patients, the most frequent phenotypes were cerebral atrophy (26%), cerebral small vessel disease (13.6%), and deep old cerebral infarcts (9.6%) (see Table5).
Discussion
We have developed an NLP algorithm for brain imaging reports in a stroke cohort study in one NHS hospital and validated it with reports from general clinical prac-tice in a second NHS hospital. We have demonstrated excellent diagnostic performance for more common cerebrovascular phenotypes. Although the identification of phenotypes was not perfect, it would have been prac-tically impossible to manually code > 100,000 radiology
reports. The ability to code these reports using an NLP algorithm opens the door to using radiology reports to better identify stroke subtype when combined with ICD-10 coded information for outcome ascertainment in large studies such as UK Biobank, for the creation of new in silico cohort studies, or for health care quality improvement [2].
In most research using electronic health records, phenotypes are identified from administrative coding with multiple or single codes (e.g. ICD-10). These codes and combinations have modest to good positive predictive value (> 80%) for all stroke [16]. The addition of NLP summaries of brain imaging report data to administratively coded information, or to NLP processing of medical text, could improve the positive or negative predictive value of stroke identified in EHR. It would also increase the number of stroke that are unspecified (up to 40%) or where stroke type
Table 2Inter-annotator agreement measured in Cohen’sΚbetween two human annotators in ESS (266 doubly annotated reports) & NHS Tayside (100 doubly annotated reports) for different phenotypes (document-level annotations)
ΚESS ΚNHS Tayside
Atrophy 0.95 0.97
Small vessel disease 0.98 0.97
Stroke
Underspecified – 0.99 –
Intracerebral haemorrhage Deep, old 1.00 –
Deep, recent 1.00 –
Lobar, old 1.00 1.00
Lobar, recent 1.00 0.80
Underspecified 1.00 0.88
Ischaemic stroke Cortical, old 0.97 1.00
Cortical, recent 0.98 –
Deep, old 0.97 1.00
Deep, recent 1.00 1.00
Underspecified 0.95 0.71
Haemorrhagic transformation 1.00 –
Other intracranial haemorrhage
Subdural hematoma – 1.00 1.00
Subarachnoid haemorrhage Aneurysmal – –
Other 0.99 0.66
Microbleeds Deep 1.00 –
Lobar 1.00 –
Underspecified 1.00 –
Tumours
Glioma – –
Meningioma 1.00 –
Metastasis – 0.85
is specified, to allow subtyping of ischaemic stroke types where this is not available (for example in our center, codes for lacunar stroke are rarely used). In addition, some asymptomatic findings that are not routinely coded consist-ently (e.g. changes of cerebral small vessel disease) could be
identified. This could be particularly useful for deriving neurological phenotype at scale from health records in large scale cohorts such as UK Biobank (N > 500,000), [2] and the NIH-funded All of Us study (planned N = 1,000,000
https://allofus.nih.gov).
Table 3EdIE-R performance on the NHS Tayside test set (n = 700 reports). Small numbers suppressed due to data governance requirements
Label True Positives (n) Sensitivity/Recall (95%CI) PPV/Precision (95%CI)
Specificity (95%CI) F1 score
Atrophy 159 0.97 (0.93–0.99) 1.00 (0.98–1.00) 1.00 (0.99–1.00) 0.98
Small vessel disease 145 1.00 (0.97–1.00 1.00 (0.97–1.00) 1.00 (0.99–1.00) 1.00
Stroke
Underspecified < 5 1.00 (0.34–1.00 0.67 (0.21–0.94) 1.00 (0.99–1.00) 0.80 Haemorrhagic stroke
Any haemorrhagic stroke 23 0.96 (0.80–0.99) 0.72 (0.55–0.84) 1.00 (0.99–1.00) 0.82
Deep, old – – – – –
Deep, recent < 5 1.00 (0.21–1.00) 0.50 (0.10–0.91) 1.00 (0.99–1.00) 0.67
Lobar, old < 5 1.00 (0.51–1.00) 1.00 (0.51–1.00) 1.00 (0.99–1.00) 1.00
Lobar, recent < 5 0.75 (0.30–0.95) 1.00 (0.44–1.00) 1.00 (0.99–1.00) 0.86
Underspecified 15 1.00 (0.80–1.00) 0.65 (0.45–0.81) 0.99 (0.98–0.99) 0.79 Ischaemic stroke
Any ischaemic stroke 88 0.89 (0.81–0.94) 0.85 (0.76–0.90) 1.00 (0.99–1.00) 0.87
Cortical, old 24 0.92 (0.76–0.98) 0.92 (0.76–0.98) 1.00 (0.99–1.00) 0.92
Cortical, recent 9 0.75 (0.47–0.91) 1.00 (0.70–1.00) 1.00 (0.99–1.00) 0.86
Deep, old 39 0.95 (0.84–0.99) 0.95 (0.84–0.99) 1.00 (0.99–1.00) 0.95
Deep, recent < 5 0.50 (0.15–0.85) 0.50 (0.15–0.85) 1.00 (0.99–1.00) 0.50
Underspecified 13 0.87 (0.62–0.96) 0.57 (0.37–0.74) 0.99 (0.97–0.99) 0.68
Haemorrhagic transformation < 5 1.00 (0.21–1.00) 1.00 (0.21–1.00) 1.00 (0.99–1.00) 1.00
Other intracranial haemorrhage
Subdural hematoma 6 0.75 (0.41–0.93) 0.86 (0.49–0.97) 1.00 (0.99–1.00) 0.80
Subarachnoid haemorrhage < 5 0.57 (0.25–0.84) 0.57 (0.25–0.84) 1.00 (0.99–1.00) 0.53
Microbleed < 5 1.00 (0.34–1.00) 1.00 (0.34–1.00) 1.00 (0.99–1.00) 1.00
Tumour
Any tumour 52 0.96(0.87–0.99) 0.84 (0.73–0.91) 1.00 (0.99–1.00) 0.90
Glioma < 5 1.00 (0.44–1.00) 0.60 (0.23–0.88) 1.00 (0.99–1.00) 0.75
Meningioma < 5 1.00 (0.34–1.00) 1.00 (0.34–1.00) 1.00 (0.99–1.00) 1.00
Metastasis 37 1.00 (0.91–1.00) 0.90 (0.78–0.96) 0.99 (0.99–1.00) 0.95
Other 10 0.83 (0.55–0.95) 0.71 (0.45–0.88) 0.99 (0.99–1.00) 0.77
Table 4Demographics of NHS Tayside patients providing reports
Age group (yrs) Patients (N) Women (%) Men (%) Stroke death or admission within 30 days of scan (%)
0–50 31,860 54.9 45.1 1.5
51–65 19,583 48.8 51.2 6.1
66–75 18,105 50.7 49.3 8.8
Over 75 27,746 61.7 38.3 9.5
The performance of our algorithm differed to a mod-est degree in the ESS dataset which was enriched for cerebrovascular phenotypes and NHS Tayside from gen-eral radiology practice. This is probably accounted for by the differences in language used across different radi-ology departments; and the different prevalence of find-ings in different datasets with higher prevalence leading to greater positive predictive value.
The high IAA scores indicate that the annotation tasks were well-defined. In previous work we have demon-strated the impact annotation has on NLP performance [17]. The same is true for this task, the better and more defined the annotation the easier it is to extract the same
information automatically. Before doing the annotation, the experts carried out some pilot annotation on paper and we decided on a set of rules for what to annotate. In some cases, the high IAA can also be attributed to the consistent use of medical terms in this domain. While there is some variation, certain diseases and symptoms are described with widely used and well-known expres-sions and it is straightforward for experts to identify them in text.
The high accuracy of the rules in our system results largely from the topic-focused nature of the radiology reports and the fact that the language is restricted and conventionalized, with only a limited number of ways in which a phenomenon tends to be described. Several of the system errors arise from unexpected ways of phras-ing concepts, for example, the entity subarachnoid_ haemorrhage is most frequently expressed as ‘ subarach-noid haemorrhage’, ‘subarachnoid blood’ or ‘SAH’, and the system failed to recognize it in a report where it was described as ‘blood in the subarachnoid spaces’. This is the kind of problem that unavoidably occurs when test or run-time data contains unseen examples, i.e. ways of expressing concepts that have not been seen in the train-ing/development data. This is true of both supervised machine-learning and rule-based systems. At the final stage of assigning labels to documents, labels will be missed if the relevant named-entities or relations have been missed (false negatives). Errors at this stage also arise from false positives from NER, relation detection and negation detection. Clear cases of time and location relations (e.g. ‘Right frontal chronic haemorrhage’) are straightforward to detect but the system can make errors in linking a time or location to an entity because it does not take sentence-structure into account. For example, in the sentence ‘I suspect this reflects redistribution of the original haematoma rather than new blood.’, the time entity ‘new’ was wrongly linked to the haemor-rhagic stroke entity ‘haematoma’. With regard to neg-ation, clearly stated absence of a phenomenon (e.g. ‘No metastases’) are reliably detected but in cases where the annotator has marked an entity as negative in an unclear context (e.g. ‘diffusely sclerotic metastases are much less likely’), negation detection can fail and this can lead to a false positive in the labelling.
The phenotypes we have chosen are those that are rele-vant for epidemiological and clinical researchers. There are limits to the detail in reports in clinical practice, hence we chose to identify phenotypes that we thought would be possible to code. In different settings (for example hyper-acute stroke services), there may be more detail in individ-ual reports to identify other phenotypes such as vessel occlusion. Further work is needed to enrich our samples for less common phenotypes (for example individual types of haemorrhagic stroke or tumours); to determine the
Table 5Proportion of reports with a brain imaging phenotype in NHS Tayside (110,695 reports). Small numbers suppressed due to data governance requirements
Reports (N) Percentage of total number of scans (%)
Atrophy 28,757 26.0
Small vessel disease 15,015 13.6
Stroke
Underspecified 1609 1.5
Haemorrhagic stroke
Deep, old 168 0.2
Deep, recent 397 0.4
Lobar, old 288 0.3
Lobar, recent 415 0.4
Underspecified 5702 5.2
Ischaemic stroke
Cortical, old 4385 4.0
Cortical, recent 1860 1.7
Deep, old 10,636 9.6
Deep, recent 771 0.7
Underspecified 9172 8.3
Haemorrhagic transformation 279 0.3
Subdural hematoma 2272 2.1
Subarachnoid haemorrhage
Aneurysmal 55 0.1
Other 1381 1.3
Microbleed
Deep 15 0.0
Lobar < 10 0.0
Underspecified 19 < 0.1
Tumour
Glioma 667 0.6
Meningioma 1458 1.3
Metastasis 2621 2.4
diagnostic contribution of NLP alongside structured, coded data (e.g., ICD-coded hospital admissions or Read-coded primary care consultations); to compare the per-formance of NLP coding of reports against research-grade reads of images; and to implement these algorithms within NHS systems.
In terms of portability and generalisability of our NLP system, we have shown that EdIE-R is robust in pheno-type labelling performance when porting it from one dataset to another (ESS to Tayside). The same holds true for named entity recognition (NER) on the same data. While we spent some effort on fine-tuning the system on the new development data, this did not take a sub-stantial amount of time [15]. We would expect a high level of performance when running the EdIE-R system over new brain imaging reports. To port the system to a new type of medical text, e.g. radiology reports for a dif-ferent disease or body part, or to pathology reports, we would require a new lexicon and would need to adapt some of the rules. This is not an insignificant amount of effort and requires input from domain experts. Instead we could use machine learning methods but would then require more training data (annotated by domain ex-perts), as well as time to fine-tune parameters or fea-tures, in order to reach or exceed the same level of performance as the rule-based method.
Conclusions
In summary, we have demonstrated that an NLP algo-rithm can be developed with neuroradiology reports from the UK NHS radiology records, allowing identifica-tion of cohorts of patients with important cerebrovascu-lar phenotypes at a scale that would otherwise not be possible.
Abbreviations
CI:Confidence interval; CT: Computerised tomography; EdIE-R: Edinburgh Information Extraction for Radiology; ESS: Edinburgh stroke study; IAA: Inter-annotator agreement; MRI: Magnetic resonance imaging; NER: Named entity recognition; NHS: National Health Service; NLP: Natural language processing; POS: Part-of-speech; PPV: Positive predictive value; TIA: Transient ischaemic attack
Acknowledgements
We acknowledge the support of the Health Informatics Centre (HIC), University of Dundee for managing and supplying the anonymized data and NHS Tayside, the original data source.
Authors’contributions
EW, GM, CS, CG, BA and WW made substantial contributions to: (1) The conception and design of the study, acquisition of data, or interpretation of data. (2) Drafting the manuscript and revising it critically for important intellectual content. (3) Approve the final version to be submitted.
Funding
EW is supported by the Wellcome Trust PhD program in Translational Neuroscience (203769/Z/16/Z). CS is Chief Scientist of UK Biobank, and the Edinburgh Stroke Study was funded by the Wellcome Trust. CG and BA are supported by Turing Fellowships from The Alan Turing Institute (EPSRC grant EP/N510129/1). GM is supported by a Stroke Association Edith Murphy
Foundation Senior Clinical Lectureship (SA L-SMP 18\1000). WW was sup-ported by an MRC Clinician Scientist Award (G0902303) and is supsup-ported by a Scottish Senior Clinical Fellowship (CAF/17/01). None of the funding sources played any role in the design of the study and collection, analysis, and interpretation of data and in writing the manuscript.
Availability of data and materials
Brain imaging reports are available, after appropriate approvals have been obtained from an ethics board (a UK-based ethics committee) or data gov-ernance board (NHS Tayside) covering the use of these data. The NLP algo-rithms are available on application to the authors.
Ethics approval and consent to participate
The Edinburgh Stroke Study received ethical approval from the Lothian Research Ethics Committee (LREC/2001/4/46). We received permission from the NHS Tayside Caldicott Guardian to use anonymized brain imaging reports.
Consent for publication
Not applicable.
Competing interests
None.
Author details 1
Centre for Clinical Brain Sciences, University of Edinburgh, Edinburgh, UK.
2Centre for Medical Informatics, Usher Institute of Population Health Sciences
and Informatics, University of Edinburgh, Edinburgh, UK.3Health Data Research UK Scotland, Edinburgh, UK.4The Alan Turing Institute, British
Library, 96 Euston Road, London, UK.5Institute for Language, Cognition and Computation, School of Informatics, University of Edinburgh, Edinburgh, UK.
6
Nuffield Department of Population Health, University of Oxford, Oxford, UK.
Received: 27 May 2019 Accepted: 3 September 2019
References
1. NHS Digital. Diagnostic imaging dataset bodysite provider counts 2016– 2017. 2017.
2. Sudlow C, Gallacher J, Allen N, Beral V, Burton PP, Danesh J, et al. UK biobank: an open access resource for identifying the causes of a wide range of complex diseases of middle and old age. PLoS Med. 2015;12(3):e1001779. 3. Gilbert EH, Lowenstein SR, Koziol-McLain J, Barta DC, Steiner J. Chart reviews in emergency medicine research: where are the methods? Ann Emerg Med. 1996;27(3):305–8.
4. Pons E, Braun LMM, Hunink MGM, Kors JA. Natural language processing in radiology: a systematic review. Radiology. 2016;279(2):329–43.
5. Castro VM, Dligach D, Finan S, Yu S, Can A, Abd-El-Barr M, et al. Large-scale identification of patients with cerebral aneurysms using natural language processing. Neurology. 2017;88(2):164–8.
6. Fu S, Leung LY, Wang Y, Raulli A-O, Kallmes DF, Kinsman KA, et al. Natural language processing for the identification of silent brain infarcts from neuroimaging reports. JMIR Med Informatics. 2019;7(2):e12109. 7. Whiteley W, Jackson C, Lewis S, Lowe G, Rumley A, Sandercock P, et al.
Inflammatory markers and poor outcome after stroke: a prospective cohort study and systematic review of Interleukin-6. PLoS Med. 2009;6(9):e1000145. 8. Stenetorp P, Pyysalo S, TopićG, Ohta T, Ananiadou S, Tsujii J. BRAT: a
web-based tool for NLP-assisted text annotation. Proceedings of the demonstrations at the 13th conference of the European chapter of the association for computational linguistics: Association for Computational Linguistics; 2012. p. 102–7.
9. Deleger L, Li Q, Lingren T, Kaiser M, Molnar K, Stoutenborough L, et al. Building gold standard corpora for medical natural language processing tasks. AMIA. Annu Symp proceedings AMIA Symp. 2012;2012:144–53. 10. Grover C, Matthews M, Tobin R, Grover C, Matthews M, Tobin¡ R. Tools to
address the interdependence between tokenisation and standoff annotation. Proc NLPXML. 2006:19–26.
12. Kim J-D, Ohta T, Tateisi Y, Tsujii J. GENIA corpus--a semantically annotated corpus for bio-textmining. Bioinformatics. 2003;19(Suppl 1):i180–2. 13. Minnen G, Carroll J, Pearce D. Robust, applied morphological generation. In:
Proceedings of the first international conference on natural language generation - INLG‘00. Morristown, NJ, USA: Association for Computational Linguistics; 2000. p. 201.
14. Wilson EB. Probable inference, the law of succession, and statistical inference. J Am Stat Assoc. 1927;22:209–12.
15. Gorinski PJ, Wu H, Grover C, Tobin R, Talbot C, Whalley H, et al. Named Entity Recognition for Electronic Health Records: A Comparison of Rule-based and Machine Learning Approaches. arXiv:190303985v2 [csCL]. 2019 Mar 10;
16. Woodfield R, Grant I, Sudlow CLM. Accuracy of electronic health record data for identifying stroke cases in large-scale epidemiological studies: a systematic review from the UK biobank stroke outcomes group. Quinn TJ, editor. PLoS One. 2015;10(10):e0140533.
17. Alex B, Nissim M, Grover C. The impact of annotation on the performance of protein tagging in biomedical text. In: proceedings of the fifth international conference on language resources and evaluation (LREC’06). European Language Resources Association (ELRA). 2006:L06–1235.
Publisher’s Note