R E S E A R C H
Open Access
Detection of changes in gene regulatory patterns,
elicited by perturbations of the Hsp90 molecular
chaperone complex, by visualizing multiple
experiments with an animation
Pablo C Echeverría
1, Fedor Forafonov
1, Deo P Pandey
2, Guillaume Mühlebach
1and Didier Picard
1** Correspondence: didier. [email protected] 1Département de Biologie Cellulaire, Université de Genève, Sciences 3, CH - 1211 Genève 4, Switzerland
Full list of author information is available at the end of the article
Abstract
Background:To make sense out of gene expression profiles, such analyses must be
pushed beyond the mere listing of affected genes. For example, if a group of genes persistently display similar changes in expression levels under particular experimental conditions, and the proteins encoded by these genes interact and function in the same cellular compartments, this could be taken as very strong indicators for co-regulated protein complexes. One of the key requirements is having appropriate tools to detect such regulatory patterns.
Results:We have analyzed the global adaptations in gene expression patterns in the
budding yeast when the Hsp90 molecular chaperone complex is perturbed either pharmacologically or genetically. We integrated these results with publicly accessible expression, protein-protein interaction and intracellular localization data. But most importantly, all experimental conditions were simultaneously and dynamically visualized with an animation. This critically facilitated the detection of patterns of gene expression changes that suggested underlying regulatory networks that a standard analysis by pairwise comparison and clustering could not have revealed.
Conclusions:The results of the animation-assisted detection of changes in gene
regulatory patterns make predictions about the potential roles of Hsp90 and its co-chaperone p23 in regulating whole sets of genes. The simultaneous dynamic visualization of microarray experiments, represented in networks built by integrating one’s own experimental with publicly accessible data, represents a powerful discovery tool that allows the generation of new interpretations and hypotheses.
Keywords:gene expression, microarray analysis, visualization, yeast, stress response,
molecular chaperones, Hsp90, inhibitor, gene deletion
Background
In the current post-genomic era, an increasing amount of data is generated by the application of high-throughput technologies. Expression profiling analyses using DNA microarray approaches are extensively used to study global changes in gene expression patterns of multiple cell types and tissues under different conditions. Moreover, there are publicly accessible databases containing the experimentally established DNA bind-ing sequences for transcription factors (TF). To identify interaction partners of a
protein of interest, several large-scale methods such as yeast two-hybrid screens, tandem affinity purification followed by mass spectrometric analyses, and protein chips are commonly used. Proteome-wide studies to identify protein-protein interaction (PPI) partners for many proteins have resulted in several publicly available and well-curated databases, which can be used to elucidate and to explore PPI networks. The integration of this large amount of data from many sources in a comprehensive and insightful way requires the use of computational tools to combine, to manipulate and to visualize the information [1-3]. Visualization constitutes in itself a challenge. This is particularly true for the multivariate type of data that omics approaches generate. A multitude of tools have been developed that allow both still and animated data visuali-zation [4,5]. However, it is increasingly recognized that visualizing data is more than just presenting it; it also constitutes an exploration tool [6]. It could even be argued that the characteristics of human pattern recognition [7] make the human subject a powerful ally of mathematical algorithms for the discovery of principles in complex data.
Hsp90 is an abundant molecular chaperone that is essential for many cellular regula-tory and signal transduction systems by promoting the functionally competent state of a large list of client proteins. Hsp90 recruits a cohort of associated partners or co-chaper-ones, which form a variety of multiprotein complexes with Hsp90. These co-chaperones assist Hsp90 by modulating its ATPase cycle and by facilitating its interactions with var-ious client/substrate proteins [8-10]. An extensively studied Hsp90 co-chaperone is p23 (known as Sba1 in the budding yeastSaccharomyces cerevisiae) [11,12]. This ubiquitous acidic protein binds and stabilizes the ATP-bound dimeric form of Hsp90 [10,13,14], inhibits ATP hydrolysis and thereby traps Hsp90 in a state with high affinity for client proteins [15,16]. Hsp90 inhibitory drugs such as geldanamycin and radicicol, and post-translational modifications, such as the hyperacetylation of Hsp90, lead to the release of p23 from Hsp90, which destabilizes the Hsp90-substrate interaction [17,18]. Moreover, it was found that in the absence of p23, yeast and mammalian cells are viable [19,20], but become hypersensitive to Hsp90 inhibitors [21]. Considering the biochemically established important role of p23 in regulating Hsp90, we wanted to investigate the tran-scriptional adaptations of budding yeast when p23 is removed from the Hsp90 complex either genetically or pharmacologically. We carried out microarray experiments with wild-type and p23-deficientS. cerevisiaestrains, in which Hsp90 function was addition-ally impaired with the Hsp90 inhibitor radicicol.
Methods
RNA sample preparation and microarray analysis
The strain BY4741 (Mata his3Δ1 leu2Δ0 met15Δ0 ura3Δ0)was used as the wild-type strain and its derivative BYP2 [21] as the Δsba1 strain. The strains were grown in YEPD with 10 μM radicicol or with the same volume of the vehicle DMSO for about 14 hours to reach the desired OD600≈0.6-1.0. RNA was extracted from triplicate
cul-tures using the hot-phenol method and subsequently cleaned up further on columns with the QiaGen RNA purification Kit. RNA quality was assessed with a BioAnalyzer (Bio-Rad). Expression profiles for these four experimental conditions using triplicate samples were determined using the YG_S98 gene chips from Affymetrix at the geno-mics platform of the University of Geneva. The data are available from ArrayExpress at EBI (access code E-TABM-573). The raw data obtained from the expression profil-ing was analyzed with the software GeneSprprofil-ing 7.3. The samples were subjected to a 2-way Anova statistical test and a cut-off of p-value < 0.05 with the volcano plot for pair-wise comparisons between two experimental conditions.
TF binding site analysis
Sequence retrieval: 1000 nucleotides upstream of the transcription start sites were retrieved from theS. cerevisiae Refseq genomic DNA sequence available at NCBI for the set of genes characterized by a 1.5 fold change in expression when Hsp90 was inhibited with radicicol in wild-type cells (Additional File 1 Table S1). Similarly, 1000 nucleotides upstream of the transcription start sites for all Refseq annotated S. cerevi-siae genes were retrieved to be used as the background/control sequences. TF identifi-cation: TRANSFAC Professional 11.4 was used as described previously [22] except that it was done with the set of all fungal TF binding sites retrieved from matrix.dat in TRANSFAC. The represented TF binding sites were sorted by their relative over-representation in the target sequence set (see Additional File 2 Table S2).
Yeast reporter gene assays
The reporter gene assays were done with yeast strain YNK100 (relevant genotype: pdr5-101) [23] transformed with the plasmids pSTRE-LacZ(TRP1) [24] and pLG/Z [25], which contain the STRE from theCTT1promoter and the UAS of theGAL1promoter, respectively, upstream of a minimalCYC1promoter drivingb-galactosidase expression. The transformants with pSTRE-LacZ(TRP1) and pLG/Z were grown in YEP comple-mented with 2% glucose and 2% raffinose/2% glycerol, respectively. Overnight cultures were diluted to a density of OD600= 0.3, incubated for 4 hours before adding 30μM
radicicol in ethanol or vehicle alone. In the case of the pLG/Z transformants, galactose was added at the same time to induce reporter gene expression. After an additional 3 hours of incubation,b-galactosidase activities were measured using standard protocols and normalized to cell densities (OD600). For all growth conditions and strains, the
growth temperature was 25°C. The data points represent the averages of three and two independent experiments with replicates for the STRE andGALreporters, respectively.
Integration of microarray data with PPI networks
the physical interactions annotated in the BioGrid database for S. cerevisiae (release 2.0.49) were formatted into an Excel spreadsheet and then uploaded into Cytoscape using the function “Import Network from a table”. From this network, the first level of PPIs was retrieved for the list of genes showing significant fold change in all microar-ray experiments. One “node” in this network corresponds to a gene/protein and the connection between them is called “edge” and it refers to the interaction between these two nodes. The expression data was then loaded onto this network, importing the fold change values in a tab-delimited format. This allows one later to compute a correlation network using the Cytoscape plugin ExpressionCorrelation (http://www. baderlab.org/Software/ExpressionCorrelation). This plugin facilitates the assembly of a co-expression network, integrated into the PPI network, from microarray data, by com-puting the Pearson correlation coefficient for all pairwise comparisons. We used a cut-off of 0.9 in this analysis, and so, any correlations above these threshold values are displayed again as an edge between two nodes. Network images were generated using Cytoscape version 2.6.1 and each node was placed according to its annotated intracel-lular localization (Gene Ontology [GO] celintracel-lular component) in celintracel-lular compartment layers using the plugin Cerebral [27]. All the schemes were first exported as Cerebral views from Cytoscape and then loaded into Adobe Illustrator for editing. The anima-tion was generated in Adobe Illustrator and exported as a Flash file.
Results
Microarray analysis and data organization in a graph
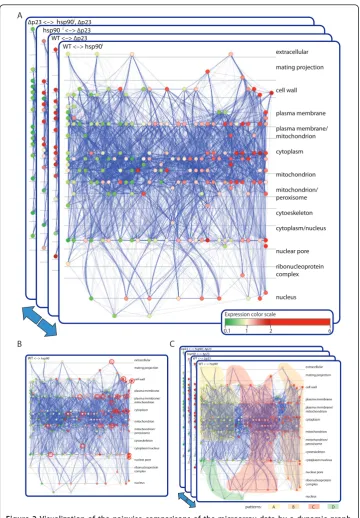
positioned according to their intracellular localization and their connectivity with topo-logical neighbors; at the same time, they get “geographically”separated from unrelated nodes. As a result, highly interconnected nodes with similar intracellular localization get closer in the generated graph [27] (Figures 1A and 2). All these manipulations group the nodes in a graph according to their PPIs, co-expression, and intracellular localizations. Thereafter, nodes are colored with a red-to-green gradient according to their expression values, where red and green represented up-regulation and down-reg-ulation, respectively (Figures 1B and 2A). At this point, individual dependency graphs [3] relate to a single pairwise comparison of experimental conditions and are more or less multivariate depending on what additional data were incorporated with the origi-nal gene expression profiles.
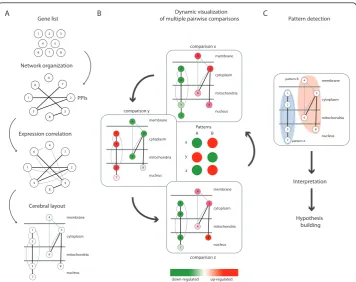
3 1 7 4 5 6 8 2 Gene list 7 8 6 3 4 2 5 1 Network organization PPIs A Expression correlation 1 8 4 5 7 2 3 6 Cerebral layout 3 2 7 1 membrane cytoplasm mitochondria nucleus 8 6 5 4 3 2 7 1 membrane cytoplasm mitochondria nucleus 8 6 5 4 comparison x Dynamic visualization of multiple pairwise comparisons
B comparison y membrane cytoplasm mitochondria nucleus 3 6 5 4 2 8 7 1 3 2 7 1 membrane cytoplasm mitochondria nucleus 6 5 4 8 comparison z down-regulated up-regulated Patterns A B x y z Pattern detection C 3 2 7 1 membrane cytoplasm mitochondria nucleus 8 6 5 4 pattern A pattern B Hypothesis building Interpretation
Figure 1Flow chart of the microarray data analysis. To illustrate the procedure, we arbitrarily used a
Δp23 <–> hsp90i, Δp23 hsp90i <–> Δp23 WT <–> Δp23
extracellular mating projection
cell wall
plasma membrane plasma membrane/ mitochondrion cytoplasm
mitochondrion mitochondrion/ peroxisome cytoeskeleton cytoplasm/nucleus
nuclear pore ribonucleoprotein complex
nucleus WT <–> hsp90i
extracellular mating projection
cell wall
plasma membrane plasma membrane/ mitochondrion
cytoplasm
mitochondrion mitochondrion/ peroxisome
cytoeskeleton cytoplasm/nucleus
nuclear pore ribonucleoprotein complex
nucleus WT <–> hsp90i
C B
A
W
patterns: A B C D
Δp23 <–> hsp90i, Δp23
hsp90i<–> Δp23 WT <–> Δp23
extracellular
mating projection
cell wall
plasma membrane
plasma membrane/ mitochondrion
cytoplasm
mitochondrion
mitochondrion/ peroxisome
cytoeskeleton
cytoplasm/nucleus
nuclear pore
ribonucleoprotein complex
nucleus WT <–> hsp90i
Expression color scale
0.1 1 2 6
Figure 2Visualization of the pairwise comparisons of the microarray data by a dynamic graph.
Finding biologically relevant co-regulation patterns
To identify patterns of coregulation, graphs can be analyzed one experiment at a time (pairwise comparisons) or“dynamically” (all experiments together) (Figure 1B). Per-forming a GO analysis on the results of single pairwise comparisons of the expression data, notably the ones for wild-type cells treated or not with radicicol, we found that there are a significant number of genes related to the stress response (highlighted in Additional File 1 Table S1). A TF site analysis of the promoters of genes showing sig-nificant changes in expression upon inhibition of Hsp90 with radicicol revealed that they are considerably enriched in stress response elements (STREs) (Additional File 2 Table S2). Furthermore, the genes with STREs in their promoters (genes marked “yes” in the column STRE of Additional File 1 Table S1) all belong to the ones that are up-regulated upon pharmacological inhibition of Hsp90, indicating that they might be implicated in the same biological processes (Figure 2B, highlighted red nodes, and Additional File 1 Table S1). The enrichment of STREs in promoters of many genes up-regulated by Hsp90 inhibition suggested that inhibition of Hsp90 may lead to a stress response by signaling through these regulatory elements. To evaluate this hypothesis experimentally, we examined the expression of a STRE reporter gene fol-lowing Hsp90 inhibition by radicicol and found that inhibition of Hsp90 indeed up-regulates it (Figure 3). These results support this hypothesis, which was based on a standard pairwise comparison and TF analysis.
Whereas the more or less multidimensional dependency graphs generated by these binary comparisons are useful and yield interesting results, some patterns might only become apparent by investigating the data of all performed experiments simultaneously as highlighted in Figure 1. Specifically, looking at all experiments at once may facilitate the detection of genes or sets of genes with similar or particular expression patterns across the different genetic and pharmacological conditions (Figure 1B). To this end, all the networks generated from the different pairwise comparisons were superimposed on each other as a stack and converted into a dynamic graph or animation (Additional File 3 Movie S1). This animation then served as a discovery tool to extract novel patterns of behavior. By visualizing the recurring patterns of colors (red or green according to their expression values), genes could be assigned to different clusters (Figure 1B), which are coordinately or simultaneously regulated by Hsp90 and p23 (Figure 2C and Additional File 3 Movie S1). In Figure 2C and Additional File 3 Movie S1, highlighted regions indi-cate the positions in the graph where most of the nodes belonging to each pattern were visually identified. For example, by watching the animation (Additional File 3 Movie S1), one can observe the following pattern of node color changes in the central/upper left region of the graph: red, green, green and red (arbitrarily referred to as pattern A). Simi-larly, there is another pattern in the central/upper right region: green, red, red and green (pattern B). The classification of all genes in our study according to these patterns is given in column“Pattern”of the Additional File 1 Table S1.
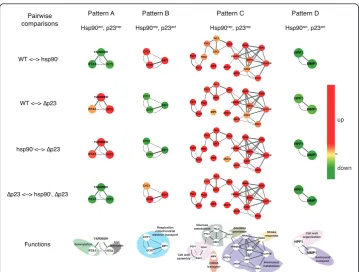
those whose expression changes substantially (indicated by the red and green nodes) across all pairwise comparisons that define patterns (see Figure 4 and Additional File 4 Table S3). However, considering that this is a relatively small subset of genes, notably in our data set, it is important to realize that the detection of patterns is crucially aided by many more genes (nodes) that change substantially in only a subset of pair-wise comparisons (and less or not at all in others).
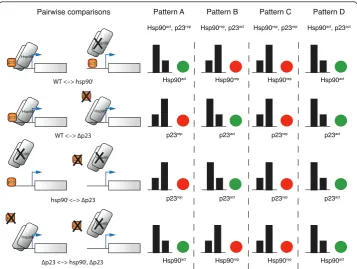
The original biological set-up and rationale of the microarray experiments then serve to interpret these novel patterns (Figures 1C and 5). For example, we can deduce that
relative reporter activities
(in % of untreated samples)
-
+
-
+
Rd
STRE
GAL
STRE
β
-galactosidase
CYC1
UAS
GALβ
-galactosidase
CYC1
0 20 40 60 80 100 120 140 160 180 200
Figure 3Pharmacological inhibition of Hsp90 induces a stress response in yeast. Expression ofb
pattern A corresponds to a set of genes simultaneously affected (directly or indirectly) by Hsp90 and p23, positively by Hsp90 and negatively by p23 (referred to as Hsp90actand p23rep, respectively, in Figures 4 and 5). Doing the same analysis for pattern B, it could be inferred that these genes would be affected negatively by Hsp90 and positively by p23 (Figure 5). Furthermore, there is a pattern (pattern C) in which genes are up-regulated in all experiments: all nodes are red in all comparisons (central region of the graph, Fig-ure 2C and Additional File 3 Movie S1) implying that both Hsp90 and p23 negatively affect genes in this pattern. Pattern D is defined by genes that are down-regulated in all experiments: all nodes are green in all comparisons (left lower region), indicating that all the genes in this pattern might be positively affected by Hsp90 and p23 (Figure 5). Not unexpectedly, there were several genes (group E) that did not have any defined pattern of expression among all the pairwise comparisons (Additional File 1 Table S1). Although Hsp90 and p23 regulate these genes, no clear insight emerges with this type of analysis for their concurrent/simultaneous regulation by both of these proteins.
Inference of functions for patterns differentially regulated by Hsp90 and p23
Following the identification of different patterns by this animation, we extracted the genes corresponding to each pattern (Additional File 1 Table S1). Full GO data for
Pattern A Hsp90act, p23rep
Pattern B Hsp90rep, p23act
Pattern C Hsp90rep, p23rep
Pattern D Hsp90act, p23act
Pairwise comparisons
WT <–> hsp90i
∆p23 <–> hsp90i, ∆p23
hsp90i <–> ∆p23
WT <–> ∆p23
RTA1 YAR066W FIT3 BNA1 MEP2 BNA2 DDR2 YKL071W CAR2 AGA1 YHR054C TKL2 PGU1 YGP1 GSC2 PYC1 ARO9 ARO10 DAL4 MIP6 CYC1 QCR7 INH1 MMP1 HPF1 RTA1 YAR066W FIT3 CYC1 QCR7 INH1 BNA1 MEP2 BNA2 DDR2 YKL071W CAR2 AGA1 YHR054C TKL2 PGU1 YGP1 GSC2 PYC1 ARO9 ARO10 DAL4 MIP6 MMP1 HPF1 RTA1 YAR066W FIT3 CYC1 QCR7 INH1 BNA1 MEP2 BNA2 DDR2 YKL071W CAR2 AGA1 YHR054C TKL2 PGU1 YGP1 GSC2 PYC1 ARO9 ARO10 DAL4 MIP6 MMP1 HPF1 RTA1 YAR066W FIT3 CYC1 QCR7 INH1 BNA1 MEP2 BNA2 DDR2 YKL071W CAR2 AGA1 YHR054C TKL2 PGU1 YGP1 GSC2 PYC1 ARO9 ARO10 DAL4 MIP6 MMP1 HPF1 RTA1 YAR066W FIT3 CYC1 QCR7 INH1 BNA1 MEP2 BNA2 DDR2 YKL071W CAR2 AGA1 YHR054C TKL2 PGU1 YGP1 GSC2 PYC1 ARO9 ARO10 DAL4 MIP6 MMP1 HPF1 Functions up down BNA1 Respiration mitochondrial
electron transport Cell wall
organization Aminoacid transport Cell wall assembly Glucose metabolism Allantoin permease mRNA transport Stress response Aminoacid metabolism
Sumoylation transportIron
Figure 4Genes that change significantly in all pairwise comparisons define the four regulatory
genes belonging to each pattern were retrieved to address the potential functions of these groups. Genes from pattern A (Hsp90act, p23rep) showed enrichment in func-tional terms associated with iron and ion homeostasis, whereas functions of those belonging to pattern B (Hsp90rep, p23act) fell into a mitochondrial function (respira-tion), kinase activity dependent on cyclins and progression through the cell cycle. Genes from pattern C (Hsp90rep, p23rep) exhibit GO terms related with conjugation processes, catabolism of nitrogen sources and response to stress. The concomitant absence of Hsp90 and p23 induces the expression of stress-related proteins like Ssa4 (encoding one of the cytosolic Hsp70 isoforms), Hsp26, Hsp31, Ddr2. Interestingly, both chaperones might have a positive influence on the expression of genes (pattern D) related with mitochondrial protein import and carbon source metabolism (TOM70,
OAC1,MDH2and DIC1), a phosphatase that positively regulates the Hsp90 chaperone machinery (Ppt1) [33], or chromatin remodelers like Nhp6 and Imd2. Furthermore, the genes lacking any particular pattern (group E), do not show significant enrichment for any functional annotations. Interestingly, the genes for Hsp90 (HSP82encoding one of the two cytosolic isoforms) and for its co-chaperones Aha1, Cpr6 and Sti1 belong to
Pattern A
Hsp90act, p23rep
Pattern B
Hsp90rep, p23act
Pattern C
Hsp90rep, p23rep
Pattern D
Hsp90act, p23act
Hsp90act
Hsp90act
Hsp90rep Hsp90rep
Hsp90rep Hsp90rep
Hsp90act
Hsp90act
p23rep p23act p23rep p23act Hsp90
p23 p23
Hsp90
WT <–> hsp90i
Hsp90 p23
p23 Hsp90
Δp23 <–> hsp90i, Δp23
Pairwise comparisons
p23 Hsp90
p23 Hsp90
hsp90i <–> Δp23 Hsp90 Hsp90
p23
p23
WT <–> Δp23 p23rep p23act p23rep p23act
Figure 5Biological interpretation of color patterns identified in the animation-assisted network
this group of genes, thus implying that their regulation is not affected by the interplay between Hsp90 and p23.
Discussion
Here we have presented a novel approach to integrate experimental gene expression profiles with already available data. We were able to combine our own data from microarray experiments and data from public databases of PPIs, TF, and GO in a rational manner to address the global biological functions of Hsp90 and p23 both indi-vidually and, perhaps more interestingly, concomitantly.
Several key features of our working pipeline (Figure 1) allowed us to process and to understand certain aspects of our data. First, we worked with genes showing a significant fold change in at least one, often several pairwise comparisons that were analyzed (Figure 1A). Second, we organized them into a graph establishing connections between nodes according to their co-expression levels and their ability to interact at the protein level (Fig-ure 1A). Third, we organized the nodes in the graph according to their annotated intracel-lular localization. Using the Cerebral layout, highly interconnected nodes with the same intracellular localization get grouped in the final individual graphs [27] (Figure 1A). And finally, a novel and essential feature of the analysis was to convert all the generated graphs into an animation to facilitate the visualization of similar expression patterns of genes topologically grouped in the individual graphs (Figures 1B and 2A, and Additional File 3 Movie S1). It is important to emphasize that this pattern detection was only possible by this method and that we failed to detect these patterns with more standard clustering algorithms (data not shown). The latter may have discarded or“undervalued”nodes with only marginal changes in gene expression whereas a human subject’s pattern recognition would have incorporated some of these as well. While small fold changes may not have any significant value by themselves, as part of a larger animated pattern, they attract the attention of a human observer and they may become corroborative. The interpretation of these patterns matched the information contained in the pairwise comparisons of the microarray data (Figure 5), which finally allowed us to uncover the genes that are regu-lated by both Hsp90 and p23. Thus, the use of an animation to visualize patterns was a key tool to connect the data of the different microarray experiments.
(Additional File 5 Table S4). Since many kinases are known Hsp90 clients (see regularly updated list at http://www.picard.ch/downloads/downloads.htm), we can speculate that Hsp90 and its co-chaperones maintain kinases responsible for Msn2/Msn4 repression in a functional state thereby regulating the stress-response (Additional File 6 Figure S1). Interestingly, with animation-assisted analysis, we noticed that not all stress-related genes belong to the same expression pattern. Most of these genes belong to patterns B and C, indicating that they are at the same time affected by Hsp90 and p23 (Additional File 3 Movie S1). It is also clear that Hsp90 and other co-chaperones (Sti1, Aha1, Cpr6) are up-regulated upon pharmacological Hsp90 inhibition, and yet they do not show any particular pattern. Hsf1 is the only stress-inducible transcriptional regulator of Hsp90 protein expression in yeast [42,43]. Conversely, Hsp90 represses gene expression from Hsf1-dependent promoters [44], establishing a negative feedback loop for its own expression. Conceivably, the genes for Hsp90 and at least some of its co-chaperones are regulated only by Hsf1, while the other stress-related genes exhibit a more complex reg-ulation involving the concurrent action of Hsp90 and p23, potentially through the Msn2/Msn4 system.
Conclusions
The animation-assisted analysis involving the visualization of complex connection maps with an animation uniquely allowed us to integrate the information from all the pairwise comparisons that were possible with the microarray data obtained in this study. We were able to address the potential actions of Hsp90 and p23 for the expres-sion of a large list of genes. Moreover, we could gain insights about groups of genes that are regulated together or individually by these two proteins. Even though Hsp90 and p23 seem to be essential partners for most of their functions, it is becoming clear that they can exert both coordinated as well as opposite influences on some of their clients, as previously described for example for the regulation of the telomerase com-plex or for recycling of nuclear receptors at chromatin targets [[45,46], and reviewed in ref. [47]]. Independent or even opposite influences are suggested by gene expression patterns A and B. It is conceivable, for example, that Hsp90, in association with other co-chaperones, is required to assist a particular transcription factor or complex at a set of target genes while the primary role of p23 for the same set of genes might be to dis-rupt transcription factor complexes. Taking into account indirect pathways, many more schemes are possible as well. At this point, we can only speculate about the underlying mechanisms. It will be both challenging and interesting to dissect them experimentally both in yeast and in other organisms.
Funding
This work was supported by the Canton de Genève, the Swiss National Science Foun-dation, and the Fondation Medic.
Additional material
Additional file 1: List of genes showing a significant fold change in the microarray data in at least one pairwise comparison. This file contains all the relevant microarray data.
Additional file 2: Overrepresented TF-binding sites in promoters of genes showing significant changes in expression upon Hsp90 inhibition.
Additional file 3: Animation allowing a dynamic analysis of the four pairwise comparisons. This movie can most easily be viewed by opening it in a web browser.
Additional file 4: List of genes showing a significant fold change in all pairwise comparisons. This file contains a subset of the data of Additional File 1 Table S1.
Additional file 5: Interactions between the Msn2/Msn4 and Hsp90-Hsp70 molecular chaperone systems. This file contains a list of known PPIs and a graphical representation of them.
Additional file 6: Speculative model of the regulation of the Msn2/Msn4 system by Hsp90 and p23. Black lines (–) illustrate PPIs retrieved from public databases (with experimentally determined interactions; see Additional File 5 Table S4 for details). Arrows and blunt arrows indicate activation and repression, respectively.
Acknowledgements
We thank Brian Freeman for providing the yeast strain YNK100 and David Engelberg for plasmid pSTRE-LacZ(TRP1). We are grateful to the collaborators of the genomics platform of the NCCR Frontiers-in-Genetics and the University of Geneva for their assistance with the microarray experiments.
Author details
1
Département de Biologie Cellulaire, Université de Genève, Sciences 3, CH - 1211 Genève 4, Switzerland.2Biotech Research and Innovation Center (BRIC), University of Copenhagen, Ole Maaloes vej 5, 2200 Copenhagen, Denmark.
Authors’contributions
Conceived and designed the project: PCE FF DP. Performed the wet bench experiments: FF GM. Performed the bioinformatic analyses: PCE FF DPP DP. Wrote the paper: PCE DP. All authors have read and approved the final manuscript.
Competing interests
The authors declare that they have no competing interests.
Received: 8 March 2011 Accepted: 14 June 2011 Published: 14 June 2011
References
1. Ideker T, Ozier O, Schwikowski B, Siegel AF:Discovering regulatory and signalling circuits in molecular interaction networks.Bioinformatics2002,18(Suppl. 1):S233-240.
2. Ulitsky I, Shamir R:Identification of functional modules using network topology and high-throughput data.BMC Syst Biol2007,1:8.
3. Bernthaler A, Muhlberger I, Fechete R, Perco P, Lukas A, Mayer B:A dependency graph approach for the analysis of differential gene expression profiles.Mol Biosyst2009,5:1720-1731.
4. Adler P, Reimand J, Janes J, Kolde R, Peterson H, Vilo J:KEGGanim: pathway animations for high-throughput data. Bioinformatics2008,24:588-590.
5. Gehlenborg N, O’Donoghue SI, Baliga NS, Goesmann A, Hibbs MA, Kitano H, Kohlbacher O, Neuweger H, Schneider R, Tenenbaum D, Gavin AC:Visualization of omics data for systems biology.Nat Methods2010,7:S56-68.
6. Fox P, Hendler J:Changing the equation on scientific data visualization.Science2011,331:705-708. 7. Wong B:Points of View: Gestalt principles (Part 2).Nat Methods2010,7:941-941.
8. Picard D:Heat-shock protein 90, a chaperone for folding and regulation.Cell Mol Life Sci2002,59:1640-1648. 9. Caplan AJ:What is a co-chaperone?Cell Stress Chaperones2003,8:105-107.
10. McLaughlin SH, Sobott F, Yao ZP, Zhang W, Nielsen PR, Grossmann JG, Laue ED, Robinson CV, Jackson SE:The co-chaperone p23 arrests the Hsp90 ATPase cycle to trap client proteins.J Mol Biol2006,356:746-758.
11. Johnson JL, Beito TG, Krco CJ, Toft DO:Characterization of a novel 23-kilodalton protein of unactive progesterone receptor complexes.Mol Cell Biol1994,14:1956-1963.
12. Felts SJ, Toft DO:p23, a simple protein with complex activities.Cell Stress Chaperones2003,8:108-113. 13. Weaver AJ, Sullivan WP, Felts SJ, Owen BA, Toft DO:Crystal structure and activity of human p23, a heat shock
protein 90 co-chaperone.J Biol Chem2000,275:23045-23052.
15. Richter K, Walter S, Buchner J:The co-chaperone Sba1 connects the ATPase reaction of Hsp90 to the progression of the chaperone cycle.J Mol Biol2004,342:1403-1413.
16. Sullivan WP, Owen BA, Toft DO:The influence of ATP and p23 on the conformation of hsp90.J Biol Chem2002, 277:45942-45948.
17. Johnson JL, Toft DO:Binding of p23 and hsp90 during assembly with the progesterone receptor.Mol Endocrinol 1995,9:670-678.
18. Kovacs JJ, Murphy PJ, Gaillard S, Zhao X, Wu JT, Nicchitta CV, Yoshida M, Toft DO, Pratt WB, Yao TP:HDAC6 regulates Hsp90 acetylation and chaperone-dependent activation of glucocorticoid receptor.Mol Cell2005,18:601-607. 19. Bohen SP:Genetic and biochemical analysis of p23 and ansamycin antibiotics in the function of Hsp90-dependent
signaling proteins.Mol Cell Biol1998,18:3330-3339.
20. Grad I, McKee TA, Ludwig SM, Hoyle GW, Ruiz P, Wurst W, Floss T, Miller CA III, Picard D:The Hsp90 co-chaperone p23 is essential for perinatal survival.Mol Cell Biol2006,26:8976-8983.
21. Forafonov F, Toogun OA, Grad I, Suslova E, Freeman BC, Picard D:p23/Sba1p protects against Hsp90 inhibitors independently of its intrinsic chaperone activity.Mol Cell Biol2008,28:3446-3456.
22. Pandey DP, Lappano R, Albanito L, Madeo A, Maggiolini M, Picard D:Estrogenic GPR30 signalling induces proliferation and migration of breast cancer cells through CTGF.EMBO J2009,28:523-532.
23. Kralli A, Bohen SP, Yamamoto KR:LEM1, an ATP-binding-cassette transporter, selectively modulates the biological potency of steroid hormones.Proc Natl Acad Sci USA1995,92:4701-4705.
24. Stanhill A, Schick N, Engelberg D:The yeast ras/cyclic AMP pathway induces invasive growth by suppressing the cellular stress response.Mol Cell Biol1999,19:7529-7538.
25. Louvion JF, Havaux-Copf B, Picard D:Fusion of GAL4-VP16 to a steroid binding domain provides a tool for gratuitous induction of galactose-responsive genes in yeast.Gene1993,131:129-134.
26. Cline MS, Smoot M, Cerami E, Kuchinsky A, Landys N, Workman C, Christmas R, Avila-Campilo I, Creech M, Gross B, Hanspers K, Isserlin R, Kelley R, Killcoyne S, Lotia S, Maere S, Morris J, Ono K, Pavlovic V, Pico AR, Vailaya A, Wang PL, Adler A, Conklin BR, Hood L, Kuiper M, Sander C, Schmulevich I, Schwikowski B, Warner GJ, Ideker T, Bader GD: Integration of biological networks and gene expression data using Cytoscape.Nat Protoc2007,2:2366-2382. 27. Barsky A, Gardy JL, Hancock RE, Munzner T:Cerebral: a Cytoscape plugin for layout of and interaction with
biological networks using subcellular localization annotation.Bioinformatics2007,23:1040-1042.
28. Ki SW, Ishigami K, Kitahara T, Kasahara K, Yoshida M, Horinouchi S:Radicicol binds and inhibits mammalian ATP citrate lyase.J Biol Chem2000,275:39231-39236.
29. Besant PG, Lasker MV, Bui CD, Turck CW:Inhibition of branched-chainα-keto acid dehydrogenase kinase and Sln1 yeast histidine kinase by the antifungal antibiotic radicicol.Mol Pharmacol2002,62:289-296.
30. Gadelle D, Bocs C, Graille M, Forterre P:Inhibition of archaeal growth and DNA topoisomerase VI activities by the Hsp90 inhibitor radicicol.Nucleic Acids Res2005,33:2310-2317.
31. Breitkreutz BJ, Stark C, Reguly T, Boucher L, Breitkreutz A, Livstone M, Oughtred R, Lackner DH, Bahler J, Wood V, Dolinski K, Tyers M:The BioGRID Interaction Database: 2008 update.Nucleic Acids Res2008,36:D637-640. 32. Ashburner M, Ball CA, Blake JA, Botstein D, Butler H, Cherry JM, Davis AP, Dolinski K, Dwight SS, Eppig JT, Harris MA,
Hill DP, Issel-Tarver L, Kasarskis A, Lewis S, Matese JC, Richardson JE, Ringwald M, Rubin GM, Sherlock G:Gene ontology: tool for the unification of biology. The Gene Ontology Consortium.Nat Genet2000,25:25-29. 33. Wandinger SK, Suhre MH, Wegele H, Buchner J:The phosphatase Ppt1 is a dedicated regulator of the molecular
chaperone Hsp90.EMBO J2006,25:367-376.
34. Estruch F:Stress-controlled transcription factors, stress-induced genes and stress tolerance in budding yeast.FEMS Microbiol Rev2000,24:469-486.
35. Martinez-Pastor MT, Marchler G, Schuller C, Marchler-Bauer A, Ruis H, Estruch F:The Saccharomyces cerevisiae zinc finger proteins Msn2p and Msn4p are required for transcriptional induction through the stress response element (STRE).EMBO J1996,15:2227-2235.
36. Boy-Marcotte E, Lagniel G, Perrot M, Bussereau F, Boudsocq A, Jacquet M, Labarre J:The heat shock response in yeast: differential regulations and contributions of the Msn2p/Msn4p and Hsf1p regulons.Mol Microbiol1999,33:274-283. 37. Ferguson SB, Anderson ES, Harshaw RB, Thate T, Craig NL, Nelson HC:Protein kinase A regulates constitutive
expression of small heat-shock genes in an Msn2/4p-independent and Hsf1p-dependent manner in Saccharomyces cerevisiae.Genetics2005,169:1203-1214.
38. Ptacek J, Devgan G, Michaud G, Zhu H, Zhu X, Fasolo J, Guo H, Jona G, Breitkreutz A, Sopko R, McCartney RR, Schmidt MC, Rachidi N, Lee SJ, Mah AS, Meng L, Stark MJ, Stern DF, De Virgilio C, Tyers M, Andrews B, Gerstein M, Schweitzer B, Predki PF, Snyder M:Global analysis of protein phosphorylation in yeast.Nature2005,438:679-684. 39. Mandal AK, Lee P, Chen JA, Nillegoda N, Heller A, DiStasio S, Oen H, Victor J, Nair DM, Brodsky JL, Caplan AJ:Cdc37
has distinct roles in protein kinase quality control that protect nascent chains from degradation and promote posttranslational maturation.J Cell Biol2007,176:319-328.
40. Geymonat M, Wang L, Garreau H, Jacquet M:Ssa1p chaperone interacts with the guanine nucleotide exchange factor of ras Cdc25p and controls the cAMP pathway in Saccharomyces cerevisiae.Mol Microbiol1998,30:855-864. 41. Thevelein JM, de Winde JH:Novel sensing mechanisms and targets for the cAMP-protein kinase A pathway in the
yeast Saccharomyces cerevisiae.Mol Microbiol1999,33:904-918.
42. Zarzov P, Boucherie H, Mann C:A yeast heat shock transcription factor (Hsf1) mutant is defective in both Hsc82/ Hsp82 synthesis and spindle pole body duplication.J Cell Sci1997,110:1879-1891.
43. Erkine AM, Adams CC, Gao M, Gross DS:Multiple protein-DNA interactions over the yeast HSC82 heat shock gene promoter.Nucleic Acids Res1995,23:1822-1829.
44. Duina AA, Kalton HM, Gaber RF:Requirement for Hsp90 and a CyP-40-type cyclophilin in negative regulation of the heat shock response.J Biol Chem1998,273:18974-18978.
46. Toogun OA, Dezwaan DC, Freeman BC:The hsp90 molecular chaperone modulates multiple telomerase activities. Mol Cell Biol2008,28:457-467.
47. Echeverría PC, Picard D:Molecular chaperones, essential partners of steroid hormone receptors for activity and mobility.Biochim Biophys Acta2010,1803:641-649.
doi:10.1186/1756-0381-4-15
Cite this article as:Echeverríaet al.:Detection of changes in gene regulatory patterns, elicited by perturbations
of the Hsp90 molecular chaperone complex, by visualizing multiple experiments with an animation.BioData
Mining20114:15.
Submit your next manuscript to BioMed Central and take full advantage of:
• Convenient online submission
• Thorough peer review
• No space constraints or color figure charges
• Immediate publication on acceptance
• Inclusion in PubMed, CAS, Scopus and Google Scholar
• Research which is freely available for redistribution