R E S E A R C H A R T I C L E
Open Access
A randomised controlled trial to test the
effectiveness of decision training on
assessors
’
ability to determine optimal
fitness-to-drive recommendations for older
or disabled drivers
Priscilla Harries
1*, Carolyn Unsworth
2,3,4, Hulya Gokalp
5, Miranda Davies
6, Christopher Tomlinson
7and Luke Harries
8Abstract
Background:Driving licensing jurisdictions require detailed assessments of fitness-to-drive from occupational therapy driver assessors (OTDAs). We developed decision training based on the recommendations of expert OTDAs, to enhance novices’capacity to make optimal fitness-to-drive decisions. The aim of this research was to determine effectiveness of training on novice occupational therapists’ability to make fitness-to-drive decisions.
Methods:A double blind, parallel, randomised controlled trial was conducted to test the effectiveness of decision training on novices’ fitness-to-drive recommendations. Both groups made recommendations on a series of 64 case scenarios with the intervention group receiving training after reviewing two thirds of the cases; the control group, at this same point, just received a message of encouragement to continue. Participants were occupational therapy students on UK and Australian pre-registration programmes who individually took part online, following the website instructions. The main outcome of training was the reduction in mean difference between novice and expert recommendations on the cases.
Results:Two hundred eighty-nine novices were randomised into intervention; 166 completed the trial (70 in intervention; 96 in control). No statistical differences in scores were found pre-training. Post training, the control group showed no significant change in recommendations compared to the experts (t(96) =−.69;p= .5), whereas the intervention group exhibited a significant change (t(69) = 6.89; p< 0.001). For the intervention group, the mean difference compared with the experts’ recommendations reduced with 95% CI from−.13 to .09. Effect size calculated at the post-training demonstrated a moderate effect (d = .69,r= .32).
Conclusions:Novices who received the decision training were able to change their recommendations whereas those who did not receive training did not. Those receiving training became more able to identify drivers who were not fit-to-drive, as measured against experts’decisions on the same cases.
This research demonstrated that novice occupational therapists can be trained to make decisions more aligned to those of expert OTDAs. The decision training and cases have been launched as a free training resource at www.fitnesstodrive.com. This can be used by novice driver assessors to increase their skill to identify drivers who are, and are not fit-to-drive, potentially increasing international workforce capacity in this growing field of practice.
Keywords:Decision making, Occupational therapy, Automobile driving, Training
* Correspondence:[email protected]
1Brunel University London, London, UK
Full list of author information is available at the end of the article
Background
Driving is a valued aspect of community mobility; it en-ables occupational engagement and community participa-tion, and enhances quality of life [1]. However, health conditions and disability can affect driving capacity. Driver assessment, to determine fitness-to-drive, may be under-taken by driver assessors employed by licensing author-ities, medical personnel or Occupational Therapist Driving Assessors (OTDAs). OTDAs, with their health-performance expertise, are well placed to conduct such as-sessments as they are trained in the relationship between health conditions and occupational performance capacity. Internationally, OTDAs assess those with disabilities who would like to learn to drive, as well as those drivers with illness, sudden onset disability, deteriorating health condi-tions or progressive disabilities. People with age related disabilities (frailty), neurological disorders (e.g. multiple sclerosis), cardiovascular disorder (e.g. stroke), muscular skeletal disorders (e.g. amputation), mental health needs (depression), or disorders with fluctuating disabilities such as dementia, may all require an OTDA driving assessment to determine safety to drive.
Government policy in many countries recognises OTDA’s role as driver rehabilitation specialists in driving assessment. For example the American Medical Associa-tion’s Physician’s Guide to Assessing and Counseling older drivers [2], states that a physician may advise a pa-tient to“…consult a driver rehabilitation specialist. This type of instructor, typically an occupational therapist will go out on the road with you to watch you drive, then rec-ommend ways to make your driving safer.” In the UK, the Quality, Innovation, Productivity and Prevention Al-lied Healthcare Professionals Stroke toolkit [3] states that occupational therapists “should assess and redevelop any impairments in skills….and advise patients on the conse-quences for driving” and where capacity is in doubt, use on-road assessments to assess driving ability [4]. In the Australian State of Victoria, OTDAs have been legally authorised to make recommendations to the licensing au-thorities regarding fitness-to-drive since 1986.
OTDAs can provide clinic based and on road driver rehabilitation services where required, however, there is a lack of OTDAs internationally and therefore limited services in this area of growing population need. For ex-ample there are less than 40 experienced UK OTDAs in this field (UK population of 62 million), as compared with 400+ Australian OTDA: Australian population 22 million. The number of younger disabled drivers who will seek to improve their quality of life through in-creased mobility, coupled with increasing numbers of older drivers means the number of driver assessments undertaken is expected to rise dramatically over the coming decades [5, 6]. Accurate assessment of fitness-to-drive is necessary not just for increasing road safety
but also for avoiding major implications of license cancellation on a person’s life style and potential in-creased need for family and community support [7].
Over thirty years of research has been undertaken to try to identify the most effective approach to driver as-sessment. While systematic reviews have identified a range of off-road assessments that can be used to assist determine fitness to drive, the sensitively (correctly iden-tifying drivers who cannot drive) and specificity (cor-rectly identifying drivers who can drive) values of many of these assessments are inadequate [8,9]. Furthermore, although attempts to present standard protocols for on-road testing have been made [10], the development of a standardised on-road assessment is generally viewed as unattainable due to the fact that each driving situation presents very differently [6]. Instead, researchers have begun to document that there is both the health profes-sional’s judgment of the driver’s capacity to drive, as well as the ‘truth’ of their driving capacity. This means that while optimal recommendations can be made (correctly identifying drivers who can and cannot drive), sub opti-mal recommendations can also be made (identifying fit drivers as unfit, and the reverse) [11]. Therefore, experts’ clinical judgement is key; experts have to make recom-mendations based on the findings of both clinic based and on road assessments. The accuracy of these recom-mendations is essential: they need to prevent unsafe drivers from driving in order to protect the driver and enhance safety for other road users, while not preventing clients who are fit-to-drive from driving.
If we are to look to expert OTDAs for guidance, we need to be aware that inconsistent rulings can be seen in driver assessment decisions made to licensing authorities by driver assessor occupational therapists. For example, in a recent audit undertaken by one of seven licensing authorities in Australia with 46 occupational therapists, it was found that in 25% of cases, the rationale for the recommendation was unclear, and in some cases where instructor intervention was required (which is docu-mented in Competency Standards as automatic fail deci-sions), 10% of OTDAs were still passing clients [12]. However, we also know it is possible to statistically model how decisions are made, identify the optimal judgement policies that produce these decisions and to use these to improve decision making capacity [13].
Trial (RCT) to test the effectiveness of the web-based decision training tool. The first phase has been pub-lished [14], and a short summary is provided.
Initially, we used a qualitative approach to establish the decision context, types of information (cues) available to the decision maker and possible decision outcomes that could be selected. From Unsworth’s previous study [15], the key cues important for making fitness-to-drive recom-mendations had been identified; these were debated with international OTDAs and adapted in terms of terminology and relevance for international use. Twelve cues were identified as important when making fitness-to-drive rec-ommendations: driving instructor intervention, driver be-haviour, cognitive and perceptual skills, vehicle handling skills, road law/road craft knowledge, physical skills, sen-sory functions, medical prognosis, current driving needs, driving experience and history, residence and age. A writ-ten definition was produced for the final 12 cues, and three distinct levels of each cue were established to repre-sent a range of case prerepre-sentations, with level three being the most positive, representing the lowest impact on fitness-to-drive (see Additional file1) e.g. the three levels for the driving history cue were 1=‘Client has had a major accident in the last 12 months’, 2=‘Client has had a few minor scrapes in the last 12 months’, 3=‘Client has had no accidents in the last 12 months’. The range and scope of decision recommendations in current practice were iden-tified and agreed. Valid‘driving’case scenarios (n= 64) of people with disabilities and/or older people were created using fractional factorial design in SPSS. The inter-cue correlations between the 12 cues across the original 64 scenarios were below 0.2. The case scenarios were reviewed, debated and agreed by the project advisory board, the project expert panel and the service user group. An example of a case scenario is given in Additional file2. Once agreed, the case scenarios along with instructions were put onto a dedicated website ready for assessment by experienced OTDAs in the optimal policy capturing study. There were four possible fitness-to-drive recommenda-tions identified as needed for each case referral:
1- Not fit-to-drive–Suspend or cancel licence 2- Not fit-to-drive–Driver rehabilitation to be
completed
3- Fit-to-drive–With conditions, for example, using an automatic car
4- Fit-to-drive–Unrestricted licence
Forty five experienced OTDAs from the UK, Australia and New Zealand made fitness-to-drive recommenda-tions for a set of 64 case scenarios via the dedicated
website. Agreement (consensus) between experts’
fitness-to-drive recommendations was very high: intra-class correlation (ICC) ICC(2,1) = .97, 95% confidence
interval (.96–.98); the experts also showed excellent consistency on repeated cases ICC(1,1) = .98, 95% confi-dence interval (.96–.99). Decisions made by the
experi-enced OTDAs were analysed and mathematically
modelled using the SJT approach. Two types of analysis were undertaken: Multiple Regression Analysis and Dis-criminate Function Analysis. The Multiple Regression Analysis, where the dependent variable was the mean expert decisions for original scenarios and the predictor variables were the cue levels for these scenarios, revealed that seven of the 12 cues had a significant influence on fitness-to-drive decisions. These were, in descending order of importance: driving instructor intervention, cli-ent’s vehicle handling skills, road law knowledge, phys-ical skills, sensory functions, cognitive and perceptual skills, and driving behaviour. The Discriminate Function Analysis was then used to identify which cues were key to sub groupings (functions) of decision outcomes; this showed that five cues were key to the most important subgrouping i.e. fit-to-drive versus not fit-to-drive. An expert panel and project advisory board reviewed and debated results, finally agreeing on an optimal consensus judgement policy for use in training. Training materials were then developed to train OTDAs to make optimal fitness-to-drive recommendations, and these can be viewed on the training websitewww.fitnesstodrive.com.
This paper reports on the second phase of the research program. The aim was to test the effectiveness of the training package on novices’fitness-to-drive recommen-dations, using a randomised controlled trial. The novices were pre-registration occupational therapy students. Oc-cupational therapy students learn how to analyse activ-ities of daily living as part of their pre-registration education; the depth of understanding is only at a basic competence level until post registration experience has been gained. In some countries, there may be a formal fitness to drive training programme available to be undertaken after working in the field, but this is still a rare opportunity. Therefore pre-registration students, as they are required to have basic knowledge in this field of practice, were suitable novices to train. It was important to determine if the experimental group of novices could
make fitness-to-drive recommendations that more
closely aligned to expert OTDAs recommendations fol-lowing training, when compared with recommendations made by control group novices.
Methods Study design
with two levels (control and intervention groups) and one within-subjects factor (time-point or training) with two levels (pre-training and post-training).
Case scenarios and training materials
The same 64 driving case scenarios used in the first Phase of the research, i.e. the optimal policy capturing study with the experts, were used in the RCT. These contained the 12 cues (independent variables), each with three levels used to create a range of driver skill level (see Additional file1). Of the 64 case scenarios, 47 were presented at pre-training and 17 at post-training. The number of scenarios used for pre-training and post-training used with the intervention group were calcu-lated using the ratio calculations for judgment analysis [16]. An example of a case scenario and the four possible fitness-to-drive recommendations are presented in Add-itional file2. The training materials used in the decision training intervention arm were developed using the find-ings of the optimal policy capturing study and provided a short description of background to the research and information to help the novices develop their capacity to make fitness-to-drive recommendations. The materials then included detailed information about how the ex-perts used cue levels of the most important cues when making fitness-to-drive recommendations. Overall, the more each cue suggested the client was a safe driver (for instance, if it was reported that the client’s vehicle hand-ling skills supported safe driving), the more likely the OTDA would be to make a judgement of ‘fit-to-drive – unrestricted licence’. In instances where the cue content raised concerns about the client’s ability to drive safely (for instance, where it was reported that physical skills did not support safe driving - no vehicle modifications / compensatory strategies suitable), it was then more likely that the OTDA would recommend ‘not fittodrive -suspend or cancel licence’.
Sample for the RCT study
The participants were occupational therapy students on pre-registration programmes (referred as ‘novices’ herein). As there are insufficient numbers of novice OTDAs at any one time in any one location, it was de-termined that using pre-registration students would serve the same purpose. It was reasoned that if the train-ing program was effective with pre-registration students, it would also be effective with occupational therapists training to be OTDAs. A sample size calculation identi-fied that 150 novice (75 in each group) were needed to be recruited to identify a medium effect (r= .3) of im-pact of the training intervention on novice decision making [17]. The participants were recruited from across the UK and Australia via Universities; they were invited to participate via programme leads who forwarded them
an invitation email. This contained the link to the re-search website where they could read the information sheet and indicate if they would like to participate. If they clicked on the request to participate they were ran-domised into the study. Participants were ranran-domised into control and intervention groups by the computer equivalent of tossing a coin when they registered to take part in the experiment. 289 pre-registration students were randomised into the study. Data collection oc-curred over a three month period.
Procedure
Ethical Approval for the study was obtained from Brunel University Research Ethics Committee (13/10/STF/02) and from La Trobe University Human Ethics Committee (HEC12–105). The trial was not required to be regis-tered as it was not a clinical intervention trial; it did not involve any impact on patients’care or clinicians’ prac-tice as it did not use health-related interventions to evaluate the effects on health outcomes. The study eval-uated the impact of an educational intervention on pre-registration students’ theoretical recommendations on fitness-to -drive only.
Participants were informed of the study but blinded to the randomisation element. To maintain blinding of in-vestigators, roles were carefully organised. Participants were automatically randomised into one of two condi-tions, either intervention, or control by the web site using coin toss approach. HG without awareness of re-spondents’allocations undertook the analysis. Only after analysis was complete were the allocations revealed.
Following randomisation, participants were e-mailed a password to log-on the website where some demographic information was collected. They were then presented with instructions and two practice scenarios. Participants were presented with the same set of scenarios that were used in Phase 1 of the research (the optimal policy capturing study during which the experts OTDAs made their recommen-dations). The set of scenarios comprised of 47 pre-training scenarios and 17 post-training scenarios. The scenarios in each set were presented one at a time and in a randomised order to each participant. Participants were asked to choose their recommendation for fitness-to-drive by click-ing one of the four fitness-to-drive recommendations as noted above. When the scenarios in the pre-training phase were completed, the intervention group was provided with the training information, whereas the control group was told how many scenarios they had completed and to con-tinue on to complete the whole task. On completion, par-ticipants were sent a £10/$15 honorarium gift voucher.
Data analysis
fit-to-drive: Suspend or cancel licence”; 2= “Not fit-to-drive - fit-to-driver rehabilitation to be completed (may re-quire reassessment)”; 3=“Fit-to-drive: with conditions such as using an automatic car”and 4=“Fit-to-drive: Un-restricted licence”. The data were treated parametrically [18]. Decisions made by novice participants were com-pared with the expert consensus recommendation, which was estimated as the mean of rates/decisions given by the experts for that scenario. The results from the control and intervention groups for pre- and post-training were then pooled, giving four sets of results. We compared the results across the groups at pre-training to determine if the two groups possessed similar levels of skill and then at post-training to examine the effect of the training as compared to experts.
Two methods were used to assess the effectiveness of the training intervention: Bland-Altman test [19–21], and Signal Detection Theory (SDT) [22–24]. The Bland-Altman test is based on analysis of differences between recommendations made by each novice and the expert consensus recommendations, and can provide a measure of agreement between each fitness-to-drive recommen-dations made by the individual novice and the expert consensus recommendation for the same case. Using the Bland-Altman test, for each case scenario, we subtracted the expert consensus recommendation (i.e. ranging from 1 to 4) from the recommendation made by the novice. We then calculated the mean of differences (referred to as the Bland-Altman statistic herein) for pre-training and post-training. We pooled the Bland-Altman statis-tics for the experimental and control groups and for pre- and post-training, giving four sets of results. In this study, the mean difference is used as a measure of agree-ment with the expert consensus. The closer the value of the mean difference to zero, the better the agreement between the expert consensus and the novice. Therefore, we were interested in whether the training intervention could shift this statistic to a value close to zero, i.e. bringing decisions made by novices closer to those made by the experts.
The second type of analysis undertaken was Signal De-tection Theory (SDT). SDT predicts accuracy of the fitness-to-drive recommendations made by novices, and detects any change in decision strategy of novices at post-training. Performance measures of SDT are fre-quently calculated using hit rate and false alarm rate. In relation to this research, the hit rate is described as the probability of correctly classifying a driver as‘not fit-to-drive’and the false alarm rate is the probability of incor-rectly classifying a driver as ‘not fit-to-drive’. Perform-ance of individual novice participants was evaluated with two measures in this study, the response bias (c) and ac-curacy (Az), the area under the receiver operating curve (ROC). The two measures,c and Az, were calculated as
described by Stanislaw and Todorov [23]. A change in response bias following training can be interpreted as a positive effect depending on its implications to real fitness-to-drive assessment practices. The area under the ROC curve (ROC area) provides a measure of ac-curacy, and an increased area under the curve is an indication of a positive effect of training intervention.
When response bias c equals 0, the novice favours
neither response. When c is positive, the novice tends to assess scenarios as noise (‘fit-to-drive’). When c is negative, the novice tends to assess scenarios as signal (‘not fit-to-drive’), and more likely to underestimate a driver’s capacity for fitness-to-drive (referred to as
‘low-risk’ decision strategy herein).
Available case scenarios were classified into signal and noise scenarios based on the fitness-to-drive recommen-dations made by expert consensus. To achieve this, the approach used by Harries et al. [25] was adopted. Mean expert recommendation across pre-training scenarios was calculated; mean = 2.15 with 95% confidence interval (CI) (2.006, 2.3). Those scenarios where the experts’ average rating was less than the 95% CI lower bound (2.006) were identified as signal scenarios; those scenar-ios where experts’average rating was greater than lower bound of the 95% CI constituted noise scenarios. This approach gave 24 signal scenarios and 23 noise scenarios for pre-training and 7 signal and 10 noise scenarios for post-training.
Data were then analysed as a rating task as outlined by Stanislaw and Todorov [23]. According to SDT, judges (in this case novice occupational therapy driver asses-sors) in a rating task with r possible outcomes (in the current study r= 4) base their decision (fitness-to-drive recommendation) on r-1 criteria; separate criteria is used to distinguish r possible rates/outcomes. For this, an it-erative procedure as described by Stanislaw and Todorov [23] was used; this resulted in three pairs of hit and false alarm rates for a novice at each time point. The three pairs of hit and false alarm rates for a time point (ptraining or post-(ptraining) were then used to calculate re-sponse bias values (c1, c2 and c3) and the area under ROC curve (Az). A two-factor mixed design analysis of variance (ANOVA) was conducted to examine the effect of training on group and time points, and the effect size was calculated.
Results
experimental and control groups were compared using t-tests for age and Mann-Whitney U test for stage of training and driving behaviour. No statistically significant differences were found: t(164) =−0.73, p= 0.46 for age; U = 3320, z = −0.13, p = 0.89 for stage of training; and U = 3344, z =− 0.05,p= 0.95 for driving behaviour.
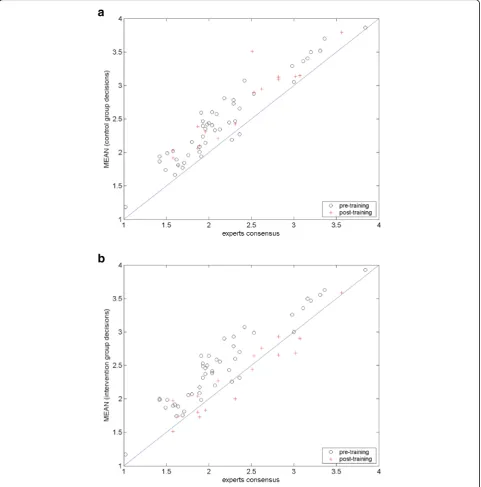
Mean novice decisions versus mean expert decisions Figure2 shows the mean score for each scenario, com-paring the mean score of the novices plotted against the mean score of the experts. Results from pre-training novices are shown as circles (o) and results from post-training novices as plus sign (+). The solid line along the diagonal is the equality line and represents perfect agree-ment. This graph enabled us to visually inspect novice consensus fitness-to-drive recommendations in a single graph and see whether the training had any positive ef-fect. Data points for untrained novices, for control group at both pre- and post-training as shown in Fig. 2a, and for the intervention group at the pre-training, as shown in Fig. 2b, are off the equality line. On the other hand, the data points for the trained novices are scattered closer to the equality line, as can be seen in Fig. 2b, for the intervention group at post-training. This indicates that the mean recommendations from trained novices are in stronger agreement with expert consensus than untrained novices. In other words, there was a positive effect of the training on the fitness-to-drive recommen-dations of novices.
Fig. 1Study Flow Chart (CONSORT Flow Diagram, [26])
Table 1Participant demographics
Characteristics Intervention Group (n= 70)
Control Group (n= 96)
Age in years (mean, SD) 26.1, 7.3 25.2, 7.5
Male 10, 14.3% 11, 11.5%
Female 60, 85.7% 85, 88.5%
Australia 24 39
UK 46 57
Stage
Final year, % within the group
34, 48.6% 46, 47.9%
Mid stage 22, 31.4% 34, 35.4%
First year 14, 20% 16, 16.7%
Driving behaviour
Blank 1, 1.4% 3 (3.1%)
Don’t hold a driving licence
4 (5.7%) 11 (11.4%)
Hold a licence; never drive
5 (7.1) 6 (6.3%)
Hold a licence; drive every few months
3 (4.3%) 3 (3.1%)
Hold a licence; drive monthly
1 (1.4%) 2 (2.1%)
Hold a licence; drive weekly 13 (18.6%) 6 (6.3%)
Hold a licence; drive daily 43 (61.4%) 65 (67.7%)
Agreement between novice and expert recommendations Agreement between novice and expert consensus fitness-to-drive assessments were calculated using the Bland-Altman test. For each participant, we subtracted the ex-pert consensus decision from each individual participant’s recommendations in a case-by-case manner. For each par-ticipant, we estimated the mean and standard deviation (SD) of differences at pre-training and post-training. We then pooled the results from control and intervention groups. Table2lists the mean and standard deviations of mean differences for each group. The mean Bland-Altman
statistics for the two study groups were very similar at pre-training: 0.30 for the control group and 0.33 for the intervention group. A positive value for the mean indi-cates a bias towards giving higher rates (i.e. tendency to recommend ‘fit-to-drive’) when compared to experts. At the post training, the control group showed no significant change from pre-training to post-training (t(96) =−.69; p= .5), whereas the intervention group exhibited a signifi-cant change (t(69) = 6.89; p< 0.001). For the intervention group, the mean difference compared with the experts’ recommendations dropped down to 0.02 with 95% CI
a
b
from−.13 to .09 at post-training. Effect size calculated at the post-training demonstrated a moderate effect (d = .69, r= .32) (Cohen, 1988). It can be seen that zero lies within the 95% confidence interval (CI) for the intervention group mean at the post-training. A conventional interpret-ation of the 95% CI would suggest no bias. However, the negative value of the median (−0.22) for the intervention group at post training indicates that a significant number of participants shifted their fitness-to-drive recommenda-tion strategy, and gave lower recommendarecommenda-tions (i.e. ten-dency to recommend ‘not fit-to-drive’) than they did before training.
The two-factor ANOVA confirmed that both group and time-point factors had significant main effects and a significant interaction between the two factors. There was a significant interaction between the group and time-point factors: F(1,164) = 50.02, p < .01. Partial eta sq. = .234, with a large effect. Simple main effect analysis revealed a significant effect for time-point in the inter-vention group but not in the control group. In other words, the intervention group were significantly different from the control group after receiving the training. Test-ing for simple main effects of group factor at both levels of time-point factor revealed that the group factor did not have a significant effect at pre-training (F(1,164) = .29,p= .59), but had significant effect at post-training (F(1,164) = 19.41, p< .01). Simple main effects of the time-point factor was significant in intervention group (F(1,164) = 78.8, p< .01), but not in the control group F(1,164) = .25, p = .62). The results demonstrated that the training altered the fitness-to-drive recommenda-tions of the novices who received the intervention.
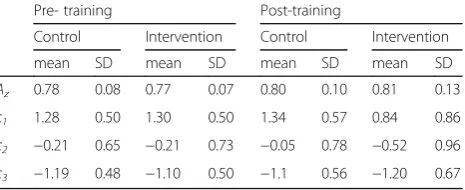
Accuracy of novices’fitness-to-drive recommendations The accuracy of novices’ fitness-to-drive recommenda-tions for the scenarios was made using Signal Detection Theory. We tested assumptions of normality using Kolmogorov-Simirnov test. Distributions were non-normal in one or other groups for hit rate, false alarm rate, response bias (c) and ROC area (Az). Therefore, a Mann-Whitney U test was used to test for the difference between the intervention (trained) and control groups to test significance level of difference between groups. At the post-training stagec1the intervention group was sig-nificantly different from pre-training, while no such
change was observed for the control group. The mean value ofc1for the intervention group changed from 1.30 to 0.84 (Table 3). The mean value of c2 also decreased for the intervention group at post-training, hence dem-onstrating a shift towards a‘low-risk’strategy. Therefore the training intervention increased novices’tendency to recommend ‘not fit-to-drive: suspend license’ instead of
‘not fit-to-drive: rehabilitation to be completed’. When interpreted against ‘real practice’, it could be said that the novices who had been trained were able to detect more cases of ‘not fit-to-drive’ than those who had not received the training.
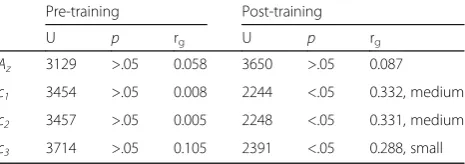
Results from the Mann-Whitney U test for the accur-acy and response bias measures and corresponding effect size measures (Glass rank biserial correlation) are given in Table4. Across pre-training and post-training (at both time points), the control (n = 96) and intervention groups (n = 70) did not differ significantly in accuracy (Az) of their decisions (Mann Whitney U = 3129, p > 0.05, and the Glass rank biserial correlation rg = < 0.1,
showing no effect in Cohen’s (1988) classification, at pre-training; and U = 3620, p > 0.05, and rg= < 0.1,
show-ing no effect, at post-trainshow-ing). At pre-trainshow-ing, the con-trol (n= 96) and intervention groups (n= 70) did not differ significantly in response bias measures (c1, c2and
c3). On the other hand, an independent samples
Mann-Whitney U test showed significant differences in re-sponse bias values at post-training: for example, in Table
4, U = 2244, p< 0.01 (two-tailed), the Glass rank biserial correlation rg= 0.33, with a medium effect for c1.
Discussion
The decision training was effective in demonstrating a medium effect in changing fitness-to-drive recommendations Table 2Comparison of control and training groups of novices, before and after training periods, with experts’consensus recommendations
Pre-training period Post-training period
med Mean
(SD)
95% CI for mean Med Mean (SD) 95% CI for mean
Lower bound Upper bound Lower bound Upper bound
Control 0.28 0.30 (0.36) 0.22 0.37 0.39 0.31 (0.41) 0.22 0.41
Intervention 0.28 0.33 (0.41) 0.24 0.42 −0.22 −0.02 (0.56) −0.13 0.09
SDStandard Deviation,CIConfidence Interval
Table 3Accuracy (Az, area under ROC curve) and bias (c1,c2andc3)
Pre- training Post-training
Control Intervention Control Intervention
mean SD mean SD mean SD mean SD
Az 0.78 0.08 0.77 0.07 0.80 0.10 0.81 0.13
c1 1.28 0.50 1.30 0.50 1.34 0.57 0.84 0.86
c2 −0.21 0.65 −0.21 0.73 −0.05 0.78 −0.52 0.96
among novices in the experimental group. Before train-ing, the novices tended to under-detect the drivers who were not safe to drive. In other words, they ‘missed’ these cases. Novices who were trained with the on-line training materials then adopted a low risk strategy which was more closely aligned with expert consensus. These novices thought that failing to detect or identify a not fit-to-drive case scenario had more serious conse-quences than making a recommendation of fit-to-drive for a driver who was potentially not fit-to-drive. There-fore, they were more able to detect more not fit-to-drive case scenarios. This resulted in a negative valued median for the mean differences between recommenda-tions made by trained novices and expert consensus from the Bland-Altman test, and change in response bias values from the signal detection theory. The changes in the mean differences and in response bias values for the trained novices were found to be statisti-cally significant.
Although trained novices did not fully achieve the experts’capacity of assessing fitness-to-drive, the train-ing influenced novices to detect more‘not fit-to-drive’ scenarios. Such a change in their fitness-to-driver rec-ommendation strategy may improve safety for road users and help identify unsafe drivers. Therefore, the training can be considered to provide an added benefit for the clients and other road users in terms of redu-cing risk.
Implications for practice and service delivery
Novice occupational therapy driver assessors will be able to use the intervention training, as provided on the web-site, to potentially improve their fitness-to-drive recom-mendations. They can reflect on the most influential cues used by the experienced occupational therapy driver assessors when determining, in the first instance, whether a client is fit-to-drive or not, and then further consider the client’s medical prognosis when reflecting on whether driver rehabilitation might be beneficial to facilitate a return to driving. The training materials helped the novices shift their decision criteria to be able to detect more not-fit-to-drive cases without decreasing
decision accuracy. The decision strategy adopted after training can be thought of an appropriate bias as it im-proves road safety by detecting more not-fit-to-drive cases. The decision training developed through this re-search also has the potential to increase the occupational therapy workforce for fitness-to-drive assessments of people with disabilities and older people. Novice occupa-tional therapists can use the website to improve their skill in this difficult area of practice, and gain confidence to work in this field.
Limitations of the study and future research directions The accuracy of the novices’fitness-to-drive recommenda-tions were measured by comparing their decisions with an expert consensus recommendation. Absence of an abso-lute truth may depress the accuracy levels calculated. However, the fact that the experts remained fairly consist-ent in their decisions, as evidenced by the high ICC(2,1) = .97 (95% CI .96–.98) in Phase 1 of this research program [14], provides confidence in their expertise. Although this study was fully powered, many novices did drop out, and others in the intervention group might have not studied the training information very carefully nor paid attention when making recommendations due to apathy or desire to complete the task quickly, thus reducing the overall ac-curacy of the findings.
While this research included a consensus policy derived from expert OTDAs in the UK and Australia, the research should be expanded to include certified driver rehabilita-tion specialists from North America, and Europe. Further research should also be conducted to test the ecological validity of the expert fitness-to-drive policy developed in this research. Predictions of client fitness-to-drive derived from our research can be tested against real-world fitness-to drive recommendations fitness-to determine how well the pol-icy can predict real-world judgments.
Conclusions
The decision training was shown to be effective in assist-ing novices to shift their fitness-to-drive recommenda-tions so as to detect more not fit-to-drive cases without decreasing decision accuracy. The decision strategy adopted by the novices after training can be thought of as an appropriate bias as it improves road safety for users by detecting more not fit-to-drive cases. Training novices to make better fitness-to-drive decisions means occupational therapists are more likely to work in this field, where staff shortages have been documented. More OTDAs, making more accurate fitness-to-drive recom-mendations will potentially lead to a reduction in unsafe drivers, and an increase in quality of life for those drivers who are safely able to commence or resume driving. Table 4Independent samples Mann-Whitney U test (two tailed
p) and Glass rank biserial correlation rgfor accuracy (Az) and bias (c1,c2andc3) measures
Pre-training Post-training
U p rg U p rg
Az 3129 >.05 0.058 3650 >.05 0.087
c1 3454 >.05 0.008 2244 <.05 0.332, medium
c2 3457 >.05 0.005 2248 <.05 0.331, medium
Additional files
Additional file 1:Cues and Cue levels for guiding fitness-to-drive recommendations. (DOCX 19 kb)
Additional file 2:Example of case scenario. (DOCX 15 kb)
Abbreviations
ANOVA:ANalysis Of VAriance; CI: Confidence Interval; ICC: Intra-class Correlation Coefficient; OTDA: Occupational Therapy Driver Assessor; RCT: Randomised Controlled Trial; ROC: Receiver Operating Curve; SD: Standard Deviation; SDT: Signal Detection Theory; SJT: Social Judgement Theory
Acknowledgements
We would like to thank members of project advisory group (Professor Mary Gilhooly and Professor Mark Williams, Professor Peter Ayton, Professor Richard Tay, Dr. Catherine Lant), the expert OTDA panel (Meg Marmo, Jenny Wise and Kirsty Flint) and service user group (Tamalina Al-Dakkak, Ann Bunce, Jon and Rodney Hutchings, Judith Sinclair, Hilary Strickland).
Funding
This work was supported by the UK Occupational Therapy Research Foundation, Research Priority Grant scheme, 2012. The authors declare that the funder had no role in the design of the study, and collection, analysis and interpretation of data and in writing the manuscript.
Availability of data and materials
The datasets from this study are available from the corresponding author on reasonable request. The training materials and the training tool are currently available on an open-access websitewww.fitnesstodrive.com.
Authors’contributions
PH and CU designed the research, contributed to the analysis and interpretation of the data and critically reviewed the content of this paper. MD contributed to design of data collection materials and training information used in the study, and managed the day to day study activities. HG undertook the analysis and contributed to the interpretation of the results. CT developed the web site for the study and LH designed the content for the web platform. All authors read and approved the final version of the manuscript.
Ethics approval and consent to participate
Ethical Approval for the study was obtained from Brunel University Research Ethics Committee (13/10/STF/02) and from La Trobe University Human Ethics Committee (HEC12–105). Informed consent was obtained online by firstly asking participants to read the participant information text and then to consent via completing a tick box, before access to participation online could commence.
Consent for publication
Not applicable
Competing interests
The authors declare that they have no competing interests.
Publisher’s Note
Springer Nature remains neutral with regard to jurisdictional claims in published maps and institutional affiliations.
Author details
1Brunel University London, London, UK.2Central Queensland University,
Melbourne, Australia.3Curtin University, Perth, Australia.4Jonkoping University, Jonkoping, Sweden.5Brunel University London, London, UK. 6Nuffield Trust, London, UK.7Imperial College London, London, UK. 8University of Cambridge, Cambridge, UK.
Received: 21 November 2016 Accepted: 26 January 2018
References
1. Korteling JE, Kaptein NA. Neuropsychological driving fitness tests for brain-damaged subjects. Arch Phys Med Rehabil. 1996;77(2):138–46.
2. American Medical Association. Physician’s Guide to Assessing and Counselling Older Drivers (2ndEd). 2012. National Highway Traffic Safety Administration. 3. Department of Health. Allied Health Professions Stroke Toolkit. 2012http://
www.networks.nhs.uk/nhs-networks/ahp-networks/ahp-qipp-toolkits. Accessed 2 April 2012.
4. Royal College of Physicians. Occupational therapy concise guide for stroke. 2016.https://www.strokeaudit.org/SupportFiles/Documents/Guidelines/ Profession-Specific-Guides/6-Occupational-Therapy.aspx. Accessed 2 Feb 2018. 5. Fildes B. Safety of older drivers: strategy for future research and action initiatives.
Clayton, Monash University Accident Research Centre. 1997. ISBN: 0-7326-0698-5. 6. Unsworth CA. Development and current status of occupational therapy
driver assessment and rehabilitation in Victoria, Australia. Aust Occup Ther J. 2007;54:153–6.https://doi.org/10.1111/j.1440-1630.2006.00617.x.
7. Ralston LS, Bell SL, Mote JK, Rainey TB, Brayman S, Shotwell M. Giving up the car keys. Physical and occupational therapy in geriatrics. 2001;19:292– 302.https://doi.org/10.1080/J148v19n04_05.
8. Unsworth CA, Lovell R, Terrington N, Thomas S. Review of tests contributing to the occupational therapy off-road driver assessment. Aust Occup Ther J. 2005;52:57–74.
9. Vrkljan BH, McGrath CE, Letts LJ. Assessment tools for evaluating fitness to drive: a critical appraisal of evidence. Can J Occup Ther. 2011;78(2):80–96. 10. Patomella AH, Tham K, Kottorp A. P-drive: assessment of driving performance
after stroke. J Rehabil Med. 38:273–9.
11. Unsworth CA, Chan S-P. Determining fitness-to-drive among drivers with Alzheimer’s disease or cognitive decline. Br J Occup Ther. 2016;79(2):102–10. 12. Caust S. Results of OT report audit. Melbourne: VicRoads Medical Review
Day Conference; 2010.
13. Harries PA, Tomlinson C, Notley E, Davies M, Effectiveness GK. Of a decision-training aid on referral prioritization capacity: a randomized controlled trial. Journal of. Med Decis Mak. 2012;32(6):779–91.https://doi.org/10.1177/ 0272989X12443418.
14. Unsworth C, Harries PA, Davies M. Using social judgment theory method to examine how experienced occupational therapy driver assessors use information to make fitness-to-drive. Br J Occup Ther. 2015;78(2):109–20.
https://doi.org/10.1177/0308022614562396.
15. Unsworth CA. Using social judgment theory to study occupational therapists’ use of information when making licensing recommendations to older and functionally impaired drivers. Am J Occup Ther. 2007;61(5):493–502.https://doi. org/10.5014/ajot.61.5.493.
16. Cooksey RW. Judgement analysis: theory, methods and applications. London: Academic Press; 1996.
17. Cohen J. Statistical power analysis for the behavioral sciences. 2nd ed. New Jersey: Lawrence Erlbaum Associates; 1988. ISBN 0-8058-0283-5.
18. Agresti A. Categorical Data Analysis. 2nd ed. Wiley-Blackwell; 2002. 19. Bland JM, Altman DG. Statistical methods for assessing agreement between
two methods of clinical measurement. Lancet. 1986:307–10.
20. Brennan P, Silman A. Statistical methods for assessing observer variability in clinical measures. Br Med J. 1992;304(6840):1491–4.
21. Rankin G, Stokes M. Reliability of assessment tools in rehabilitation: an illustration of appropriate statistical analyses. Clin Rehabil. 1998;12(3):187–99.
https://doi.org/10.1191/026921598672178340.
22. Macmillan NA, Kaplan HL. Detection theory analysis of group data: estimating sensitivity from average hit and false-alarm rates. Psychol Bull. 1985;98(1):185–99.
23. Stanislaw H, Todorov N. Calculation of signal detection theory measures. Behav Res Methods Instrum Comput. 1999;31(1):137–49.
24. Swets JA. Measuring the accuracy of diagnostic systems. Science. 1988; 240(4857):1285–93.https://doi.org/10.1126/science.3287615.
25. Harries PA, Yang H, Davies M, Gilhooly K, Thompson C. Identify and enhancing risk thresholds in the detection of elder financial abuse: a signal detection analysis of novice health and social care professionals' decision making. BMC Medical Education. 2014;14(1044)https://doi.org/10.1186/s12909-014-0268-z. 26. CONSORT Flow Diagram: Transparent Reporting of Trials.
![Fig. 1 Study Flow Chart (CONSORT Flow Diagram, [26])](https://thumb-us.123doks.com/thumbv2/123dok_us/387855.1531507/6.595.59.539.87.344/fig-study-flow-chart-consort-flow-diagram.webp)