R E S E A R C H
Open Access
Genotypic variation in spatiotemporal
distribution of canopy light interception
in relation to yield formation in cotton
XING Fangfang
1,2, HAN Yingchun
1,2, FENG Lu
1,2, ZHI Xiaoyu
1,2, WANG Guoping
1,2, YANG Beifang
1,2, FAN Zhengyi
1,2,
LEI Yaping
1,2, DU Wenli
1,2, WANG Zhanbiao
1,2, XIONG Shiwu
1,2, LI Xiaofei
1,2and LI Yabing
1,2*Abstract
Background:Within-canopy interception of photosynthetically active radiation (PAR) impacts yield and other agronomic traits in cotton (Gossypium hirsutumL.). Field experiments were conducted to investigate the influence of 6 cotton varieties (they belong to 3 different plant types) on yield, yield distribution, light interception (LI), LI
distribution and the relationship between yield formation and LI in Anyang, Henan, in 2014 and 2015.
Result:The results showed that cotton cultivars with long branches (loose-type) intercepted more LI than did cultivars with short branches (compact-type), due to increased LI in the middle and upper canopy. Although loose-type varieties had greater LI, they did not yield significantly higher than compact-type varieties, due to decreased harvest index. Therefore, improving the harvest index by adjusting the source-to-sink relationship may further increase cotton yield for loose-type cotton. In addition, there was a positive relationship between reproductive organ biomass accumulation and canopy-accumulated LI, indicating that enhancing LI is important for yield improvement for each cultivar. Furthermore, yield distribution within the canopy was significantly linearly related to vertical LI distribution.
Conclusion:Therefore, optimizing canopy structure of different plant type and subsequently optimizing LI distribution within the cotton canopy can effectively enhance the yield.
Keywords:Cotton cultivars, Light interception, Plant type structure, Boll distribution, Yield
Background
The capacity of the crop canopy to intercept and effi-ciently use solar radiation can greatly influence crop growth and development. Photosynthetically active radi-ation (PAR), consisting of wavelengths that can be absorbed by green plants and used for photosynthesis (Madakadze et al. 1998; Maddonni and Otegui 1996; McIntyre et al.1996), is the major driver of plant photo-synthetic processes(Meir et al.2002). Spatial canopy inter-ception determines how much PAR reaches the elements of the canopy and helps to determine the optimal canopy form for a certain crop. Light interception (LI) by the can-opy is an important environmental factor, in addition to
genetic factors (Bai et al.2016), that determines the plant architecture type (Xue et al.2015).
Knowing the factors that affect and determine yield and the ability to predict the yield of crops through in-season measurements are of paramount importance. Crop yield is highly correlated with canopy light interception, leaf area index (LAI) and above ground biomass in vegetables, soy-beans, maize, sorghum, cotton and rice (Mo et al. 2005; Zarate-Valdez et al. 2012). The amount of light inter-cepted by the canopy and Radiation Use Efficiency (RUE), which is the efficiency of converting the captured radi-ation into biomass, are crucial elements for crop produc-tion and development (Louarn et al. 2008). LI is determined by canopy configuration (Chen et al. 1997; Dauzat et al. 2008), which increases not only land prod-uctivity but also resource use efficiency. Some studies have indicated that leaf area components have the greatest effect on light intensities (Baldissera et al. 2014). Among
* Correspondence:[email protected]
1Zhengzhou Research Base, State Key Laboratory of Cotton Biology,
Zhengzhou University, Zhengzhou 450000, Henan, China
2Institute of Cotton Research of Chinese Academy of Agricultural Sciences,
Anyang 455000, Henan, China
the characteristics that increase economic yield, the canopy microclimate is considered very important. PAR interception can be altered by canopy construction (Barthélémy and Caraglio 2007) and leaf area (Vargas et al. 2002). Therefore, in-depth exploration of the precise characteristics of light distribution in a crop canopy is necessary for improving crop productivity.
In cotton (Gossypium hirsutumL), adequate LI is essen-tial for growth. Understanding the effects of plant archi-tecture on radiation interception by cotton can be very useful for optimizing canopy architecture to intercept more light. The goal of cotton agronomy is to improve cotton yields through optimal management, but this ac-complishment is made more difficult by the perennial growth habit of cotton (Kaggwa-Asiimwe et al. 2013). In addition, there is limited knowledge on how sink-source relationships and biomass production are affected by light interception(Wang et al. 2016) and how these relation-ships may be manipulated by different cultivars. The opti-mal spatial distribution of light and the specific boll spatial distribution are important for the efficient utilization of light. Therefore, identifying and selecting optimal cotton cultivars with a high efficiency for intercepting and con-verting solar radiation, as well as better understanding the characteristics of radiation interception and dry matter accumulation in more detail, are crucial.
Few studies have compared spatial LI and biomass production in different cultivars, and LI in different ver-tical and horizontal zones of the canopy has not yet been determined. In this study, the primary objective was to determine how different cotton cultivars alter the can-opy LI in different vertical and horizontal zones of the canopy, the boll spatial distribution and the seed cotton yield. A secondary objective was to evaluate how the boll spatial distribution, biomass, LAI and seed cotton yield were altered by LI variation.
Results
Yield and yield components of different cultivars
In this study, yield and yield components were signifi-cantly different among different cultivars (Table 1). The
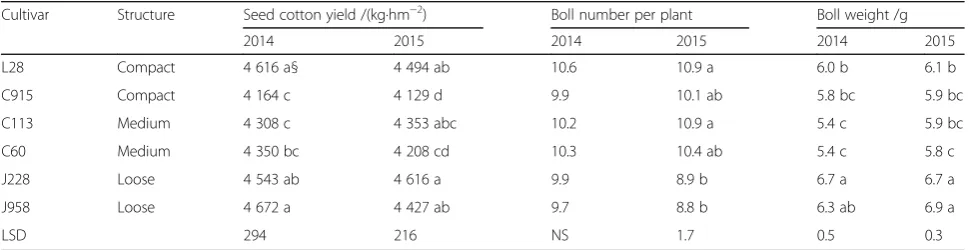
seed cotton yields of different varieties ranged from 4 164 to 4 672 kg·hm−2 and from 4 129 to 4 616 kg·hm−2 in 2014 and 2015, respectively. J958 and L28 had a higher yield than did C915, C113 and C60 but a yield similar to that of J228 in 2014. In 2015, J228 had the greatest yield, 4 616 kg·hm−2, while C915 had the lowest yield, 4 129 kg·hm−2. Regarding the yield components, no sig-nificant difference was observed in boll number per plant in 2014, but in 2015, C113 and L28 had more bolls per plant than did J228 and J958. J228 and J958 had the great-est boll weight, while C60 and C113 had the lowgreat-est boll weight among all cotton varieties in both years. No obvious difference in cotton yield between plant types was ob-served. However, the compact-type cultivar L28 had rela-tively more bolls per plant (10.6 bolls·plant−1in 2014 and 10.9 bolls·plant−1in 2015), while the loose-type varieties J958 and J228 had relatively heavier bolls (6.7 and 6.3 g·boll−1in 2014, 6.7 and 6.9 g·boll−1in 2015).
The spatial yield distribution within canopy of different cultivars
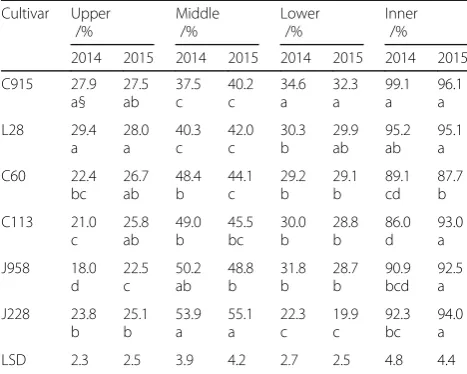
The spatial yield distribution was significantly different both vertically and horizontally among cotton varieties and plant types (Table2). L28 and C915 had higher yield (29.4% and 27.9%) while J958 had lower yield (18.0%) distributed in the upper canopy in 2014. In 2015, similar trends were also observed, with L28, C915 and C60 hav-ing more yield (28.0%, 27.5% and 26.7%) and J958 havhav-ing less yield (22.5%) distributed in the upper canopy. In the middle canopy, J228 had the greatest yield distribution in both years (53.9% in 2014 and 55.1% in 2015). In con-trast, C915 and L28 had the least yield distribution in the middle canopy in both years. In the lower canopy, C915 possessed the greatest yield distribution, while J228 possessed the lowest yield distribution in both years. It is interesting that loose-type cultivars had more yield distributed in the middle canopy, while compact-type cultivars had more yield distributed in the upper and lower canopy.
Horizontally, C915 had more yield (99.1%) distributed in the inner part of the plant than did other varieties,
Table 1Varietal effects on cotton yield and yield components in 2014 and 2015
Cultivar Structure Seed cotton yield /(kg·hm−2) Boll number per plant Boll weight /g
2014 2015 2014 2015 2014 2015
L28 Compact 4 616 a§ 4 494 ab 10.6 10.9 a 6.0 b 6.1 b
C915 Compact 4 164 c 4 129 d 9.9 10.1 ab 5.8 bc 5.9 bc
C113 Medium 4 308 c 4 353 abc 10.2 10.9 a 5.4 c 5.9 bc
C60 Medium 4 350 bc 4 208 cd 10.3 10.4 ab 5.4 c 5.8 c
J228 Loose 4 543 ab 4 616 a 9.9 8.9 b 6.7 a 6.7 a
J958 Loose 4 672 a 4 427 ab 9.7 8.8 b 6.3 ab 6.9 a
LSD 294 216 NS 1.7 0.5 0.3
except for L28 (95.2%) in 2014, and C113 had the least yield in the inner part of the plant (86.0%) (Table 2). In 2015, C60 had the least yield (87.7%) distributed in inner part of the plant, but other varieties did not show any significant difference in the yield distribution of the inner part of the plant. Therefore, cotton varieties with compact plant type showed relatively more yield distri-bution in the inner part of the plant only in 2014.
LI spatial distribution in canopies of different cultivars To study the LI spatial distribution, the values of the LI were calculated using the trapezoidal rule. There was a quadratic relationship between the LI of different cotton varieties and days after sowing. The canopy LI was significantly influ-enced by cotton cultivar and plant type (Fig.1). No varietal
differences were shown at earlier stages of growth, but var-ietal differences occurred from 60 days after sowing in 2014 and 80 days after sowing in 2015. LI of different cotton var-ieties peaked at the flowering and boll-setting stages in 2014 (90–100 d after sowing) and 2015 (100–110 d after sowing) and declined thereafter. LI peak values ranged from 0.49 to 0.68. The accumulated LI of compact-type varieties was lower than that of loose-type cotton cultivars. The LI peak value of J958 was the highest among that of all cultivars.
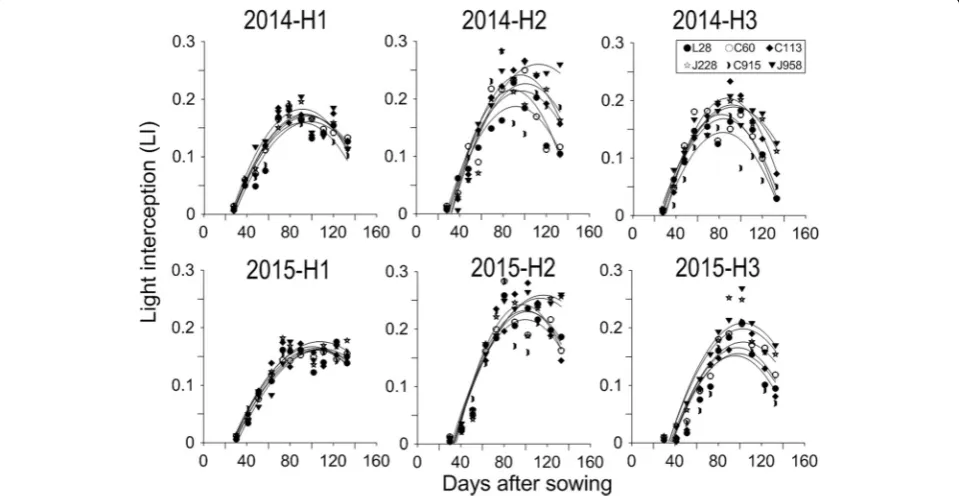
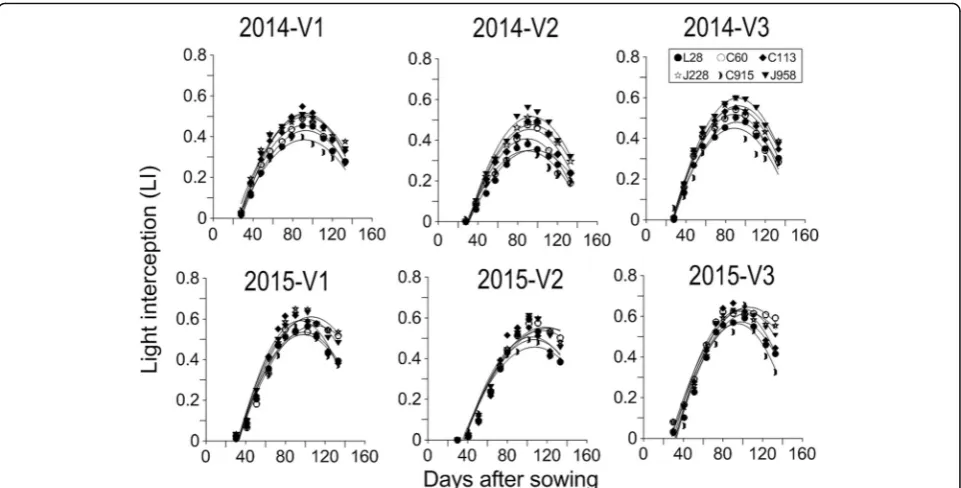
To further study the LI spatial distribution within can-opy, the LI of different cultivars was divided into three equal parts in horizontal and vertical levels as shown in Fig.2. These levels were designated H-1, H-2, H-3, V-1, V-2 and V-3 from bottom to top and left to right. LI had a quadratic relationship with days after sowing in both horizontal and vertical zones (Figs.3,4). Vertically, due to different canopy structures, loose-type cultivars inter-cepted more light than did compact-type cultivars in all zones except for H1. Similar to the canopy, varietal dif-ferences in LI occurred from the squaring stage (60–80 d) and peaked in the flowering and boll-setting stages (90–120 d). In 2014, the compact-type cultivars L28 and C915 had less LI in H1 than did the loose-type varieties J958 and J228. However, in 2015, the opposite result oc-curred in that L28 and C915 had more LI than did J958 in H1 (Fig. 3). Regarding the different vertical parts within the canopy, the LI was highest in H2, followed by H3 and then H1 in both years. The LI values ranged from 0.01 to 0.18, 0.06 to 0.28, and 0.01 to 0.27, for H1, H2 and H3, respectively. In horizontal zones (Fig. 4), loose-type cultivars intercepted more LI than did com-pact cultivars in V2 in both years. The greatest varietal difference in LI in V2 occurred at 90–100 d after sowing in 2014 and at 90–120 d after sowing in 2015. In 2015, loose-type cultivars also intercepted more PAR than did Table 2Spatial yield distribution within the cotton canopies of
different cultivars in 2014 and 2015
Cultivar Upper Middle Lower Inner
/% /% /% /%
2014 2015 2014 2015 2014 2015 2014 2015
C915 27.9 a§ 27.5 ab 37.5 c 40.2 c 34.6 a 32.3 a 99.1 a 96.1 a L28 29.4 a 28.0 a 40.3 c 42.0 c 30.3 b 29.9 ab 95.2 ab 95.1 a C60 22.4 bc 26.7 ab 48.4 b 44.1 c 29.2 b 29.1 b 89.1 cd 87.7 b C113 21.0 c 25.8 ab 49.0 b 45.5 bc 30.0 b 28.8 b 86.0 d 93.0 a J958 18.0 d 22.5 c 50.2 ab 48.8 b 31.8 b 28.7 b 90.9 bcd 92.5 a J228 23.8 b 25.1 b 53.9 a 55.1 a 22.3 c 19.9 c 92.3 bc 94.0 a
LSD 2.3 2.5 3.9 4.2 2.7 2.5 4.8 4.4
§ Similar lower case letters indicate no significant difference among cotton varieties at theP = 0.05level
compact cultivars in V1 and V3, which did not occur in 2014. Among the three horizontal parts, V3 had the greatest LI, followed by V1, and V2 had the lowest LI. The LI ranged from 0.01 to 0.64, 0 to 0.59, and 0.01 to 0.66, for V1, V2 and V3, respectively.
LAI and accumulated biomass
Due to the different cotton planting types, LAI varied among cotton cultivars (Fig. 5). The peak values of LAI
occurred later in 2015 than 2014. Varietal differences were small at the earlier stages of growth and then increased. LAI peak values ranged from 2.7 to 3.6. The LAI peak value of J228 was 3.58 in 2014 and 3.24 in 2015, the high-est among all cultivars. C915 had the minimum LAI peak values (2.7 in both years). In addition, compact-type culti-vars tended to have a lower LAI.
Two major determinants of high productivity in a cotton cultivar were its ability to produce high levels of assimilates by photosynthesis and to partition a
Fig. 2LI spatial distribution of C915 and J228 in 2014
high proportion of those assimilates efficiently into economically important organs. The total biomass differed between cotton varieties and plant types. Loose-type cotton cultivars had greater biomass than did compact-type cotton cultivars. J958 achieved the highest total biomass of 13 936 kg·hm−2and C915 achieved the lowest total biomass of 11 879 kg·hm−2. J958 also had a higher total biomass (13 489 kg·hm−2) in 2015, but this was not significantly different from those of J228 and L28. C60 had the lowest total biomass in 2015. Harvest index was significantly different among cotton cultivars and plant types: compact-type cotton cultivars had a higher
harvest index than did the loose-type cotton cultivars in both years (Table3).
Relationship between LI and yield formation in different cultivars
Biomass accumulation was linearly related to the LI in both years, with R2values of 0.97 and 0.98 in 2014 and 2015, respectively, although there was no significant re-lationship between seed cotton yield and LI (Fig.6). The biomass of vegetative organs increased with LI and then decreased, while the biomass of reproductive organs continuously increased with LI (Fig.7).
Fig. 4LI horizontal distribution of six different cotton varieties with different plant types during the cotton growth period in 2014 and 2015
Using the method that we used to analyze yield distri-bution, LI distribution within canopy was also calculated (data not shown). Based on regression analysis, a signifi-cant linear relationship was found between vertical cot-ton yield distribution and LI distribution (R2= 0.74 in 2014 andR2= 0.69 in 2015), indicating that yield distri-bution within canopy is related to LI distridistri-bution. How-ever, no significant relationship was observed between horizontal yield distribution and LI distribution, due to different plant types resulting in different zones for the inner and outer parts of the plant (Fig.8).
Discussion
Cotton yield and yield distribution of different cultivars and plant types
Cotton yield was significantly affected by cotton cultivar (Girma et al.2007). In this study, the cotton yields of six different cultivars ranged from 4164 to 4672 kg·hm−2 and 4129 to 4616 kg·hm−2 in 2014 and 2015,
respectively. The optimal cotton yield was achieved by J958 and L28 in 2014 and by J228 in 2015, indicating the different performance of cotton cultivars in different en-vironments. Yield was found to be a function of both boll number and boll weight, with the relative effects of each influenced by cultivar (Wang et al. 2009). In this study, J228 and J958 attained a higher cotton yield mainly due to the greater average boll weight, while L28 did so mainly due to a greater boll number per plant. Cotton yield varied significantly within plants (Bednarz et al. 2000), and yield difference can be traced to differ-ent positions within a cotton plant (Bednarz et al.2006). Cotton boll distribution is very cultivar-dependent (Snowden et al.2013). Our study showed that both verti-cal and horizontal yield distribution were affected by cotton variety and plant type. In general, loose-type cul-tivars had more bolls in the middle of the canopy, while compact-type cultivars had more bolls at the top and bottom of the plant, suggesting that compact-type Table 3Effect of cotton cultivar on cotton biomass accumulation and biomass partitioning in 2014 and 2015
Cultivar Total biomass Vegetative biomass Reproductive biomass Harvest index
/(kg·hm−2) /(kg·hm−2) /(kg·hm−2) /%
2014 2015 2014 2015 2014 2015 2014 2015
J958 13 936 a§ 13 489 a 7 800 a 7 333 A 6 137 b 6 155 cd 44.0 d 45.6 c
J228 13 429 ab 13 366 a 6 544 b 6 710 B 6 885 a 6 656 ab 51.3 b 49.8 b
C113 13 097 bc 12 606 bc 6 222 bc 6 265 C 6 875 a 6 341 b 52.5 ab 50.3 b
C60 12 457 c 12 416 bc 6 428 b 6 602 Bc 6 029 b 5 815 d 48.4 c 46.8 c
L28 12 867 c 12 952 ab 5 874 cd 6 159 Cd 6 993 a 6 793 a 54.3 a 52.4 a
C915 11 879 d 12 181 c 5 582 d 5 726 D 6 297 b 6 455 abc 53.0 ab 53.0 a
LSD 769 698 436 471 352 386 2.1 1.8
§ similar lower case letters indicate no significant difference among cotton varieties at theP = 0.05level
varieties distributed yield more than did loose-type var-ieties. Cotton bolls located in the middle canopy weighed more than those in the lower and upper canopy (CRI 2013). Therefore, a higher boll distribution in the middle canopy might be another reason for the greater boll weight of loose-type cotton varieties (J958 and J228), in addition to genetic difference. Cotton varieties with a compact plant type showed relatively more yield distribution in the inner part of the plant only in 2014, but this did not occur in 2015. During the cotton growth period, with more rainfall in 2014, fruiting branches grew faster, especially in loose-type varieties, resulting in relatively greater outer yield distribution for loose-type than for compact-type cotton varieties.
Canopy LI and LI distribution of different varieties and plant types
As the primary source of energy, light plays an ant role in plant growth. LI by the canopy is an import-ant factor determining biomass production and crop development (Chenu et al.2005; Escobar-Gutiérrez et al. 2009). The interception of light by the crop canopy is complicated and is affected by the canopy architecture (Mariscal et al.2000). The canopy structure of a crop is determined largely by the plant type. In this study, the loose-type cultivars intercepted more LI than did
Fig. 7Relationships of LI with vegetative biomass and reproductive biomass for six cotton varieties with different plant types in 2014 and 2015
compact-type cultivars in both years, mainly due to the greater LI in full-flowering and boll-setting stages. The peak LI occurred later in 2015 relative to 2014 due to the lower temperature and less rainfall in 2015 resulting in slow plant growth and development. The greater LI of loose-type cotton varieties could be explained by higher peak LAI, which was a determinant factor of LI by the cotton canopy (Reynolds et al.2000). Plant type can also affect canopy light distribution(Arduini et al. 2006). LI distribution within canopy was significantly different among cotton cultivars and plant types both vertically and horizontally. The loose-type cultivars intercepted more light than did the compact-type cultivars in H2, H3 and V2 in both years, indicating that the difference in LI of the whole canopy among different cotton cultivars mainly resulted from the LI of the middle and upper can-opy and of the outer cancan-opy. Due to the longer fruiting branches and higher LAI of loose-type cotton cultivars, the light transmittance to the lower canopy is relatively less compared with that to the upper and middle canopy.
The relationship between yield and LI in different cultivars and plant types
Optimum canopy structure is the basis of improving photosynthetic efficiency and achieving high crop yields(Da Silva et al. 2014; Zhang et al. 2008). In this study, a significant linear relationship was observed between total biomass accumulation and accumulated LI, which was consistent with previous studies (Xue et al. 2015; Zarate-Valdez et al. 2012; Monteith 1977). However, no obvious relationship was observed between cotton yield and the total canopy-accumulated LI, which was also found by Zarate-Valdez et al. (2012) and Xue et al. (2015). A possible explanation for this result might be the different transport efficiency of LI to reproductive organs as indicated by different harvest index values. However, for each cultivar, cotton reproductive organs biomass was positively related to LI, indicating that in-creasing LI can effectively improve cotton yield for each cultivar. In addition, there was a linear relationship be-tween vertical cotton yield distribution and LI distribu-tion within the canopy, indicating that yield distribudistribu-tion within the canopy is in accordance with LI distribution. Therefore, proper canopy architecture can optimize yield distribution and subsequently improve cotton yield and fiber quality by optimizing LI distribution.
Methods
Experimental design
The field experiment was conducted in 2014 and 2015 at the experimental farm of the Cotton Research Institute of the Chinese Academy of Agricultural Sciences in An-yang, Henan, China (36° 06 ‘N, 114° 21’ E). The field design was a randomized complete block with six
different selected cotton cultivars belonged to 3 different plant types. J958 and J228 had a loose plant type and tended to have horizontally fruiting branches. C60 and C113 had a medium plant type with shorter branches and leaves of medium size. L28 and C915 had a compact plant type with short fruiting branches and close-set fruiting nodes. The experimental design was replicated three times with a plot size of 8 × 8 m and the row orientation was north to south. The sowing dates were April 30, 2014 and April 24, 2015, respectively, and manually thinned out to a desired density of 60 000 plants · hm−2 at the two-leaf stage. The weather condi-tions for the area are provided in Table4.
In both years, the land was plowed and irrigated in early spring before planting. The cotton was fertilized with 225 kg·hm−2N, 150 kg·hm−2P2O5and 225 kg·hm−2K2O before sowing. Supplemental irrigation was provided at a total volume of approximately 45 mm by flooding the furrows during the flowering stage. Other field manage-ment activities were conducted according to local agro-nomic practices.
Data collection
PAR interception and transmission in the canopy
We measured transmission PAR (TPAR) and reflection PAR (RPAR) in different canopy layers every ten days using a portable 1.0 m light quantum sensor (LI-191SA, LI-COR, Lincoln, NE,USA) and a data logger (LI-1400, LI-COR, Lincoln, NE, USA). The measurement by the spatial grid sampled method in the same sample area of each plot during the crop season between the square stage and maturity in each year and were performed 1 h before solar noon under clear skies. The sample row was divided 5 measuring position between two rows in the horizontal distance. Similarly, in the vertical direction, we divide canopy into layers of every 20 cm. In addition, the incident PAR (IPAR) above the canopy was automat-ically monitored and recorded at every 5 s intervals.
Table 4Weather information for the cotton growth season in 2014 and 2015
Month Accumulated
temperature≥10 °C / °C
Precipitation /mm Sunshine time /h
2014 2015 2014 2015 2014 2015
4 487.7 359.9 79.6 31.1 145.1 224.4
5 737.3 642.1 33.8 59.7 220.5 239.9
6 769.8 781.7 116.7 19.9 163.6 193.6
7 828.7 837.8 130.9 72.4 168.6 221.2
8 761.8 801.5 65.7 29.0 160.9 193.8
9 612.1 633.9 193.5 17.2 87.7 176.9
The TR (transmitted PAR rate), RR (reflected PAR rate),IR (intercepted PAR rate) were calculated using the following equations (Zhi et al.2014):
TR¼TPAR=IPAR ð1Þ
RR¼RPAR=IPAR ð2Þ
IR¼1−TR−RR ð3Þ
Estimation of PAR distribution in the canopy
In other positions within the canopy, IR and TR values were calculated by spatial interpolation using the follow-ing equation:
Z Xð Þ ¼0
Xn
i¼1
λiZ Xð Þi ð4Þ
where Z(X0) is the measured PAR value;λiis the coefficient
of the sample, and unbiased condition =1 was employed.
Furthermore, based on the minimum variance, the Kriging equation was stated as follows:
Xn
i¼1
λir x i;xjþϕ¼r xð i;x0Þ ð5Þ
where r(xi, xj) is the measured value of the variation function; φ is the Lagrangian, r(xi, x0) is the measured and calculated PAR, and x0is the estimated value of the calculated point as computed by the unbiased estimate.
Calculation of accumulated TR within the whole canopy The following trapezoidal rules based on the Surfer soft-ware V11 (Golden Softsoft-ware Inc., USA) was used to calcu-late accumucalcu-lated TR within the whole canopy.
Si¼Δx .
2½hði;1Þþ2hði;2Þþ2hði;3Þþ ……þ2hði;n−1Þþhði;nÞ
ð6Þ
Volume¼Δy.
2½s1þ2s2þ2s3þ……2sn−1þsn ð7Þ
where the coefficient vector is [1, 2, 2, 2, …, 2, 2, 2,1];
Δx is the vertical distance of the grid,Δy is the horizon-tal distance; h(i,j) is the grid node value in row i and column j.
Determination of the agronomic traits of cotton
Three plants were randomly uprooted from the center of each test plot and then divided into roots, stems, leaves and reproductive organs. For each plot, ten plants were randomly sampled for plant mapping to count boll num-bers. The leaf area was determined using a scanner (Phan-tom 9800xl; Microtek, Shanghai, China) and Image-Pro plus 7.0 (Media Cybernetics, Rockville, MD, USA). The
dry matter of the cotton plants was determined by drying at 80 °C to a constant weight. Cotton seed yield was manually harvested three times in 2014 and 2015, respectively.
Yield and yield component determination
In the beginning of October, cotton bolls from an area of 8 m2 (0.8 m× 10 m) in the central two rows of each plot were hand-harvested for cotton yield estimation. Plant density, boll number per plant and average seed cotton weight per boll were recorded to calculate the cotton yield.
Determination of spatial yield distribution
Before harvest, final plant mapping measurements were made on 30 consecutive undamaged plants in the two mid-dle rows of each plot. Measurements included plant height, total nodes, and bolls present by fruiting site on each indi-vidual plant. Bolls located from the first to the fourth fruit-ing branches were designated as the lower bolls, those in the fifth to the eighth fruiting branches were middle bolls and those in the ninth and higher fruiting branches were upper bolls. In addition, bolls in the first and second fruit positions were referred to as inner bolls and those in the third fruit position and beyond were outer bolls. Yield spatial distribu-tion was then determined by the boll number in each fruit-ing site divided by the total number of bolls per plant.
Statistical analysis
The experimental data were analyzed with SPSS 11.0. Differences between treatment means were tested for significance using least significant difference (LSD) after analysis of variance, which indicated a significant treat-ment effect byF-test at the probability level of 0.05.
Conclusions
Furthermore, the yield distribution within canopy was significantly linearly related to vertical LI distribution. Therefore, optimizing the canopy structure and subse-quently optimizing the LI distribution within the cotton can-opy can effectively manipulate the yield distribution, which can further influence cotton yield and fiber quality.
Acknowledgements
The authors are grateful for the work of the technicians at the experimental station of the Institute of Cotton Research of Chinese Academy of Agricultural Sciences.
Funding
This work was funded by the National Natural Science Foundation of China (31371561).
Availability of data and materials
The datasets used and analyzed during the current study are available from the corresponding author on reasonable request.
Authors’contributions
Li YB, Han YC, Wang GP designed the study. Xing FF, Feng L and Zhi XY wrote the main manuscript text and prepared figures 1-8. Xiong SW, Wang ZB, Fan ZY, Du WL carried out the experimental work and Yang BF, Xing FF, Lei YP, Feng L, Zhi XY analyzed data. All authors reviewed the manuscript. All authors read and approved the final manuscript.
Ethics approval and consent to participate Not applicable.
Consent for publication Not applicable.
Competing interests
The authors declare that they have no competing interests.
Received: 24 May 2018 Accepted: 21 September 2018
References
Arduini I, Masoni A, Ercoli L, Mariotti M. Grain yield, and dry matter and nitrogen accumulation and remobilization in durum wheat as affected by variety and seeding rate. Eur J Agron. 2006;25:309–18.https://doi.org/10.1016/j.eja.2006. 06.009.
Bai ZG, Mao SC, Han YC, et al. Study on light interception and biomass production of different cotton cultivars. PLoS One. 2016;11(5):e0156335. https://doi.org/10.1371/journal.pone.0156335.
Baldissera TC, Frak E, Carvalho PCD, Louarn G. Plant development controls leaf area expansion in alfalfa plants competing for light. Ann Bot. 2014;113:145– 57.https://doi.org/10.1093/aob/mct251.
Barthélémy D, Caraglio Y. Plant architecture: a dynamic, multilevel and comprehensive approach to plant form, structure and ontogeny. Ann Bot. 2007;99:375–407.https://doi.org/10.1093/aob/mcl260.
Bednarz CW, Bridges DC, Brown SM. Analysis of cotton yield stability across population densities. Agron J. 2000;92:128–35.https://doi.org/10.2134/ agronj2000.921128x.
Bednarz CW, Nichols RL, Brown SM. Plant density modifications of cotton within-boll yield components. Crop Sci. 2006;46(5):2076–80.https://doi.org/10.2135/ cropsci2005.12.0493.
Chen JM, Blanken PD, Black TA, et al. Radiation regime and canopy architecture in a boreal aspen forest. Agric For Meteorol. 1997;86:107–25.https://doi.org/ 10.1016/S0168-1923(96)02402-1.
Chenu K, Franck N, Dauzat J, et al. Integrated responses of rosette organogenesis, morphogenesis and architecture to reduced incident light inArabidopsis thalianaresults in higher efficiency of light interception. Functional Plant Biol. 2005;32:1123–34.https://doi.org/10.1071/FP05091.
CRI (Cotton Research Institute, Chinese Academy of Agricultural Sciences). Cultivation of cotton in China. Shanghai: Shanghai Science and Technology Press; 2013. (in Chinese).
Da Silva D, Han L, Costes E. Light interception efficiency of apple trees: a multiscale computational study based on MAppleT. Ecol Model. 2014;290:45– 53.https://doi.org/10.1016/j.ecolmodel.2013.12.001.
Dauzat J, Clouvel P, Luquet D, Martin P. Using virtual plants to analyse the light-foraging efficiency of a low-density cotton crop. Ann Bot. 2008;101:1153–66. https://doi.org/10.1093/aob/mcm316.
Escobar-Gutiérrez A, Combes D, Rakocevic M, et al. Functional relationships to estimate morphogenetically active radiation (MAR) from PAR and solar broadband irradiance measurements: the case of a sorghum crop. Agric Meteorologica. 2009;149:1244–53.https://doi.org/10.1016/j.agrformet.2009.02.011. Girma K, Teal RK, Freeman KW, et al. Cotton lint yield and quality as affected by
applications of N, P, and K fertilizers. J Cotton Sci. 2007;11:12–9.
Kaggwa-Asiimwe R, Andrade-Sanchez P, Wang GY. Plant architecture influences growth and yield response of upland cotton to population density. Field Crops Res. 2013;145:52–9.https://doi.org/10.1016/j.fcr.2013.02.005. Louarn G, Lecoeur J, Lebon E. A three-dimensional statistical reconstruction
model of grapevine (Vitis vinifera) simulating canopy structure variability within and between cultivar/training system pairs. Ann Bot. 2008;101:1167– 84.https://doi.org/10.1093/aob/mcm170.
Madakadze IC, Stewart K, Peterson PR, et al. Light interception, use-efficiency and energy yield of switchgrass (Panicum virgatumL.) grown in a short season area. Biomass Bioenergy. 1998;15:475–82.https://doi.org/10.1016/S0961-9534(98)00060-9. Maddonni GA, Otegui ME. Leaf area, light interception, and crop development in
maize. Field Crops Res. 1996;48:81–7. https://doi.org/10.1016/0378-4290(96)00035-4.
Mariscal M, Martens S, Ustin S, et al. Modelling and measurement of radiation interception by olive canopies. Agric For Meteorol. 2000;100:183–97.https:// doi.org/10.1016/S0168-1923(99)00137-9.
McIntyre BD, Riha SJ, Ong CK. Light interception and evapotranspiration in hedgerow agroforestry systems. Agric For Meteorol. 1996;81:31–40.https:// doi.org/10.1016/0168-1923(95)02303-8.
Meir P, Kruijt B, Broadmeadow M, et al. Acclimation of photosynthetic capacity to irradiance in tree canopies in relation to leaf nitrogen concentration and leaf mass per unit area. Plant Cell Environ. 2002;25:343–57.https://doi.org/10. 1046/j.0016-8025.2001.00811.x.
Mo XG, Liu SX, Lin ZH, et al. Prediction of crop yield, water consumption and water use efficiency with a SVAT-crop growth model using remotely sensed data on the North China plain. Ecol Model. 2005;183:301–22.https://doi.org/ 10.1016/j.ecolmodel.2004.07.032.
Monteith JL. Climate and the efficiency of crop production in Britain.Philos Trans R Soc Lond B Biol Sci. 1977;281:277–94.https://doi.org/10.1098/rstb. 1977.0140.
Reynolds MP, Delgado MI, Gutiérrez-Rodríguez M, Larqué-Saavedra A. Photosynthesis of wheat in a warm, irrigated environment: I: Genetic diversity and crop productivity. Field Crops Res. 2000;66:37–50.https://doi. org/10.1016/S0378-4290(99)00077-5.
Snowden C, Ritchie GL, Cave J, et al. Multiple irrigation levels affect boll distribution, yield, and fiber micronaire in cotton. Agron J. 2013;105:1536–44. https://doi.org/10.2134/agronj2013.0084.
Vargas LA, Andersen MN, Jensen CR, Jørgensen U. Estimation of leaf area index, light interception and biomass accumulation ofMiscanthus sinensis‘Goliath’ from radiation measurements. Biomass Bioenergy. 2002;22:1–14.
Wang Q, Han S, Zhang LZ, et al. Boll size affects the insecticidal protein content inBacillus thuringiensis(Bt) cotton. Field Crops Res. 2009;110:106–10.https:// doi.org/10.1016/j.fcr.2008.07.008.
Wang Q, Han S, Zhang LZ, et al. Density responses and spatial distribution of cotton yield and yield components in jujube (Zizyphus jujube)/cotton (Gossypium hirsutum) agroforestry. Eur J Agron. 2016;79:58–65.https://doi. org/10.1016/j.eja.2016.05.009.
Xue HY, Han YC, Li YB, et al. Spatial distribution of light interception by different plant population densities and its relationship with yield. Field Crops Res. 2015;184:17–27.https://doi.org/10.1016/j.fcr.2015.09.004.
Zarate-Valdez JL, Whiting ML, Lampinen BD, et al. Prediction of leaf area index in almonds by vegetation indexes. Comput Electron Agr. 2012;85:24–32.https:// doi.org/10.1016/j.compag.2012.03.009.
Zhang L, Van der Werf W, Bastiaans L, et al. Light interception and utilization in relay intercrops of wheat and cotton. Field Crops Res. 2008;107:29–42. https://doi.org/10.1016/j.fcr.2007.12.014.