R E S E A R C H A R T I C L E
Open Access
Effect of 12 months of testosterone replacement
therapy on metabolic syndrome components in
hypogonadal men: data from the Testim Registry
in the US (TRiUS)
Rajib K Bhattacharya
1*†, Mohit Khera
2†, Gary Blick
3†, Harvey Kushner
4†, Dat Nguyen
4†and Martin M Miner
5†Abstract
Background:Recent evidence suggests that there may be a bidirectional, physiological link between
hypogonadism and metabolic syndrome (MetS), and testosterone replacement therapy (TRT) has been shown to improve some symptoms of MetS in small patient populations. We examined the effect of 12 months of TRT on MetS components in a large cohort of hypogonadal men.
Methods:Data were obtained from TRiUS (Testim®Registry in the United States), a 12-month, multicenter, prospective observational registry (N = 849) of hypogonadal men prescribed Testim 1% testosterone gel (5-10 g/ day). Data analyzed included age, total testosterone (TT), free testosterone (FT), sex hormone-binding globulin (SHBG), and MetS components: waist circumference, blood pressure, fasting blood glucose, plasma triglycerides, and HDL cholesterol.
Results:Of evaluable patients (581/849) at baseline, 37% were MetS+ (n = 213) and 63% were MetS- (n = 368). MetS+ patients had significantly lower TT (p < 0.0001) and SHBG (p = 0.01) levels. Patients with the lowest quartile TT levels (<206 ng/dL [<7.1 nmol/L]) had a significantly increased risk of MetS+ classification vs those with highest quartile TT levels (≥331 ng/dL [≥11.5 nmol/L]) (odds ratio 2.66; 95% CI, 1.60 to 4.43). After 12 months of TRT, TT levels significantly increased in all patients (p < 0.005). Despite having similar TT levels after TRT, only MetS+ patients demonstrated significant decreases in waist circumference, fasting blood glucose levels, and blood pressure; lowest TT quartile patients demonstrated significant decreases in waist circumference and fasting blood glucose. Neither HDL cholesterol nor triglyceride levels changed significantly in either patient population. Conclusion:Hypogonadal MetS+ patients were more likely than their MetS- counterparts to have lower baseline TT levels and present with more comorbid conditions. MetS+ patients and those in the lowest TT quartile showed improvement in some metabolic syndrome components after 12 months of TRT. While it is currently unclear if further cardiometabolic benefit can be seen with longer TRT use in this population, testing for low testosterone may be warranted in MetS+ men with hypogonadal symptoms.
Keywords:Testosterone, metabolic syndrome, obesity, testosterone gel, testosterone replacement, TRiUS registry, Testim, hypogonadism, testosterone deficiency, fasting glucose
* Correspondence: bhattara@yahoo.com †Contributed equally
1
University of Kansas Medical Center, 3901 Rainbow Blvd, MS2024, Kansas City, KS 66160, USA
Full list of author information is available at the end of the article
Background
Hypogonadism is commonly found in middle-aged and older men [1]; symptoms may include decreased muscle mass and strength, increased abdominal fat, decreased sexual interest and function, depressed mood, and fatigue [2]. While the prevalence and symptoms of hypogonad-ism are associated with aging [3], the presence of certain comorbidities and cardiovascular risk factors are also associated with low testosterone levels [1], including the components of metabolic syndrome (MetS) [4]. Accord-ing to the ATP III and AHA/NHLBI guidelines [5,6] the components of MetS include: insulin resistance, increased waist circumference, high triglycerides, low high-density lipoprotein (HDL) cholesterol, and increased blood pressure (BP).
The worldwide prevalence of MetS has dramatically increased over the past 20 years [7]. Evidence suggests that there may be a bidirectional, physiological link between hypogonadism and MetS [4]. Reduced testoster-one levels can lead to muscle loss and weight gain, and is a significant predictor of MetS and type 2 diabetes in men [8-10]. Hyperinsulinemia and obesity may inhibit testicular testosterone production [10]. Testosterone replacement therapy (TRT) in hypogonadal men improves lean body mass and reduces fat mass [11], and may improve some symptoms of MetS and type 2 diabetes [12-14]. However, there have been four placebo-controlled, randomized trials [15-18] and a meta-analysis [19] published to date that have effectively evaluated the potential of TRT for meta-bolic symptom improvement.
There is a lack of studies of general populations of hypo-gonadal men that examined the effect of TRT on meta-bolic symptoms. We used data collected through the Testim®Registry in the United States (TRiUS) to investi-gate the prevalence of MetS and associated comorbidities in a large community-based population of men with hypo-gonadism and examined the effects of long-term (12-month) TRT on MetS components.
TRiUS was established as a prospective observational study (ie, patient registry) of hypogonadal men (N = 849) treated with testosterone gel (Testim 1%). The objective of this analysis was to determine whether restoring testoster-one levels in men with hypogonadism in typical clinical settings could improve components of MetS.
Methods
Data were part of the TRiUS patient registry of hypogo-nadal men, whose methodology and baseline demo-graphics have been described previously [20]. As with other patient registry or observational study designs, the TRiUS methodology reflected typical clinical practice: there was no placebo control or control patient popula-tion and data collecpopula-tion was limited to the patients who were available at each time point. Inclusion criteria for
the registry included hypogonadal males who provided informed consent and were naïve to Testim therapy at enrollment, though not necessarily naïve to other forms of TRT. Exclusion criteria for the registry included patients who demonstrated hypersensitivity to any ingre-dients in the testosterone gel (including testosterone), had breast cancer, or had known or suspected prostate cancer. All study sites had local or central Institutional Review Board (IRB) approval, and research was carried out in compliance with the Declaration of Helsinki as currently amended.
Testosterone gel dosing was prescribed at the physi-cian’s discretion and could be titrated up or down at any time during the 12-month study period in order to achieve the desired steady-state total testosterone (TT) level. Follow-up examinations were suggested at approxi-mately 1, 3, 6, and 12 months after the initiation of ther-apy, although actual follow-up visits were also at the discretion of the physician. Visits occurring within a spe-cified time window of a suggested time point (±14 days for month 1, ±30 days for months 3 and 6, and visits at day 330 or later for month 12) were grouped within that time point. If a patient had multiple visits within the spe-cified time window before or after a time point, the visit closest to the designated time point was used.
Suggested assessments at visits included, but were not limited to: testosterone levels (total, free, and bioavail-able), PSA, anthropometric measures, vital signs, choles-terol panel, hematology, and fasting glucose measures, and were measured according to the physician’s usual practice, including the measurement of free testosterone. Patient self-report of comorbid conditions and diseases such as diabetes, hypertension, dyslipidemia, and sleep apnea were recorded, as well as use of antidepressants, opioids, and phosphodiesterase type 5 (PDE5) inhibitors.
Assessment measures and medical history from elec-tronic clinical response forms were used to characterize men as positive (MetS+) or negative (MetS-) for MetS. ATP III and AHA/NHLBI criteria [5,6] required 3 of 5 of the following characteristics for MetS+ classification: central obesity (waist circumference >102 cm [40 inches]), high BP (systolic BP≥130 mmHg or diastolic BP≥85 mmHg or medical history of hypertension), high fasting blood glucose (>100 mg/dL [>5.6 mmol/L]), hyperlipidemia (triglycerides >150 mg/dL [>1.7 mmol/ L]), and low HDL cholesterol (<40 mg/dL [<1.0 mmol/ L]).
for inclusion if available data could give a definitive MetS classification.
Statistical analysis
Comparisons between subjects classified as MetS+ vs MetS- were performed using Fisher’s exact test for catego-rical variables, and t-tests of means for numecatego-rically contin-uous variables. Baseline correlations were examined using the Pearson (r) first-order partial correlation coefficient adjusting for age. The continuous effect of age on testos-terone levels at baseline was examined using an analysis of covariance (ANCOVA). Odds ratios were calculated using logistic regression models. All changes from baseline values were examined using repeated measures analysis of variance (ANOVA) based on a mixed model with two fixed effects: Post-baseline visit (months 3, 6, and 12) and either MetS status (+ or -) or baseline TT quartile. P-values≤0.05 were considered statistically significant and no Bonferroni corrections were made for multiple com-parisons. All analyses were performed using an a priori analysis plan with SAS®(SAS Institute, Cary NC, version 9.1).
Results
MetS criteria were examined for the 849 patients enrolled in the TRiUS registry. At baseline, 32% (268/849) did not have enough data to determine MetS status and were excluded from this analysis. Of those evaluated (n = 581), 213 (37%) patients were classified as with MetS (MetS+), and 368 (63%) patients were classified as without (MetS-). The two cohorts were statistically different (p = 0.04) in mean age (Table 1).
Of the 581 evaluable patients at baseline, a variable number were available for data collection at 3, 6, and 12 months of TRT: 160 patients at 3 months, 233 patients at 6 months, and 218 patients at 12 months. The percentages of MetS+ patients were as follows: 41.3% (66/160) at 3 months, 36.9% (86/233) at 6 months, and 40.4% (88/ 218) at 12 months. The remaining percentages were MetS- patients.
Analysis at baseline
Comparison between MetS+ and MetS- patients at baseline
As expected, MetS+ and MetS- cohorts showed statisti-cally significant differences in MetS components and related measures (Table 1) and in the prevalence of cardio-vascular and metabolic comorbid conditions (Figure 1).
Odds ratios of MetS status by TT and SHBG levels at baseline
Because MetS+ patients had significantly lower TT and SHBG levels (Figure 2), we examined if either of these levels were associated with an increased chance of being MetS+. To study the effect of TT levels, those patients
with baseline TT measures (n = 528) were divided into quartiles based upon the distribution of testosterone levels among this population: <206, 206-256, 257-330, and≥331 ng/dL [<7.1, 7.1-8.9, 8.9-11.5, and≥11.5 nmol/L]. The per-centage of MetS+ patients in each quartile were as follows: Quartile 1 (<206 ng/dL [<7.1 nmol/L]) = 50.4% (66/131); Quartile 2 (206-256 ng/dL [7.1-8.9 nmol/L]) = 39.1% (50/ 128); Quartile 3 (257-330 ng/dL [8.9-11.5 nmol/L]) = 37.8% (51/135); and Quartile 4 (≥331 ng/dL [≥11.5 nmol/ L]) = 27.6% (37/134). As expected, the highest percentage of MetS+ patients was in the lowest TT quartile.
Using the highest quartile (≥331 ng/dL [≥11.5 nmol/L]) as a reference, the odds ratios for MetS+ status among TT level quartiles were as follows: Quartile 1 (<206 ng/dL [<7.1 nmol/L]) = 2.66 (95% CI, 1.60 to 4.43); Quartile 2 (206-256 ng/dL [7.1-8.9 nmol/L]) = 1.68 (95% CI, 1.00 to 2.82); and Quartile 3 (257-330 ng/dL [8.9-11.5 nmol/L]) = 1.59 (95% CI, 0.95 to 2.66). The odds of being classified as MetS+ were significantly greater (p = 0.002) for patients in Quartile 1 (TT <206 ng/dL [<7.1 nmol/L]) than those in Quartile 3 (TT 257-330 ng/dL [8.9-11.5 nmol/L]) in a hypogonadal population.
SHBG levels (n = 104) were divided by the median value (≤23 and >23 nmol/L). The percentages of MetS+ patients were 39.1% in the low SHBG (≤23 nmol/L) group and 29.3% in the normal SHBG (>23 nmol/L) group. The odds ratio of being classified as MetS+ for the low SHBG group vs the normal SHBG group was 1.55 (95% CI, 0.68 to 3.52) and was not significant (p = 0.3). Thus, TT levels seemed to be a better indicator of metabolic syndrome status than SHBG levels in our study.
Correlations of baseline TT levels with anthropometric and blood pressure measures
These odds ratios suggested that TT levels may correlate to the components of MetS. We found that TT levels sig-nificantly and inversely correlated (p < 0.005) with all anthropometric and hemodynamic measures (Table 2), even after partialing out the effects of age. Free testoster-one, bioavailable testostertestoster-one, and SHBG levels did not significantly correlate with MetS components, with the exception of free testosterone and diastolic blood pressure (p = 0.04).
Analysis after testosterone replacement therapy
Table 1 Baseline characteristics
Characteristic Overall
(N = 849)
MetS+ (n = 213)
MetS-(n = 368)
p-Value (+ vs -)
Mean ± SD
Mean age, yrs (range) 52.1 ± 12.3
(20-85) (n = 845)
53.0 ± 11.3 (21-83) (n = 212)
50.9 ± 12.2 (24-85) (n = 367)
0.04
Hip circumference, cm [inches] 106.4 ± 14.7 [41.9 ± 5.8] (n = 836)
114.0 ± 15.0 [44.9 ± 5.9] (n = 212)
100.1 ± 12.2 [39.4 ± 4.8] (n = 364)
<0.0001
BMI, kg/m2 31.4 ± 6.9
(n = 846)
34.6 ± 6.6 (n = 213)
28.7 ± 6.4 (n = 368)
<0.0001
Waist circumference, cm [inches] 103.9 ± 16.5 [40.9 ± 6.5] (n = 835)
114.3 ± 16.0 [45.0 ± 6.3] (n = 211)
95.5 ± 13.7 [37.6 ± 5.4] (n = 363)
<0.0001
Fasting blood glucose, mg/dL [mmol/L] 106.4 ± 36.6 [5.9 ± 2.0]
(n = 455)
118.3 ± 40.0 [6.6 ± 2.2]
(n = 189)
96.6 ± 31.2 [5.4 ± 1.7] (n = 244)
<0.0001
Systolic BP, mmHg 129.2 ± 15.3
(n = 845)
134.3 ± 15.8 (n = 213)
122.8 ± 12.9 (n = 364)
<0.0001
Diastolic BP, mmHg 79.5 ± 9.5
(n = 845)
82.5 ± 9.6 (n = 213)
76.1 ± 8.3 (n = 365)
<0.0001
HDL cholesterol, mg/dL [mmol/L]
43.3 ± 12.6 [1.1 ± 0.3]
(n = 468)
38.1 ± 9.6 [1.0 ± 0.2] (n = 203)
47.8 ± 12.8 [1.3 ± 0.3] (n = 241)
<0.0001
LDL cholesterol, mg/dL [mmol/L]
104.3 ± 37.9 [2.7 ± 1.0]
(n = 456)
99.7 ± 36.1 [2.6 ± 0.9] (n = 196)
107.3 ± 37.7 [2.8 ± 1.0]
(n = 235)
0.04
Total cholesterol, mg/dL [mmol/L]
182.7 ± 45.4 [4.7 ± 1.2]
(n = 472)
179.7 ± 45.5 [4.66 ± 1.2] (n = 205)
183.4 ± 43.5 [4.8 ± 1.1]
(n = 241)
0.4
Plasma triglycerides, mg/dL [mmol/L]
175.8 ± 121.1 [2.0 ± 1.4]
(n = 474)
212.1 ± 134.3 [2.4 ± 1.5]
(n = 208)
141.4 ± 94.9 [1.6 ± 1.1]
(n = 239)
<0.0001
Abbreviations: BMI = body mass index; BP = blood pressure; HDL = high-density lipoprotein; LDL = low-density lipoprotein; MetS = metabolic syndrome.
0 5 10 15 20 25 30
Coronary Artery Disease Diabetes Depression Sleep Apnea
With MetS (n=213)
Without MetS (n=368)
%
o
f Patients
p=0.001
p<0.001
p=0.2
p=0.3
Figure 1Percentage of patients with comorbid conditions at baseline, by MetS status. As expected, the percentage of patients with
MetS component responses to TRT by metabolic syndrome status and TT level
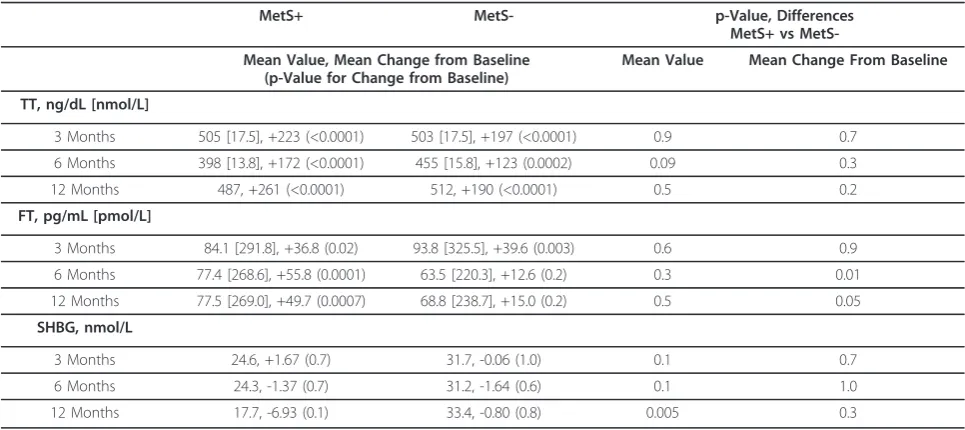
TT significantly increased from baseline values in both MetS+ and MetS- patients at all time points during TRT (Table 3); however, free testosterone did not signif-icantly change from baseline in MetS- patients after 6 and 12 months TRT and SHBG levels did not change in
either cohort at any time point. Neither mean TT levels nor changes in TT levels from baseline were signifi-cantly different between MetS+ and MetS- patients after 3, 6, and 12 months of TRT (Table 3).
Despite achieving similar TT levels after TRT, treatment had different effects on MetS components in MetS+ and MetS- patients (Figure 3). Statistically significant
260
315
0 50 100 150 200 250 300 350 400
With MetS Without MetS
Total T (ng/dL)
*
37
46
0 10 20 30 40 50 60
With MetS Without MetS
Free T (pg/mL)
A
B
97 91
0 20 40 60 80 100 120
With MetS Without MetS
Bioav
ailable T
(ng/dL)
n=204 n=327 n=119 n=229
C
n=26 n=31
23
30
0 5 10 15 20 25 30 35
With MetS Without MetS
SHBG (nmol/L)
**
n=35 n=69
1.04 1.11
0.0 0.2 0.4 0.6 0.8 1.0 1.2 1.4
With MetS Without MetS
PSA
(ng/mL)
D
E
n=157 n=207
Figure 2Baseline testosterone, SHBG, and PSA. Baseline values (mean ± SE) for total testosterone (A), free testosterone (B), bioavailable
testosterone (C), SHBG (D), and PSA (E) in patients with and without MetS. Total serum testosterone and SHBG levels were statistically lower in the MetS+ group. *p < 0.0001, **p = 0.01. Abbreviations: MetS = metabolic syndrome; PSA = prostate-specific antigen; SHBG = sex hormone-binding globulin; T = testosterone.
Table 2 Baseline Pearson correlation coefficients after adjusting for age
Total Testosterone Free Testosterone Bioavailable Testosterone SHBG
Pearson r, p-Value (n)
Waist circumference -0.20, <0.0001 (525)
0.01, 0.8 (340)
-0.14, 0.3 (55)
-0.10, 0.3 (102)
Hip circumference -0.15, 0.0005
(527)
0.02, 0.7 (341)
-0.19, 0.2 (55)
-0.10, 0.3 (102)
Weight -0.19, <0.0001
(531)
0.04, 0.4 (344)
-0.02, 0.9 (56)
-0.17, 0.09 (104)
BMI -0.22, <0.0001
(531)
0.04, 0.4 (344)
-0.14, 0.3 (56)
-0.18, 0.07 (104)
SBP -0.12, 0.005
(528)
0.04, 0.5 (341)
-0.15, 0.3 (56)
0.05, 0.6 (104)
DBP -0.20, <0.0001
(529)
-0.11, 0.04 (342)
-0.08, 0.6 (56)
0.0003, 1.0 (103)
improvements in waist circumference, fasting blood glu-cose, and blood pressure were found in MetS+ patients after 12 months of TRT. MetS- patients did not show improvement in any metabolic syndrome criteria at any time point. It is unclear if these outcomes were related to TRT dose since patients could be titrated up or down dur-ing treatment as determined by the physician to achieve steady TT levels.
Because we found that patients in the lowest TT quartile at baseline were at an increased risk for metabolic syn-drome classification, we examined if changes in MetS components after TRT were different for patients in the different quartiles. We found that TT levels significantly increased from baseline at all time points in patients in the lowest three quartiles (Quartiles 1-3), but not in the high-est quartile (Quartile 4). The difference among the groups in change from baseline was significant (Table 4). How-ever, the mean TT levels achieved at months 3, 6, and 12 of TRT were not significantly different among the groups; thus, the quartiles differed in change in TT, but not in mean TT levels, during TRT. In contrast, SHBG levels did not significantly change from baseline in any quartile at any time point. However, the difference between mean SHBG levels among the quartiles after 12 months of TRT was significant (p = 0.002). Lastly, significant changes in free testosterone were variable across quartiles and over time within quartiles; unlike TT, the quartiles did not sig-nificantly differ from each other in mean free testosterone levels, nor in change from baseline.
For each TT quartile, we examined changes in metabolic syndrome components after 12 months of TRT (Table 5). The only significant changes, found in Quartile 1 (<206 ng/dL [<7.1 nmol/L]), were for a mean loss of 2.1 cm [0.84
inches] in waist circumference (p = 0.002) and a drop of 11.5 mg/dL (0.64 mmol/L) in fasting glucose levels (p = 0.01). Nevertheless, there was no significant difference between the quartiles in metabolic syndrome components.
Correlations of TT with MetS components after TRT
In the entire patient population, we examined the corre-lations of final TT levels with MetS components and related measures. At 12 months, laboratory values and anthropometrics were measured in 214 of 218 returning patients and TT levels were measured in 117 of these patients. At this final time point, TT levels significantly and inversely correlated with anthropometric measures and glucose levels, even after partialing out the effects of age: waist circumference (r = -0.37, p < 0.001, n = 115), body mass index (BMI) (r = -0.34, p < 0.001, n = 115), weight (r = -0.28, p = 0.003, n = 113), hip circumference (r = -0.31, p < 0.001, n = 115) and fasting blood glucose (r = -0.26, p = 0.03, n = 74). TT levels did not correlate with systolic or diastolic BP, HDL cholesterol, or plasma triglycerides.
In addition, the change in TT levels over 12 months TRT significantly and inversely correlated with the changes in weight (r = -0.23, p = 0.02, n = 109) and BMI (r = -0.23, p = 0.02, n = 109), but not with fasting blood glucose levels (r = -0.22, p = 0.06, n = 73). Changes in TT did not correlate with changes in waist circumference, sys-tolic blood pressure, or SHBG levels.
Discussion
Studies have observed a relationship between low testos-terone and the components of metabolic syndrome [21], which would suggest that a hypogonadal population would have an increased prevalence of MetS. However, in Table 3 TT, FT, and SHBG change from baseline after 3, 6, and 12 months of TRT
MetS+ MetS- p-Value, Differences
MetS+ vs
MetS-Mean Value, MetS-Mean Change from Baseline (p-Value for Change from Baseline)
Mean Value Mean Change From Baseline
TT, ng/dL [nmol/L]
3 Months 505 [17.5], +223 (<0.0001) 503 [17.5], +197 (<0.0001) 0.9 0.7
6 Months 398 [13.8], +172 (<0.0001) 455 [15.8], +123 (0.0002) 0.09 0.3
12 Months 487, +261 (<0.0001) 512, +190 (<0.0001) 0.5 0.2
FT, pg/mL [pmol/L]
3 Months 84.1 [291.8], +36.8 (0.02) 93.8 [325.5], +39.6 (0.003) 0.6 0.9
6 Months 77.4 [268.6], +55.8 (0.0001) 63.5 [220.3], +12.6 (0.2) 0.3 0.01
12 Months 77.5 [269.0], +49.7 (0.0007) 68.8 [238.7], +15.0 (0.2) 0.5 0.05
SHBG, nmol/L
3 Months 24.6, +1.67 (0.7) 31.7, -0.06 (1.0) 0.1 0.7
6 Months 24.3, -1.37 (0.7) 31.2, -1.64 (0.6) 0.1 1.0
12 Months 17.7, -6.93 (0.1) 33.4, -0.80 (0.8) 0.005 0.3
the TRiUS population of hypogonadal men, 37% of the evaluated patients met the criteria for metabolic syndrome at baseline, which is consistent with the prevalence of metabolic syndrome in US adult men (34.8%-41.9%) [22]. We did find that low TT levels (<206 ng/dL [<7.1 nmol/ L]) increased the risk of being classified as MetS+ and that TT levels significantly correlated with some MetS compo-nents before and after TRT. We found that TRT signifi-cantly increased testosterone levels in both MetS+ and MetS- hypogonadal populations and both achieved similar TT levels. Changes in MetS components, however, were only seen in MetS+ patients, including decreased fasting blood glucose levels, waist circumference, and BP. Although these changes were significant, no MetS+
patients changed MetS status. Given the patients’high baseline measurements, the need to have improvement across 1-3 components concurrently to change status, and the fact that the mean improvements did not break through the lower thresholds for MetS criteria, this may not be surprising.
In the literature, there is robust evidence of an associa-tion between metabolic condiassocia-tions and low testosterone and/or SHBG [21,23-26]. Low testosterone levels are associated with, and predictive of, weight gain [27], cen-tral obesity [8,28], hypertension [29], MetS [8], insulin resistance [30], and type 2 diabetes [9,24,30,31]. Low tes-tosterone is found in 33% of type 2 diabetes patients, including those younger than 35 years, as compared to
-75 -50 -25 0 25 50 75
Change in Plasma Triglycerides (mg/dL)
Month 3 Month 6 Month 12 **
-25 -20 -15 -10 -5 0 5
C
h
ange i
n
Fast
ing G
lucose (
m
g/
dL)
Month 3 Month 6 Month 12 * -1.0
-0.8 -0.5 -0.3 0.0 0.3 0.5 0.8
Change in Waist Circumference (inches) Month 3 Month 6 Month 12
*
C
B
D
F
E
A
-10 -8 -6 -4 -2 0 2 4 6
C
h
ange i
n
S
yst
ol
ic
B
P
(
m
m
H
g)
**
*
Month 3 Month 6 Month 12
** **
-3 -2 -1 0 1 2 3 4
C
h
ange i
n
H
D
L
C
hol
est
er
ol
(
m
g/
dL)
Month 3 Month 6 Month 12
-5 -4 -3 -2 -1 0 1 2 3 4
Ch
a
n
g
e
in
Di
a
s
to
lic
BP (
m
m
H
g
)
**
Month 3 Month 6 Month 12 *
*
Figure 3Change from baseline in MetS components. Change from baseline (mean ± SE) in waist circumference (A), fasting blood glucose
only 6% in men with type 1 diabetes [26]. In prostate can-cer patients who undergo chemical castration therapy, testosterone levels are suddenly and drastically reduced, resulting in increased fat deposition, increased insulin levels, impaired insulin sensitivity, and increased risk of
diabetes and MetS classification [32,33]. The evidence for the association between hypogonadism and diabetes is strong enough to warrant its inclusion in the most cur-rent treatment guidelines for hypogonadism [2], which recommend screening for low testosterone in patients Table 4 TT, FT, and SHBG change from baseline after 3, 6, and 12 months of TRT, by baseline testosterone level quartiles Quartile 1 (<206 ng/dL) [<7.1 nmol/L] Quartile 2 (206-256 ng/dL) [7.1-8.9 nmol/L] Quartile 3 (257-330 ng/dL) [8.9-11.5 nmol/L] Quartile 4
(≥331 ng/dL)
[≥11.5 nmol/L]
p-Value, Differences Among Quartiles
Mean Value, Mean Change from Baseline (p-Value for Change from Baseline)
Mean Value Mean Change From Baseline
TT, ng/dL [nmol/L]
3 Months 465 [16.1], +307 (<0.0001)
466 [16.2], +234 (<0.0001)
543 [18.8], +248 (0.0002)
520 [18.0], +59 (0.3)
0.7 0.02
6 Months 405 [14.1], +244 (<0.0001)
379 [13.2], +148 (0.0007)
425 [14.7], +135 (0.01)
535 [18.6], -3.7 (0.9)
0.09 0.002
12 Months 519 [18.0], +359 (<0.0001)
456 [15.8], +225 (<0.0001)
496 [17.2], +206 (0.0003)
520 [18.0], +3.6 (0.9)
0.7 <0.0001
FT, pg/mL [pmol/L]
3 Months 74 [256.8], +32 (0.1)
93 [322.7], +19 (0.5)
121 [419.9], +80 (0.0002)
80 [277.6], +17 (0.03)
0.3 0.1
6 Months 84 [291.5], +57 (0.0007)
71 [246.4], +3.8 (0.8)
82 [284.5], +45 (0.02)
69 [239.4], +6.3 (0.7)
0.8 0.06
12 Months 87 [301.9], +59 (0.0008)
67 [232.5], +9.0 (0.7)
56 [194.3], +18 (0.3)
70 [242.9], +6.9 (0.7)
0.5 0.1
SHBG, nmol/L
3 Months 27.9, +2.83 (0.7) 24.1, +0.1 (1.0) 32.1, +1.52 (0.7) 37.2, -1.66 (0.7) 0.2 0.9
6 Months 25.6, -1.00 (0.9) 25.7, +3.30 (0.6) 26.5, -3.84 (0.4) 38.9, -1.49 (0.7) 0.06 0.8
12 Months 19.4, -6.50 (0.4) 20.7, -1.45 (0.8) 25.2, -6.72 (0.1) 45.8, +5.75 (0.3) 0.002 0.3
Abbreviations: FT = free testosterone; SHBG = sex hormone-binding globulin; TT = total testosterone.
Table 5 12-month changes from baseline in MetS components and cardiovascular values by baseline testosterone level quartiles Quartile 1 (<206 ng/dL) [<7.1 nmol/L] Quartile 2 (206-256 ng/dL) [7.1-8.9 nmol/L] Quartile 3 (257-330 ng/dL) [8.9-11.5 nmol/L] Quartile 4
(≥331 ng/dL)
[≥11.5 nmol/L]
Differences Among Quartiles
Mean Change from Baseline (p-Value) p-Value Waist circumference, cm [inches] -2.1 [-0.84] (0.002) -1.2 [-0.49] (0.1) +0.5 [+0.20] (0.5) -0.1 [-0.03] (0.9) 0.06 FBG, mg/dL [mmol/L] -11.5 [-0.64] (0.01) +0.76 [+0.04] (0.9) -7.7 [-0.43] (0.1) +1.1 [+0.06] (0.8) 0.2 Systolic BP, mmHg -1.5 (0.4) -1.0 (0.6) -2.9 (0.2) +1.9 (0.4) 0.4
Diastolic BP, mmHg -1.5
(0.2) -2.3 (0.07) -2.5 (0.09) +0.3 (0.8) 0.4
HDL cholesterol, mg/dL [mmol/L] -0.45 [-0.01] (0.8) -2.1 [-0.05] (0.3) -0.89 [-0.02] (0.6) +0.54 [+0.01] (0.8) 0.8
Plasma TG, mg/dL [mmol/L] -17.8 [-0.20] (0.3) -11.4 [-0.12] (0.6) -34.2 [-0.39] (0.08) +2.1 [+0.02] (0.9) 0.7
with type 2 diabetes. Our findings that TT levels corre-lated with waist circumference and fasting blood glucose in a hypogonadal population are in line with these observations.
However, it is unclear to what extent TRT can improve metabolic symptoms in hypogonadal men. Studies of TRT in hypogonadal men have shown improvements in body composition (fat-to-lean mass ratio) [11] and insu-lin sensitivity that can reliably be seen early in TRT (1-6 weeks) [34]. Changes in BMI are not always seen since a loss of fat weight can be replaced by lean muscle weight after TRT [35]. Recently, in a hypogonadal male popula-tion with type 2 diabetes and/or metabolic syndrome, Jones and colleagues [17] showed a 15.2% reduction in HOMA-IR (homeostasis model of assessment–insulin resistance) compared to placebo after 6 months of TRT use. This was maintained through the 12 months of the study. We found that TRT resulted in lowered waist cir-cumference (visceral fat) and fasting blood glucose, but only in patients with very low testosterone levels (<206 ng/dL [<7.1 nmol/L]) or in MetS+ patients. We saw neither improvement, nor worsening, in lipid parameters in either MetS+ or MetS- cohorts; this reflects the results reported in a review by Jones [34], which found that the effect of TRT on HDL cholesterol is reduction in 25% of the studies, increase in 25% of the studies, and no effect in 50% of the studies.
In the MetS+ population of our study, improvements were generally seen at later time points: at 12 months for waist circumference and fasting blood glucose levels, and at 6 months for BP. This generally agrees with the litera-ture, and it is possible that metabolic benefits of TRT may not be seen until later time points. At 3 months TRT, placebo-controlled studies in men with type 2 dia-betes demonstrated mixed results; there were significant reductions in waist circumference but not BMI [13], reductions in waist circumference and fasting blood glu-cose, but not BP [12], and reductions in body weight and blood glucose [36]. In a longer, 8-month placebo-con-trolled trial of TRT in hypogonadal obese men, improve-ments over placebo were seen in visceral (abdominal) fat mass, blood glucose, diastolic BP, and serum cholesterol, but not BMI [37]. In a 12-month study of hypogonadal men with MetS, improvements were seen at 6 months in insulin sensitivity, waist circumference, and fat mass, and further improvements were seen at 12 months [15]. In a 2-year study by Haider et al of hypogonadal men treated with parenteral testosterone undecanoate, BMI, waist size, and weight continued to decrease over the full 24 months, while improvements in fasting glucose and lipid levels were seen only during the first 12 months [38]. It should be noted that in this study, 77% (37/47) of men with MetS no longer met the criteria for the condition after receiving TRT for 2 years [38].
In addition to prolonged use, metabolic benefit has also been seen when TRT is used in combination with weight loss. Heufelder et al conducted a 12-month, placebo con-trolled study of diet and exercise with or without TRT in 32 hypogonadal men with MetS and newly diagnosed type 2 diabetes [14]. They found that while there were improve-ments in all MetS components in both groups, addition of TRT to diet and exercise significantly improved glycemic control and waist circumference over diet and exercise alone. Using the ATP III definition of MetS as we did in the current study, they found that 81.3% of the TRT+diet +exercise group and 31.3% of the diet+exercise group no longer met the criteria for MetS after 12 months in the study. Our patient registry showed that TRT alone in MetS+ patients can improve two of the five criteria for MetS (ie, decreased fasting blood glucose levels and waist circumference). This result may be more realistic in clini-cal practice since many patients struggle with diet and exercise regimens outside of a structured clinical study. Heufelder et al also found a small improvement in TT levels with diet and exercise alone, emphasizing the bidir-ectional link between testosterone and MetS criteria. Because we did not record changes in diet and exercise in our study, it is unknown if improved MetS criteria had any impact on testosterone levels in our study.
Importantly for prediabetic men, we found that TRT improved fasting glucose levels in MetS+ men. This rela-tionship between testosterone and insulin was high-lighted in Yialamas et al [32], who found decreased insulin sensitivity and increased fasting blood glucose levels after withdrawal of TRT in young, healthy men with idiopathic hypogonadotropic hypogonadism. Similar results have been reported by Pitteloud et al [39,40], though Rabiee et al [41] found no change in insulin sen-sitivity in response to serum testosterone suppression in healthy non-hypogonadal men. Thus, insulin sensitivity may be related to a chronic hypogonadal state, though the mechanism for this is currently unclear.
washout period before enrollment, no placebo control, and no centralized laboratory testing facility. This last limitation may have contributed to the inconsistent change we observed in free testosterone after TRT; it is unclear why free testosterone did not correlate with TT, although it should be noted that a uniform method of free testosterone assessment was not stipulated in the registry (ie, calculated vs measured; analog assay vs mass spectrometry). Because our data reflect the natural beha-vior of patients and physicians, the findings can be gener-alized to patients seeking medical attention for hypogonadal symptoms and those being treated for hypogonadism.
Conclusions
Our findings are consistent with the literature showing an association between TT levels and MetS and the positive influence of TRT on waist circumference and fasting blood glucose levels. Furthermore, we show that 6 to 12 months of TRT may be required for more benefit in the typical hypogonadal patient with MetS. Numerous small studies have provided qualitative evidence that TRT pro-vides metabolic benefit. In addition to the recently pub-lished results from the TIMES2 study [17], there is a need for large, long-term, placebo-controlled trials confirming the important observed benefits of TRT in hypogonadal men with MetS. In clinical practice, testing for low testos-terone may be warranted in men with MetS who also exhibit other signs or symptoms of testosterone deficiency.
Prior presentation/publication
Data from this paper were presented at the Endocrine Society 2010 Annual Meeting (June 19-22, 2010, San Diego, California) and published in abstract form as Bhat-tacharya RK, et al.Endocrine Reviews. 2010;31(3 suppl 1): S466. Abstract P1-399. A companion paper describing the methodology and baseline symptoms and comorbidities of participants in the TRiUS registry has been published: Miner MM, Khera M, Bhattacharya R, Blick G, Kushner H. Baseline data from the TRiUS registry: symptoms and comorbidities of testosterone deficiency.Postgrad Med. 2011;123:17-27.
Acknowledgements and Funding
Funding to support this study and the preparation of this manuscript was provided by Auxilium Pharmaceuticals. The authors thank Tara Gupta, PhD of MedVal Scientific Information Services, LLC for providing medical writing and editorial assistance. This manuscript was prepared according to the International Society for Medical Publication Professionals’ “Good Publication Practice for Communicating Company-Sponsored Medical Research: The GPP2 Guidelines.”
Author details
1
University of Kansas Medical Center, 3901 Rainbow Blvd, MS2024, Kansas City, KS 66160, USA.2Scott Department of Urology, Baylor College of
Medicine, 6620 Main Street, Suite 1325, Houston, TX 77030, USA.3Circle
Medical LLC, 153 East Avenue, Suite 32, Norwalk, CT 06851, USA.4Auxilium
Pharmaceuticals, 40 Valley Stream Parkway, Malvern, PA 19355, USA.5Miriam
Hospital Men’s Health Center, 164 Summit Avenue, Providence, RI 02906, USA.
Authors’contributions
All authors contributed equally and each were involved in study design, data acquisition, or data analysis/interpretation and in drafting or critically revising the manuscript. All authors reviewed the final manuscript and gave approval for publication.
Competing interests
RKB- Amgen: speaker; Auxilium: consultant, steering committee; Bristol-Myers Squibb: speaker; Novartis: speaker; Solvay: speaker.MK- Allergan: research funding; Auxilium: speaker; Boehringer Ingelheim: speaker; Slate: speaker.GB- Auxilium: investigator, speaker; Tibotec: advisor/consultant, speaker; ViiV: advisor/consultant, speaker; Virxsys: research funding, advisor/ consultant.HK- Auxilium: employee.DN- Auxilium: employee.MMM -Auxilium: research funding; advisor; GlaxoSmithKline: research funding; Endo: advisor.
Received: 22 July 2011 Accepted: 1 November 2011 Published: 1 November 2011
References
1. Mulligan T, Frick MF, Zuraw QC, Stemhagen A, McWhirter C:Prevalence of hypogonadism in males aged at least 45 years: the HIM study.Int J Clin Pract2006,60(7):762-769.
2. Bhasin S, Cunningham GR, Hayes FJ, Matsumoto AM, Snyder PJ, Swerdloff RS, Montori VM:Testosterone therapy in men with androgen deficiency syndromes: an Endocrine Society clinical practice guideline.J Clin Endocrinol Metab2010,95(6):2536-2559.
3. Harman SM, Metter EJ, Tobin JD, Pearson J, Blackman MR:Longitudinal effects of aging on serum total and free testosterone levels in healthy men. Baltimore Longitudinal Study of Aging.J Clin Endocrinol Metab2001,
86(2):724-731.
4. Guay AT:The emerging link between hypogonadism and metabolic syndrome.J Andol2009,30(4):370-376.
5. National Cholesterol Education Program, National Institutes of Health:Third Report of the National Cholesterol Education Program (NCEP) Expert Panel on Detection, Evaluation, and Treatment of High Blood Cholesterol in Adults (Adult Treatment Panel III) final report.Circulation
2002,106(25):3143-3421.
6. Grundy SM, Cleeman JI, Daniels SR, Donato KA, Eckel RH, Franklin BA, Gordon DJ, Krauss RM, Savage PJ, Smith SC, Spertus JA, Costa F:Diagnosis and management of the metabolic syndrome. An American Heart Association/National Heart, Lung, and Blood Institute Scientific Statement.Circulation2005,112(17):2735-2752.
7. Grundy SM, Hansen B, Smith SC Jr, Cleeman JI, Kahn RA:Clinical management of metabolic syndrome: report of the American Heart Association/National Heart, Lung, and Blood Institute/American Diabetes Association conference on scientific issues related to management.
Circulation2004,109(4):551-556.
8. Laaksonen DE, Niskanen L, Punnonen K, Nyyssonen K, Tuomainen TP, Valkonen VP, Salonen R, Salonen JT:Testosterone and sex hormone-binding globulin predict the metabolic syndrome and diabetes in middle-aged men.Diabetes Care2004,27(5):1036-1041.
9. Ding EL, Song Y, Malik VS, Liu S:Sex differences of endogenous sex hormones and risk of type 2 diabetes: a systematic review and meta-analysis.JAMA2006,295(11):1288-1299.
10. Zitzmann M:Testosterone deficiency, insulin resistance and the metabolic syndrome.Nat Rev Endocrinol2009,5(12):673-681. 11. Wang C, Swerdloff RS, Iranmanesh A, Dobs A, Snyder PJ, Cunningham G,
Matsumoto AM, Weber T, Berman N:Transdermal testosterone gel improves sexual function, mood, muscle strength, and body composition parameters in hypogonadal men.J Clin Endocrinol Metab
2000,85(8):2839-2853.
12. Kapoor D, Goodwin E, Channer KS, Jones TH:Testosterone replacement therapy improves insulin resistance, glycaemic control, visceral adiposity and hypercholesterolaemia in hypogonadal men with type 2 diabetes.
13. Kapoor D, Clarke S, Stanworth R, Channer KS, Jones TH:The effect of testosterone replacement therapy on adipocytokines and C-reactive protein in hypogonadal men with type 2 diabetes.Eur J Endocrinol2007,
156(5):595-602.
14. Heufelder AE, Saad F, Bunck MC, Gooren L:Fifty-two-week treatment with diet and exercise plus transdermal testosterone reverses the metabolic syndrome and improves glycemic control in men with newly diagnosed type 2 diabetes and subnormal plasma testosterone.J Andol2009,
30(6):726-733.
15. Aversa A, Bruzziches R, Francomano D, Spera G:Efficacy and safety of two different testosterone undecanoate formulations in hypogonadal men with metabolic syndrome.J Endocrinol Invest2010,33(11):776-783. 16. Aversa A, Bruzziches R, Francomano D, Rosano G, Isidori AM, Lenzi A,
Spera G:Effects of testosterone undecanoate on cardiovascular risk factors and atherosclerosis in middle-aged men with late-onset hypogonadism and metabolic syndrome: results from a 24-month, randomized, double-blind, placebo-controlled study.J Sex Med2010,
7(10):3495-3503.
17. Jones TH, Arver S, Behre HM, Buvat J, Meuleman E, Moncada I, Morales AM, Volterrani M, Yellowlees A, Howell JD, Channer KS:Testosterone replacement in hypogonadal men with type 2 diabetes and/or metabolic syndrome (the TIMES2 study).Diabetes Care2011,34:828-837. 18. Kalinchenko SY, Tishova YA, Mskhalaya GJ, Gooren LJ, Giltay EJ, Saad F:
Effects of testosterone supplementation on markers of the metabolic syndrome and inflammation in hypogonadal men with the metabolic syndrome: the double-blind placebo-controlled Moscow study.Clin Endocrinol (Oxf)2010,73(5):602-612.
19. Corona G, Monami M, Rastrelli G, Aversa A, Tishova Y, Saad F, Lenzi A, Forti G, Mannucci E, Maggi M:Testosterone and metabolic syndrome: a meta-analysis study.J Sex Med2011,8(1):272-283.
20. Miner MM, Khera M, Bhattacharya R, Blick G, Kushner H:Baseline data from the TRiUS registry: symptoms and comorbidities of testosterone deficiency.Postgrad Med2011,123(3):17-27.
21. Traish AM, Guay A, Feeley R, Saad F:The dark side of testosterone deficiency: I. Metabolic syndrome and erectile dysfunction.J Andol2009,
30(1):10-22.
22. Alberti KG, Eckel RH, Grundy SM, Zimmet PZ, Cleeman JI, Donato KA, Fruchart JC, James WP, Loria CM, Smith SC:Harmonizing the metabolic syndrome: a joint interim statement of the International Diabetes Federation Task Force on Epidemiology and Prevention; National Heart, Lung, and Blood Institute; American Heart Association; World Heart Federation; International Atherosclerosis Society; and International Association for the Study of Obesity.Circulation2009,120(16):1640-1645. 23. Muller M, Grobbee DE, den Tonkelaar I, Lamberts SW, van der Schouw YT:
Endogenous sex hormones and metabolic syndrome in aging men.J Clin Endocrinol Metab2005,90(5):2618-2623.
24. Kupelian V, Page ST, Araujo AB, Travison TG, Bremner WJ, McKinlay JB:Low sex hormone-binding globulin, total testosterone, and symptomatic androgen deficiency are associated with development of the metabolic syndrome in nonobese men.J Clin Endocrinol Metab2006,91(3):843-850. 25. Traish AM, Saad F, Guay A:The dark side of testosterone deficiency: II.
Type 2 diabetes and insulin resistance.J Andol2009,30(1):23-32. 26. Dandona P, Dhindsa S, Chandel A, Chaudhuri A:Hypogonadotropic
hypogonadism in men with type 2 diabetes.Postgrad Med2009,
121(3):45-51.
27. Saad F, Gooren LJ:The role of testosterone in the etiology and treatment of obesity, the metabolic syndrome, and diabetes mellitus type 2.J Obes
2011,2011:471584.
28. Svartberg J, von Muhlen D, Sundsfjord J, Jorde R:Waist circumference and testosterone levels in community dwelling men. The Tromso study.Eur J Epidemiol2004,19(7):657-663.
29. Rosmond R, Wallerius S, Wanger P, Martin L, Holm G, Bjorntorp P:A 5-year follow-up study of disease incidence in men with an abnormal hormone pattern.J Intern Med2003,254(4):386-390.
30. Stellato RK, Feldman HA, Hamdy O, Horton ES, McKinlay JB:Testosterone, sex hormone-binding globulin, and the development of type 2 diabetes in middle-aged men: prospective results from the Massachusetts male aging study.Diabetes Care2000,23(4):490-494.
31. Selvin E, Feinleib M, Zhang L, Rohrmann S, Rifai N, Nelson WG, Dobs A, Basaria S, Golden SH, Platz EA:Androgens and diabetes in men: results
from the Third National Health and Nutrition Examination Survey (NHANES III).Diabetes Care2007,30(2):234-238.
32. Yialamas MA, Dwyer AA, Hanley E, Lee H, Pitteloud N, Hayes FJ:Acute sex steroid withdrawal reduces insulin sensitivity in healthy men with idiopathic hypogonadotropic hypogonadism.J Clin Endocrinol Metab
2007,92(11):4254-4259.
33. Basaria S:Androgen deprivation therapy, insulin resistance, and cardiovascular mortality: an inconvenient truth.J Andol2008,
29(5):534-539.
34. Jones TH:Effects of testosterone on type 2 diabetes and components of the metabolic syndrome.J Diabetes2010,2(3):146-156.
35. Svartberg J, Agledahl I, Figenschau Y, Sildnes T, Waterloo K, Jorde R:
Testosterone treatment in elderly men with subnormal testosterone levels improves body composition and BMD in the hip.Int J Impot Res
2008,20(4):378-387.
36. Boyanov MA, Boneva Z, Christov VG:Testosterone supplementation in men with type 2 diabetes, visceral obesity and partial androgen deficiency.Aging Male2003,6(1):1-7.
37. Marin P, Holmang S, Jonsson L, Sjostrom L, Kvist H, Holm G, Lindstedt G, Bjorntorp P:The effects of testosterone treatment on body composition and metabolism in middle-aged obese men.Int J Obes Relat Metab Disord
1992,16(12):991-997.
38. Haider A, Gooren LJ, Padungtod P, Saad F:Beneficial effects of 2 years of administration of parenteral testosterone undecanoate on the metabolic syndrome and on non-alcoholic liver steatosis and C-reactive protein.
Horm Molec Biol Clin Invest2010,1(1):27-33.
39. Pitteloud N, Hardin M, Dwyer AA, Valassi E, Yialamas M, Elahi D, Hayes FJ:
Increasing insulin resistance is associated with a decrease in Leydig cell testosterone secretion in men.J Clin Endocrinol Metab2005,
90(5):2636-2641.
40. Pitteloud N, Mootha VK, Dwyer AA, Hardin M, Lee H, Eriksson KF, Tripathy D, Yialamas M, Groop L, Elahi D, Hayes FJ:Relationship between testosterone levels, insulin sensitivity, and mitochondrial function in men.Diabetes Care2005,28(7):1636-1642.
41. Rabiee A, Dwyer AA, Caronia LM, Hayes FJ, Yialamas MA, Andersen DK, Thomas B, Torriani M, Elahi D:Impact of acute biochemical castration on insulin sensitivity in healthy adult men.Endocr Res2010,35(2):71-84. Pre-publication history
The pre-publication history for this paper can be accessed here: http://www.biomedcentral.com/1472-6823/11/18/prepub
doi:10.1186/1472-6823-11-18
Cite this article as:Bhattacharyaet al.:Effect of 12 months of testosterone replacement therapy on metabolic syndrome components in hypogonadal men: data from the Testim Registry in the US (TRiUS).
BMC Endocrine Disorders201111:18.
Submit your next manuscript to BioMed Central and take full advantage of:
• Convenient online submission
• Thorough peer review
• No space constraints or color figure charges
• Immediate publication on acceptance
• Inclusion in PubMed, CAS, Scopus and Google Scholar
• Research which is freely available for redistribution