anow at: National Centre for Atmospheric Science, Department of Meteorology, University of Reading,
Reading, UK
Correspondence to:Julia Curio (julia.curio@tu-berlin.de)
Received: 1 January 2016 – Published in Earth Syst. Dynam. Discuss.: 8 February 2016 Revised: 2 August 2016 – Accepted: 19 August 2016 – Published: 20 September 2016
Abstract. The Tibetan Plateau (TP) is the origin of many large Asian rivers, which provide water resources for large regions in south and east Asia. Therefore, the water cycle on the TP and adjacent high mountain ranges, in particular the precipitation distribution and variability play an important role for the water availability for billions of people in the downstream regions of the TP.
The High Asia Refined analysis (HAR) is used to analyse the dynamical factors that influence precipitation variability in the TP region, including the factors resulting in the enhancement and suppression of precipitation. Four dynamical fields that can influence precipitation are considered: the 300 hPa wind speed and wind speed 2 km above ground, the 300 hPa vertical wind speed, and the atmospheric water transport. The study focusses on the seasonality and the spatial variability of the precipitation controls and their dominant patterns. Results show that different factors have different effects on precipitation in different regions and seasons. This depends mainly on the dominant type of precipitation, i.e. convective or frontal/cyclonic precipitation. Additionally, the study reveals that the midlatitude westerlies have a high impact on the precipitation distribution on the TP and its surroundings year-round and not only in winter.
1 Introduction
The Tibetan Plateau (TP) has been called the “world water tower” (Xu et al., 2008) and is the origin of many rivers in high Asia, which provide water for billions of people down-stream in south and east Asia. The TP is located in the transi-tion zone between the midlatitude westerlies (Schiemann et al., 2009) and the Indian and east Asian summer monsoon systems (Webster et al., 1998). The TP shapes the hydro-climate of downstream regions by its influence on the large-scale circulation (Hahn and Manabe, 1975), caused by its large extent and height.
Since precipitation is a key feature of the water cycle of high Asia, it is important to analyse the factors controlling precipitation variability. Identifying which dynamic factors influence the precipitation may also help to estimate the im-pact of future climate change on precipitation variability.
Previous studies have stated that precipitation over the TP is controlled by the westerlies in winter and the Indian and east Asian summer monsoon in summer (e.g. Hren et al., 2009; Tian et al., 2007; Yang et al., 2014). This assumption is derived only from the precipitation timing, but Curio et al. (2015) and Mölg et al. (2014) have already shown that the midlatitude westerlies also have an impact on the summer precipitation.
The High Asia Refined analysis (HAR) (Maussion et al., 2014), which is the result of the dynamical downscaling of an operational analysis and which covers more than 13 years at high spatial and temporal resolution, provides the opportu-nity for a process-based analysis of the precipitation and its variability.
The starting point of this study is the seasonality of the precipitation over the TP and the evaluation of the factors that control the precipitation over the TP and the surrounding high mountain ranges. This focusses on the timing, location, and strength of the factors that influence precipitation and its variability.
The main aim of this study is to describe the spatial and temporal correlation of selected dynamical variables and precipitation to reveal the underlying mechanisms through which the variables influence precipitation and therefore act as controls of precipitation variability.
We selected four variables as dynamic precipitation con-trols: horizontal wind speed at 300 hPa and at about 2 km above ground, the vertical wind speed at 300 hPa, and the vertically integrated atmospheric water transport. It is known that these factors have an influence on precipitation variabil-ity, but on the basis of coarse-resolution datasets it was not possible to analyse the relations in a spatially and temporally differentiated way like it is now with the HAR.
The different precipitation controls have effects on dif-ferent spatial scales. While the horizontal and vertical wind speeds at 300 hPa (WS300 and W300) are large-scale con-trols, the horizontal wind speed in the boundary layer (WS10) is active on the mesoscale. The atmospheric water transport (AWT) connects the large scale with the mesoscale because it is effective on both scales and across large dis-tances. We do not claim completeness for the list of precip-itation controls but assume that these four factors belong to the most important dynamic precipitation controls. It is im-portant to keep in mind that the precipitation controls are not independent of each other and can have combined effects on precipitation variability or cancel out each other; this will not be in focus of the current study.
In the following we will briefly introduce the selected pre-cipitation controls and their possible impacts on prepre-cipitation variability.
The horizontal wind speed at the 300 hPa level has two main effects on precipitation variability. High WS300 can in-hibit or cut off deep convection and thus suppress precipita-tion development (e.g. Findell et al., 2003; Zhang and Atkin-son, 1995). In this case only shallow convection can form, which does not lead to considerable precipitation amounts. Mölg and Chiang (2009) showed that convective precipi-tation events on tropical mountain summits correspond to low horizontal wind speeds. On the other hand, higher wind speeds can have positive effects on moisture advection and orographic lifting and can, at lower levels, enhance evap-oration from the surface and therefore convection (e.g. Jo-hansson and Chen, 2003; Roe, 2005). This process is most
interesting during the warm half of the year, when surface moisture from local sources like lakes, soil moisture, the ac-tive layer of permafrost, snow- and glacier melt is available. Moisture recycling plays an important role in precipitation on the TP (e.g. Araguás-Araguás et al., 1998; Trenberth, 1999); on average, more than 60 % of moisture needed for precip-itation falling on the inner TP is provided by the TP itself (Curio et al., 2015).
The core of the subtropical westerly jet (SWJ) occurs at the 200 hPa level. Over the Tibetan Plateau the jet reaches down to 300 hPa and still has an effect there and also at lower levels. This was shown for the HAR by Maussion et al. (2014). The strength and location of the jet influences the hydro-climate of the Tibetan Plateau and central Asia (e.g. Schiemann et al., 2009). The precipitation seasonality in the north-western parts of the study region is especially re-lated to the position of the jet (Schiemann et al., 2008). Gar-reaud (2007) pointed out that stronger than normal low-level westerlies lead to more precipitation on the windward side of meridionally orientated mountain ranges (orographic pre-cipitation), while high wind speeds at mountain tops lead to rather dry conditions because of intensified downdrafts. This process is called the rain shadow effect. But he also shows this could lead to more precipitation on the lee side because more cloud particles are advected and disturbances can over-come the topographic barrier with the help of higher wind speeds, which would lead to more frontal or cyclonic precip-itation. This case already shows that the influence each of the dynamic controls has on precipitation depends on many fac-tors and that this influence varies highly regarding time and space.
The influence of the vertical wind speed on precipitation depends on the direction of the vertical wind, i.e. on whether it is an updraft or a downdraft (Rose et al., 2003). Up-drafts have a positive impact on precipitation because they can boost or enhance convection and are a key element for orographic precipitation on the windward side of mountain ranges, while downdrafts (e.g. on the lee side of mountain ranges) and subsidence lead to the inhibition of convection and cloud dispersal. The expectation is that we have mainly positive correlations of vertical wind with precipitation: high upward winds cause higher precipitation and higher down-ward winds cause less precipitation.
Atmospheric water transport (AWT) is not only a dynamic precipitation control because it is a product of atmospheric moisture content and wind speed (and direction). The posi-tive effect of AWT on precipitation variability due to mois-ture supply is described in, for example, Barros et al. (2006) and Giovannettone et al. (2009). Therefore, we assume that there is always a positive correlation between AWT and cipitation. But high AWT does not automatically lead to pre-cipitation development, which was shown, for example, by Curio et al. (2015) for the Qaidam Basin where the prevail-ing atmospheric subsidence inhibits convection.
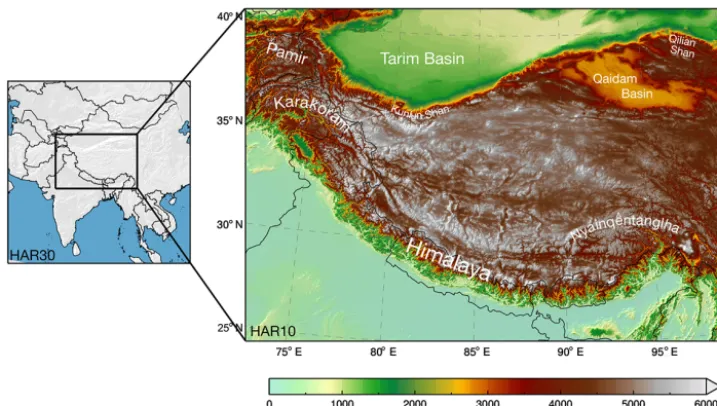
Figure 1.Map of the Weather and Research Forecasting (WRF) model domain HAR10 (high Asia domain) and its location nested in the larger domain HAR30 (south–central Asia domain). Geographical locations are indicated in white.
i. to analyse the impact of selected dynamic variables on the spatial and temporal variability of precipitation
ii. to examine whether the different factors that control precipitation variability act in the same way in differ-ent regions and at differdiffer-ent times
iii. to gain a better understanding of the role of the midlati-tude westerlies and the summer monsoon systems in the precipitation distribution on the TP.
In the following section, we describe the data and methods used in this study. Section 3 presents the precipitation sea-sonality on the TP and adjacent mountain ranges based on the HAR, using a cluster analysis. The focus of the study is the period 2001–2013. Afterwards we analyse the correlations between the four selected dynamic variables and precipita-tion regarding seasonality and spatial variability. A principal component analysis of this correlations is then used to detect the dominant patterns. The results and their uncertainties are discussed in Sect. 4. In Sect. 5, we draw conclusions from our study.
2 Data and methodology
2.1 The High Asia Refined analysis
This study is based on the HAR. The HAR has been pro-duced using the advanced research version of the Weather and Research Forecasting model (WRF-ARW; Skamarock and Klemp, 2008) version 3.3.1 to dynamically downscale the Operational Model Global Tropospheric Analyses (final analyses, FNL; data set ds083.2), a global gridded data set. The HAR dataset, its modelling, forcing, and re-initialization
strategies are described in detail by Maussion et al. (2011, 2014). The HAR data set currently covers the period from October 2000 to September 2014 and will be updated con-tinuously. The first domain of the HAR encompasses most parts of south–central Asia with a spatial resolution of 30 km and temporal resolution of 3 h (HAR30). High Asia and the Tibetan Plateau are the focus of a second nested domain with a spatial resolution of 10 km and temporal resolution of 1 h (HAR10). A map of the HAR10 domain and its location in the parent domain HAR30 are shown in Fig. 1. In this study we analyse the processes on the TP and the surrounding high mountain ranges and therefore use the HAR10 data only. The calculation of the vertically integrated atmospheric water transport can be found in Curio et al. (2015). For this study the HAR data are used on a daily basis.
HAR is able to reproduce orographic precipitation features as documented by Bookhagen and Burbank (2010). Maussion et al. (2014) state that these qualitative considerations cannot provide a quantitative uncertainty value. Curio et al. (2015) compared the HAR30 atmospheric water transport (AWT) with ERA-Interim (Dee et al., 2011). They found similar pat-terns; the differences being related to the different spatial resolutions and thus a better representation of the underly-ing topography by the HAR. In the HAR data, the blockunderly-ing of AWT from the Bay of Bengal by the Himalayas is more pronounced, and the results show the importance of merid-ionally orientated high mountain valleys for moisture supply to the Tibetan Plateau. We have compared the 300 hPa wind of the HAR10 data set with ERA-Interim. Figure S1 (see the Supplement) shows that they are in a good agreement with each other. Due to the daily re-initialization strategy used to generate the HAR data set, the wind fields in higher levels cannot evolve as far away from the forcing data as this is possible for longer model runs. The question of how large the uncertainties of the HAR data and especially precipitation are and how we can estimate them is a topic which should be investigated more in detail. Since there are no other gridded data sets with a comparable high temporal and spatial res-olution, the possibilities to validate the HAR are generally limited and will be the subject of future research.
2.2 Methodology
The selection of precipitation controls relies on well-studied relations of these factors with precipitation (e.g. Back and Bretherton, 2005; Garreaud, 2007; Shinker et al., 2006), but these controls were not investigated at high spatial and tem-poral resolution in high-mountain Asia until now.
The current study is based on the HAR10 data set for the study period 2001–2013 (all entire years available). Starting point of this study is an analysis of the precipitation season-ality on the TP using the k-means clustering method (e.g. Wilks, 1995). The percentages of monthly contribution to annual precipitation and not the precipitation amounts were used to define seven classes with different precipitation sea-sonality. This has the advantage that, in an area like high Asia where the differences in precipitation amounts vary strongly between regions and seasons, the regions were made compa-rable by this method. We conducted the cluster analysis with other numbers of classes (5–9), but the chosen number of seven classes led to the best ratio between coherent patterns and sufficient distinction between classes. This analysis fol-lows the approach of Maussion et al. (2014), who used the clustering to detect glacier accumulation regimes on the TP. Their input data were restricted to glaciated areas only. Our current analysis expands the database to the entire TP and surrounding regions, using all grid points of the HAR10 do-main.
For all further analysis daily averaged HAR data are used. Because we are only interested in precipitation days, the data
set is stratified using a daily precipitation threshold. This is done month-wise. For example, all analyses for July depend on the data for each July day during the period 2001–2013; these are 31×13 days, i.e. 403 days in total. Precipitation days for a grid point are defined as days with a mean daily precipitation rate of at least 0.1 mm, which is a commonly used minimum value to define precipitation days (e.g. Polade et al., 2014; Liu et al., 2011; Bartholy and Pongracz, 2010; Frei et al., 1998). The threshold was basically used to filter out numerical artefacts and not to exclude events from the database.
The daily precipitation rate at each grid point is calculated as the mean precipitation rate for all grid points within an area of 15×15 grid points around the specific grid point. The time mask for precipitation days is then applied to the four variables used as precipitation controls. The number of precipitation days can vary distinctly between regions and seasons. Each of the dynamical variables is correlated with the precipitation using the Spearman rank correlation. This is done month-wise for all precipitation days in a specific month during the study period and for each grid point in the HAR10 data set. Using correlations avoids problems asso-ciated with the exact precipitation rates and amounts falling on the TP, which are hard to measure and to model exactly. The Spearman rank correlation uses the ranks of the values and not the values itself, which makes the correlations in-dependent of the real data and more robust against outliers. This makes it easier to compare regions with very different precipitation amounts with each other and helps to reduce the effects of extreme events on the correlation results. We are aware of the fact that ranking the data leads to a slight information loss compared to the real values. We are sure that for our purpose the advantages are bigger than the dis-advantages. Only correlations, which are significant at the 95 % level, are plotted. The statistical significance of the cor-relations was tested using a two-tailed test to determine the deviation from 0 (Numerical Recipes, The Art of Scientific Computing, 1992). The calculation oft the statistical signifi-cance is described more in detail in the Supplement. A prin-cipal component analysis (PCA) is performed for the results of the correlations with precipitation to detect the dominant relationships.
3 Results
3.1 Precipitation seasonality
Figure 2.Precipitation clusters (left) and the mean annual cycle of percentage contribution of monthly precipitation to annual precipitation for each cluster (right).
monsoonal precipitation class because the precipitation per-centage increases from June onwards, the onset period of the Indian summer monsoon. During July and August more than 50 % of the annual precipitation falls in this regions, while from October to May the monthly precipitation amount is below 5 % of the annual precipitation. The yellow class has a much broader and less pronounced summer precipitation maximum and the increase and decrease proceed with simi-lar rates. The annual cycle of precipitation in this class is de-termined by the seasonal cycle of solar forcing and therefore convective activity. The green class represents a transition zone between the monsoonal and convective classes where the monsoon can have an influence but is not dominant. This means that both monsoonal precipitation and/or only solar-forced convective precipitation can occur.
The naming convention does not mean that the monsoonal class precipitation is not of convective nature, but it should emphasize that the precipitation (development/variability) is influenced by the monsoon, which is associated with the ad-vection of tropical air masses. The monsoonal class is a sub-set of the convective class. The timing and strength of the precipitation maximum provides an indication of a different forcing. In the monsoonal class the precipitation maximum is higher, starts during the Indian summer monsoon onset, and persists for a shorter time period. The monsoonal class is divided into a northern and southern part by the Himalayas.
The grey-blue class experiences its precipitation maxi-mum in winter and is dominated by the influence of the mid-latitude westerlies. This class occurs mainly in the Pamir– Karakoram–western Himalayas (PKwH) region, as one co-herent pattern, and additionally in the eastern part of the Tarim Basin. The precipitation maximum is much lower, but the minimum values are higher than in the classes dominated by summer precipitation, which shows that the intra-annual variability is lower and the values vary between 15 and 5 % but are never below 5 % in the mean. This could lead to the
assumption that the influence of the midlatitude westerlies is more constant year-round, while the monsoon has a stronger but temporally more limited influence on precipitation on the TP.
The light blue class exhibits a more evenly distributed sea-sonality of precipitation during spring and summer with a minimum in November. This class surrounds the grey-blue cluster at the southern flank of the western Himalayas (west-ern notch), in the south-east(west-ern TP, and in the east(west-ern Tarim Basin. It is interesting that the region in the south-east of the TP, where the Brahmaputra Channel enters the TP, be-longs to a different class than the surroundings, which are di-vided between the three convectively dominated classes blue, yellow, and green. Maybe there is stronger influence from AWT, which would make this region more similar to the sur-roundings of the PKwH region regarding the factors control-ling precipitation variability. Another possible reason could be the occurrence of extratropical cyclones which propagate eastward along the Himalayas and are then terrain-locked by the eastern notch of the Himalayas (Norris et al., 2015). This would lead to a higher moisture supply to the region and therefore higher amounts of orographic precipitation. This kind of terrain locking of the westerly flow in winter is described in detail for the western notch of the Himalayas by Norris et al. (2015). This mechanism would explain the higher shares of winter precipitation in the region around the Brahmaputra Channel and the affiliation to the same class oc-curring at the southern flank of the western Himalayas in the western notch.
Figure 3.Coefficient of correlation (rho) between horizontal wind speed at 300 hPa (WS300) and precipitation for all months (01–12). Positive correlations are denoted in red, while negative correlations are denoted in blue.
of the annual precipitation occurs. The annual cycle of the red class seems to be delayed relative to the purple one, and the period of maximum precipitation is only 1 month long. In spring the values are lower but higher in late summer and autumn, while they are almost the same during winter.
The high mountain ranges of the Himalayas and Kun-lun and Qilian Shan exhibit a complex structure of different classes over relatively short distances and therefore exhibit no coherent patterns. This holds true also for the border area between the Karakoram and the Tarim Basin. The mountain-ous region of the Pamir and Karakoram is represented by only one class, which implies that this region is mainly in-fluenced by one atmospheric forcing (midlatitude westerlies) or that different controls have the same impact in this region. The other mountain ranges lie in regions where an interplay of different controls occur, and the temporal and spatial vari-ability is larger on smaller scales.
3.2 Correlation of dynamic variables and precipitation 3.2.1 Horizontal wind speed
Horizontal wind speed at 300 hPa (WS300)
The correlations between WS300 and precipitation are shown in Fig. 3. There are high positive correlations in win-ter in the PMwH region; this is the time of the year when the majority of precipitation falls in this region (e.g. Curio et al., 2015; Maussion et al., 2014). The precipitation in the PMwH region is mainly cyclonic/frontal precipitation and is associated with western disturbances (Dimri et al., 2015). There are only negative correlations in the southern and
Figure 4.Coefficient of correlation (rho) between horizontal wind speed at model level 10 (WS10) and precipitation for all months (1–12). Positive correlations are denoted in red, while negative correlations are denoted in blue.
Figure 5.Coefficient of correlation (rho) between vertical wind speed at 300 hPa (WS300) and precipitation for all months (01–12). Positive correlations are denoted in red, while negative correlations are denoted in blue.
Horizontal wind speed at model level 10 (WS10)
Figure 4 shows that the correlations between WS10 and pre-cipitation are positive in the PMwH region in winter as they are for WS300, but the region is larger, especially the region with correlations > 0.6. The reason for the positive correla-tions is again the enhanced moisture supply due to higher wind speeds and therefore also more orographic
sum-Figure 6.Mean vertical wind speed at 300 hPa for January (01) and July (07).
Figure 7.Coefficient of correlation (rho) between atmospheric water transport (AWT) and precipitation for all months (01–12). Positive correlations are denoted in red, while negative correlations are denoted in blue.
mer. This is because of the fact that the wind speed in the boundary layer can enhance evapotranspiration from the sur-face (e.g. lakes; snow-, glacier, and permafrost melt), which leads to more moisture in the lower atmosphere available for precipitation. This correlation again emphasizes the impor-tance of moisture recycling on the TP. In winter the corre-lations on the TP are mainly negative because the effect of enhanced evapotranspiration is not active due to the fact that all potential moisture sources are frozen during this time of the year. Strong negative correlations occur south of the Hi-malayas and in northern parts of India in summer. When the air flow from the south hits the mountain barrier, parts of the flow are redirected to the south-east and north-west. The flow becomes divergent, which forces the air above to descend,
which in turn leads to unfavourable conditions for growing convection and therefore precipitation.
3.2.2 Vertical wind speed
on the lee side because the downdrafts suppress precipita-tion development. In the case of a stronger horizontal flow to the mountains, there is stronger moisture advection and oro-graphic precipitation, and therefore the downdrafts on the lee side are no longer able to suppress precipitation. This leads to the simultaneous occurrence of precipitation and downdrafts, which is the reason for the negative correlation patterns on the lee side of mountain ranges found in the western parts of the study region.
3.2.3 Atmospheric water transport (AWT)
Figure 7 shows the correlations between AWT and precipi-tation. The entire study region is dominated by positive cor-relations during the year (Fig. 7). The highest positive corre-lations occur in winter and early spring in the PKwH region, where the correlation coefficient exceeds 0.8 in most regions. This is the time of the year when the maximum precipitation occurs in this region (Fig. 2). The annual contribution of con-vective precipitation in this region is below 10 % (Maussion et al., 2014), but the region exhibits orographic precipitation triggered by the advection of moist air masses with the west-erly flow and westwest-erly disturbances (Cannon et al., 2014). Therefore, a higher moisture supply leads naturally to more precipitation. The positive correlations in the western parts of the study region persist during the course of the year, even if their extent and strength varies. The positive correlations extend to the TP, the whole Himalayan arc, and along the northern border of the TP (Kunlun and Qilian Shan). These seem to be the moisture supply routes along the branches of the midlatitude westerlies.
A second centre of positive correlation which is persis-tent is found in the extreme south-east of TP, the region where the Brahmaputra Channel enters the TP. This region exhibits less convective precipitation on annual timescales (Maussion et al., 2014), but it is surrounded by regions with high convective precipitation rates. This explains the fact that this region belongs to a different precipitation seasonality class than its surroundings (Fig. 2). In January and Febru-ary, the Himalayan arc exhibits mostly positive correlations and connects the area in the western parts of the domain with
is mostly convective and that the moisture comes from local sources, so that the advection of moist air masses is less im-portant. In large areas of the domain, the precipitation maxi-mum occurs in July and August;∼30 % of the annual precip-itation falls on the central and southern TP during this time (Maussion et al., 2014).
The regions where the highest positive correlations occur are the regions where the precipitation maximum occurs dur-ing winter, matchdur-ing the grey-blue precipitation seasonality class (Fig. 2).
There are only a few regions and months where negative correlations occur, in the Tarim Basin during winter and in the central Himalayas and northern India during summer.
3.3 Principal components
So far the spatio-temporal variability of correlation between dynamical variables and precipitation for the TP and sur-rounding high mountain ranges has been discussed. To detect the dominant patterns in the relationship between the differ-ent variables and precipitation and to find the time of the year a control is most efficient, we conducted a principal compo-nent analysis (PCA) for each of the correlation sets. Because the dominant modes are the main interest, only the first two principal components (PCs) are analysed, which typically ex-plain most of the variance of the data and can also exex-plain important processes. For completeness, plots for all PCs can be found in the Supplement of this study (Figs. S2–S5). The explained variance of PC1 lies between 40 and 50 % and at around 20 % for PC2 for all sets of correlations. The higher PCs explain lower shares of variance, less than 10 % already for PC3 and only 1 % for PC12.
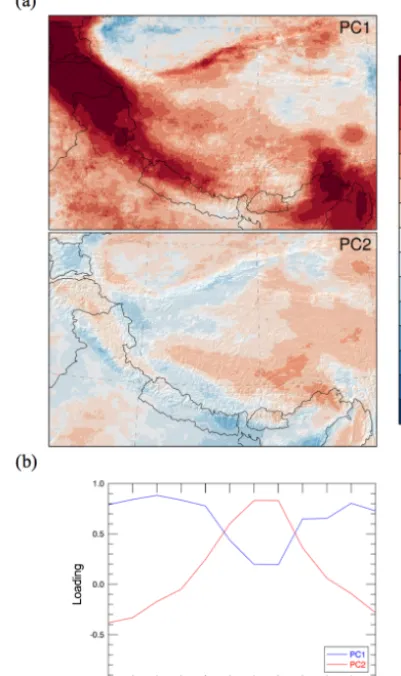
domi-Figure 8.Scores of first two principal components PC1 and PC2 for the correlation between horizontal wind speed at 300 hPa (WS300) and precipitation(a)(positive values are denoted in red, while neg-ative values are denoted in blue) and the monthly loadings(b)for both PCs.
nant pattern. The loadings are high all year-round but highest in spring and lowest in July. This implies that this pattern is not particularly influenced by the monsoon system or, if it is, just in the onset period. We assume that the still relatively high loading is a result of the fact that there is high solar forcing and therefore convective activity on the TP which is negatively influenced by higher wind speeds at 300 hPa. The loadings of the second PC (PC2) show a completely differ-ent annual cycle. They are strongly negative in winter and strongly positive in summer; it is just in the transition seasons that the loadings are around zero. For this pattern winter and summer play a similar role, even with opposing arithmetic signs. This is an annual cycle pattern. The first two PCs to-gether account for∼60 % of the total variance of the data.
The first PC (PC1) for the correlation between WS10 and precipitation (Fig. 9a) shows a pattern dominated by the win-ter and early spring situation, high positive scores in the PKwH region and the region around the Brahmaputra
Chan-Figure 9.Scores of first two principal components PC1 and PC2 for the correlation between horizontal wind speed at model level 10 (WS10) and precipitation(a)(positive values are denoted in red, while negative values are denoted in blue) and the monthly loadings
(b)for both PCs.
nel, and negative scores on the central and eastern TP. The loadings (Fig. 9b) are very high (∼0.8) from November to April. Only in July and August are the loadings slightly neg-ative. The positive correlations during summer on the TP are not visible in PC1; they occur in PC2, which has loadings that have a directly opposing annual cycle, meaning high positive values in summer and slightly negative values in winter. The first two PCs together explain∼65 % of the variance in the data.
Figure 10.Scores of first two principal components PC1 and PC2 for the correlation between vertical wind speed at 300 hPa (W300) and precipitation(a)(positive values are denoted in red, while neg-ative values are denoted in blue) and the monthly loadings(b)for both PCs.
effective during that time of the year but has a mostly positive impact on precipitation year-round. PC2 exhibits much lower values. The annual cycle of the loadings shows that winter and summer both have high loadings (∼0.5) but with differ-ent signs: positive in summer and negative in winter. Spring and autumn exhibit very low factor loadings and are more or less only transition periods between winter and summer. The first two PCs together explain∼70 % of the variance in the data.
The loadings of the first two PCs of the correlation be-tween AWT and precipitation (Fig. 11b) exhibit a similar an-nual cycle as the loadings of the correlation between WS300 and precipitation. For PC1 the loadings are high (between 0.6 and 0.9) in winter, spring, and autumn and low in sum-mer (∼0.2). This again emphasizes the finding that AWT is a precipitation control mainly in regions and seasons where moisture advection and frontal/cyclonic precipitation is dom-inant. The pattern of PC2 (Fig. 11a) is important mainly in
Figure 11.Scores of first two principal components PC1 and PC2 for the correlation between atmospheric water transport (AWT) and precipitation(a)(positive values are denoted in red, while negative values are denoted in blue) and the monthly loadings(b)for both PCs.
summer months (loadings > 0.8 in July and August), while the winter months exhibit negative loadings.
In summary, the annual cycle of the loadings for each of the first two PCs, show a similar annual cycle. PC1 is mostly dominated by all seasons except summer and mainly by the winter and spring situations, whereas PC2 is determined by summer conditions. Winter conditions also have high load-ings but with a negative sign, while spring and autumn only represent transition periods between these situations.
4 Discussion
4.1 General discussion of results
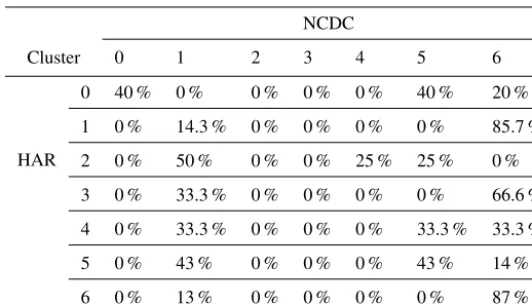
Figure 12.Map of precipitation clusters for HAR10 grid points (left) and the associated NCDC stations (middle). The map on the right shows whether the clusters match (green dots) or not (red dots).
summer monsoon, exhibits strong negative correlations with precipitation and explains 73 % of the interannual mass bal-ance variability of the Zhadang glacier, located at the Nyain-qênthangla range in the central TP. They argue that weak flow conditions favour convective cell growth. This together with the high positive correlations, in regions and seasons where frontal or cyclonic precipitation is dominant, shows the strong influence of the subtropical westerly jet (midlat-itude westerlies) not only on the western parts of the study region but also on the TP itself, which previously has mostly been described as mainly influenced by the monsoon system (Hren et al., 2009; Tian et al., 2007; Yang et al., 2014).
Previous studies have stated that the precipitation on the TP is controlled by the midlatitude westerlies in winter and the Indian and east Asian summer monsoon in summer (e.g. Hren et al., 2009; Tian et al., 2007; Yang et al., 2014). This assumption is based only on precipitation timing, but Curio et al. (2015) and Mölg et al. (2014) have already shown that the midlatitude westerlies also have an impact on summer precipitation. The current study highlights their findings by the detection of the negative influence of the high horizon-tal wind speeds on precipitation (development, variability, amount) on the TP in summer.
Spiess et al. (2015) showed that in summer, increased hor-izontal wind speeds at 400 hPa have a positive effect on the height of the equilibrium line altitude at glaciers in different regions on the TP; they assumed that this could be caused by a reduction in convective precipitation due to high wind speeds. Exactly this process is shown by the strong negative correlations between horizontal wind speed at 300 hPa and precipitation in summer on the TP (Fig. 3).
The identified positive correlations of the wind speed in the boundary layer with precipitation in summer on the TP agree with the findings of Back and Bretherton (2005), who detected positive correlations between near-surface wind speed and precipitation only when convection can be trig-gered easily. Their study region was the Pacific ITCZ, but we assume that their findings are also valid for the TP in summer, where the convective activity is high and enough moisture is available at the surface.
The fact that the positive correlation of AWT with pre-cipitation in summer on the central TP is not as high as
in the western parts of the study region in winter means that here the convection is able to produce precipitation us-ing the moisture from local sources, which emphasizes the importance of moisture recycling, as shown by Curio et al. (2015) using HAR data and by Chen et al. (2012), Joswiak et al. (2013), and Kurita and Yamada (2008), among others. Nevertheless, AWT still has a positive effect on precipitation, but it is not an essential control during this time of the year on the central TP.
Additionally, we calculated the vertically integrated atmo-spheric moisture content for the HAR and repeated the cal-culation of correlation for this variable. The results (Fig. S6 in the Supplement) show high positive correlations between the atmospheric moisture content and precipitation through-out the year, as expected. The correlation patterns can only explain parts of the precipitation variability on the TP. This highlights how highly effective the dynamic controls are on precipitation variability, differentiated in space and time.
4.2 Sources of uncertainties
As always the uncertainty of the results mainly depends on the accuracy of the data themselves, the aggregation of hourly data to daily means, and the statistical methods used to analyse the data. The HAR precipitation and other vari-ables, e.g. wind speed and direction and temperature, have been validated against other gridded data sets – global re-analyses and remote sensing data – and observations from weather stations by Maussion et al. (2011, 2014), as de-scribed in Sect. 2.1.
6 0 % 13 % 0 % 0 % 0 % 0 % 87 %
the western, the south-eastern, and north-eastern parts of the domain, where at least four different clusters occur on very small spatial scales. Table 1 shows which percentage of the stations, which should all be in one specific class regarding their associated HAR grid points, falls in which of the seven possible classes. One has to take into account that there is always a distance up to a few kilometres between the NCDC stations and the respectively associated HAR grid point. This also can cause huge differences between the elevation and al-titude of stations and grid points due to the complex topog-raphy of the study region, which in turn has an effect on the precipitation distribution. Additionally, the quality of the sta-tion data is not always satisfactory and the time series often show gaps, leading to a smaller database.
We decided to use the wind speed at the 300 hPa level be-cause the wind shear at this height more strongly suppresses deep convection than at the 200 hPa level, where the core of the jet lays. Also we assumed that the results would not change overall using the wind speed at 200 hPa. To prove this, we repeated the correlation analysis between wind speed and precipitation for the wind speed at 200 hPa (Fig. S7 in the Supplement). The results are very similar. The correlations at the 300 hPa level (Fig. 3) are slightly higher because the neg-ative effect of higher wind speeds on precipitation by cutting off deep convection is higher at this level than at 200 hPa.
We varied the k for clustering from 5 to 9 (Fig. S8 in the Supplement). We found 7 to be the optimalkfor the re-cent study since it gave us good coherence within the classes and sufficient distinctions between them. We determined this qualitatively by looking at the plots for the different num-bers of clusters. We first conducted the cluster analysis with five (Fig. S8a in the Supplement) clusters, like Maussion et al. (2014). But since we included a much higher number of grid points (we analysed the entire Tibetan Plateau), the re-sults for the areas included in both analyses look slightly dif-ferent, especially in the Karakoram and Tien Shan. By in-creasing the number of clusters to six (Fig. S8b in the
Sup-plement), one cluster that covers most parts of the northern part of the study region – the northern Tibetan Plateau and Tarim Basin – breaks up into two clusters. Setting the number to seven (Fig. S8c in the Supplement), we get more variation in the Karakoram and Tien Shan which looks more similar to the cluster distribution achieved by Maussion et al. (2014). Using a higher number of clusters (Fig. S8d and e in the Sup-plement) led to the occurrence of more clusters of smaller size which are not as distinct from each other as the larger ones. In general, it would be interesting to have more clusters to get a higher spatial differentiation. But by increasing the cluster number the spatial coherence decreases and therefore the interpretability also decreases. We decided to use seven clusters as a compromise between higher spatial differenti-ation and less spatial coherence. Since the core areas of the clusters stay stable while changing the number of clusters, we assume that the clustering approach is suitable to analyse the seasonality of precipitation on the TP.
Of course using different parameterizations and higher spatial resolutions would change the precipitation values and the spatial and temporal distribution of the precipitation. But we assume that this would not change the main results of this study since we use rank correlations which are independent of the mean values and scaling of the input variables.
use of different significance levels, we repeated the analysis with the significance level 0.01 for the correlation between wind speed in 300 hPa and precipitation (Fig. S9 in the Sup-plement) and compared the results with the results gained using 0.05 as significance level (Fig. 3). The resulting pat-terns do not change very much. The areas with negative and positive correlations are a little bit smaller, but the changes occur where the values are already lower (at the borders of the correlation patterns). The regions with the highest corre-lations stay stable and even small areas of positive or negative correlations do not disappear.
The number of precipitation days on which all analysis depends is variable regarding the analysed months and re-gions, but we assume that the condition of at least 13 precip-itation days per grid point, applied for of all days of a specific month during the study period 2001–2013, ensures a reason-able data basis. Grid points which do not match this criterion are excluded from further analysis.
Since we only look at the first two PCs, it is possible that mechanisms controlling precipitation, which appear in higher PCs, are not considered in this study. The current study is limited to dominant patterns and thereby to the first two PCs because they together explain more than 60 % of the variance of the data. Patterns with lower explained vari-ance and transient patterns will be the subject of a subsequent study.
5 Conclusion
Gaining a better understanding of the relationship between dynamical variables and precipitation and the underlying processes is important since precipitation is the key element of the hydrological cycle of the TP and the surrounding high mountain ranges. Precipitation variability has a large im-pact on the water availability in the densely populated down-stream regions of India, Pakistan, and south-east Asia by di-rectly governing river runoff by precipitation or with a time lag by snowmelt.
This study shows that different factors influence precipita-tion in different regions of the TP and adjacent high moun-tain ranges during different times of the year and in different ways. For example, the 300 hPa wind speed has a positive effect in the western parts of the study region in winter and spring, while it has a negative effect on precipitation on the TP during summer. This clearly shows that the impact of the midlatitude westerlies is strong, not only in winter by en-hancing moisture advection for orographic and frontal pre-cipitation in the western parts of the study region but also by cutting off deep convection during summer on the TP and in other regions and seasons where and when precipitation is mainly convective.
The negative effect of high horizontal wind speeds on pre-cipitation plays an important role in regions and seasons which are dominated by convective precipitation, e.g. the
Ti-betan Plateau in summer (Maussion et al., 2014). The pos-itive effect occurs in regions with mainly frontal/cyclonic or orographic precipitation. Precipitation benefits from en-hanced moisture transport by strengthened atmospheric flow, especially when the moisture flow is lifted up by orographic forcing. This plays an important role in our study region be-cause of the high mountain ranges surrounding the Tibetan Plateau.
Therefore, the TP and the entire study region can be parti-tioned by considering the dominant form of precipitation that occurs: cyclonic/frontal or convective precipitation. This en-ables us to more clearly determine the relevancy/importance of the monsoon system and the midlatitude westerlies for the precipitation distribution. The classification of precipitation has been determined by cluster analysis and shows a mostly monsoonally influenced class, a convective class, and a hy-brid class in between. This highlights that it is not possible to draw an exact distinction regarding the extent of the monsoon and that there will always be a relatively broad area between monsoonally influenced precipitation and solely convection-dominated precipitation caused by the interannual variability of monsoon strength and other factors.
Perhaps it is possible to say that the precipitation on the central TP in summer is influenced by the monsoon system regarding moisture supply; however, moisture recycling is also important, and the midlatitude westerlies act as a con-trol regarding the suppression or enhancement of precipita-tion due to the strong negative effect of high horizontal wind speeds on the development of deep convection.
A next step will analyse the combined effects of precip-itation controls, since the current study has shown that the controls are not independent of each other. We intend to use a combination of PCA of the detected dominant patterns and cluster analysis to detect control regimes, as in Forsythe et al. (2015), to obtain a climate classification for the Hi-malayan arc and its surroundings. These regimes can perhaps help to explain regional features of glacier mass balance, like the so-called Karakoram anomaly (e.g. Hewitt, 2005) or ob-served lake level changes (e.g. Liu et al., 2010; Zhang et al., 2011), which show a different behaviour compared to the sur-rounding regions.
6 Data availability
Trends in Water Balance Components of Benchmark Drainage Basins on the Tibetan Plateau”) under the code 03G0804A and by the German Research Foundation (DFG) Priority Programme 1372, “Tibetan Plateau: Formation – Climate – Ecosystems” within the DynRG-TiP (“Dynamic Response of Glaciers on the Tibetan Plateau to Climate Change”) project under the codes SCHE 750/4-1, SCHE 750/4-2, SCHE 750/4-3. We would like to thank the four anonymous referees for their thoughtful comments, criticism, and suggestions on an earlier version of this paper.
Edited by: M. Werner
Reviewed by: four anonymous referees
References
Araguás-Araguás, L. and F. K.: Stable isotope composition of pre-cipitation over southeast Asia, J. Geophys. Res., 103, 28721– 28742, doi:10.1029/98JD02582, 1998.
Back, L. E. and Bretherton, C. S.: The relationship between wind speed and precipitation in the Pacific ITCZ, J. Climate, 18, 4317– 4328, doi:10.1175/JCLI3519.1, 2005.
Barros, A. P., Chiao, S., Lang, T. J., Burbank, D., and Putkonen, J.: From weather to climate – Seasonal and interannual variability of storms and implications for erosion processes in the Himalaya, Geol. Soc. Am. Sp., 398, 17–38, doi:10.1130/2006.2398(02), 2006.
Bartholy, J. and Pongracz, R.: Analysis of precipitation conditions for the Carpathian Basin based on extreme indices in the 20th century and climate simulations for 2050 and 2100, Phys. Chem. Earth, 35, 43–51, doi:10.1016/j.pce.2010.03.011, 2010. Bookhagen, B. and Burbank, D. W.: Toward a complete Himalayan
hydrological budget: Spatiotemporal distribution of snowmelt and rainfall and their impact on river discharge, J. Geophys. Res., 115, F03019, doi:10.1029/2009JF001426, 2010.
Bothe, O., Fraedrich, K., and Zhu, X.: The large-scale circulations and summer drought and wetness on the Tibetan plateau, Int. J. Climatol., 30, 844–855, doi:10.1002/joc.1946, 2010.
Cannon, F., Carvalho, L. M. V., Jones, C., and Bookhagen, B.: Multi-annual variations in winter westerly disturbance ac-tivity affecting the Himalaya, Clim. Dynam., 44, 441–455, doi:10.1007/s00382-014-2248-8, 2014.
Chen, B., Xu, X.-D., Yang, S., and Zhang, W.: On the origin and destination of atmospheric moisture and air mass over
597, doi:10.1002/qj.828, 2011.
Dimri, A. P., Niyogi, D., Barros, A. P., Ridley, J., Mohanty, U. C., Yasunari, T., and Sikka, D. R.: Western Disturbances: A review, Rev. Geophys., 53, 225–246, doi:10.1002/2014RG000460, 2015. Findell, K. L.: Atmospheric controls on soil moisture-boundary layer interactions: Three-dimensional wind effects, J. Geophys. Res., 108, 1–21, doi:10.1029/2001JD001515, 2003.
Forsythe, N., Blenkinsop, S., and Fowler, H. J.: Exploring objec-tive climate classification for the Himalayan arc and adjacent re-gions using gridded data sources, Earth Syst. Dynam., 6, 311– 326, doi:10.5194/esd-6-311-2015, 2015.
Frei, C., Schär, C., Lüthi, D., and Davies, H. C.: Heavy precipita-tion processes in a warmer climate, Geophy. Res. Lett., 25, 1431, doi:10.1029/98GL51099, 1998.
Garreaud, R. D.: Precipitation and circulation covari-ability in the extratropics, J. Climate, 20, 4789–4797, doi:10.1175/JCLI4257.1, 2007.
Giovannettone, J. P. and Barros, A. P.: Probing Regional Oro-graphic Controls of Precipitation and Cloudiness in the Cen-tral Andes Using Satellite Data, J. Hydrometeorol., 10, 167–182, doi:10.1175/2008JHM973.1, 2009.
Hahn, D. and Manabe, S.: The role of mountains in the south Asian monsoon circulation, J. Atmos. Sci., 32, 1515–1541, 1975. Hewitt, K.: The Karakoram anomaly? Glacier
expan-sion and the’elevation effect, Karakoram Himalaya, Mt. Res. Dev., 25, 332–340, doi:10.1659/0276-4741(2005)025[0332:TKAGEA]2.0.CO;2, 2005.
Hren, M. T., Bookhagen, B., Blisniuk, P. M., Booth, A. L., and Chamberlain, C. P.:δ18O andδD of streamwaters across the Hi-malaya and Tibetan Plateau: Implications for moisture sources and paleoelevation reconstructions, Earth Planet. Sci. Lett., 288, 20–32, doi:10.1016/j.epsl.2009.08.041, 2009.
Johansson, B. and Chen, D.: The influence of wind and topography on precipitation distribution in Sweden: Statistical analysis and modelling, Int. J. Climatol., 23, 1523–1535, doi:10.1002/joc.951, 2003.
Joswiak, D. R., Yao, T., Wu, G., Tian, L., and Xu, B.: Ice-core evidence of westerly and monsoon moisture contribu-tions in the central Tibetan Plateau, J. Glaciol., 59, 56–66, doi:10.3189/2013JoG12J035, 2013.
Tibetan Plateau during the Monsoon Season, J. Hydrometeorol., 9, 760–775, doi:10.1175/2007JHM945.1, 2008.
Liu, B., Xu, M., and Henderson, M.: Where have all the showers gone? Regional declines in light precipitation events in China, 1960–2000, Int. J. Climatol., 31, 1177–1191, doi:10.1002/joc.2144, 2011.
Liu, J., Kang, S., Gong, T., and Lu, A.: Growth of a high-elevation large inland lake, associated with climate change and permafrost degradation in Tibet, Hydrol. Earth Syst. Sci., 14, 481–489, doi:10.5194/hess-14-481-2010, 2010.
Liu, W., Wang, L., Chen, D., Tu, K., Ruan, C., and Hu, Z.: Large-scale circulation classification and its links to observed precipi-tation in the eastern and central Tibetan Plateau, Clim. Dynam., 46, 3481–3497, doi:10.1007/s00382-015-2782-z, 2016. Liu, X. and Yin, Z.-Y.: Spatial and Temporal Variation of Summer
Precipitation over the Eastern Tibetan Plateau and the North At-lantic Oscillation, J. Climate, 14, 2896–2909, doi:10.1175/1520-0442(2001)014<2896:SATVOS>2.0.CO;2, 2001.
Maussion, F., Scherer, D., Finkelnburg, R., Richters, J., Yang, W., and Yao, T.: WRF simulation of a precipitation event over the Tibetan Plateau, China – an assessment using remote sensing and ground observations, Hydrol. Earth Syst. Sci., 15, 1795–1817, doi:10.5194/hess-15-1795-2011, 2011.
Maussion, F., Scherer, D., Mölg, T., Collier, E., Curio, J., and Finkelnburg, R.: Precipitation Seasonality and Variability over the Tibetan Plateau as Resolved by the High Asia Reanalysis*, J. Climate, 27, 1910–1927, doi:10.1175/JCLI-D-13-00282.1, 2014. Mölg, T. and Chiang, J.: Temporal precipitation variability versus altitude on a tropical high mountain: Observations and mesoscale atmospheric modelling, Q. J. Roy. Meteor. Soc., 135, 1439–1455, doi:10.1002/qj.461, 2009.
Mölg, T., Maussion, F., and Scherer, D.: Mid-latitude westerlies as a driver of glacier variability in monsoonal High Asia, Nature Clim. Change, 4, 68–73, doi:10.1038/nclimate2055, 2014. NCDC: Global Summary of the Day, provided by the National
Cli-matic Data Center (NCDC) available at: http://www.ncdc.noaa. gov/oa/ncdc.html, 2016.
Norris, J., Carvalho, L. M. V., Jones, C., and Cannon, F.: WRF sim-ulations of two extreme snowfall events associated with contrast-ing extratropical cyclones over the western and central Himalaya, J. Geophys. Res., 120, 3114–3138, doi:10.1002/2014JD022592, 2015.
Numerical Recipes: The Art of Scientific Computing, second edi-tion, Cambridge University Press, 1992.
Polade, S. D., Pierce, D. W., Cayan, D. R., Gershunov, A., and Dettinger, M. D.: The key role of dry days in changing re-gional climate and precipitation regimes, Sci. Rep., 4, 8 pp., doi:10.1038/srep04364, 2014.
Roe, G. H.: Orographic Precipitation, Ann. Rev. Earth Planet. Sci., 33, 645–671, doi:10.1146/annurev.earth.33.092203.122541, 2005.
Rose, B. E. J. and Lin, C. A.: Precipitation from vertical motion: A statistical diagnostic scheme, Int. J. Climatol., 23, 903–919, doi:10.1002/joc.919, 2003.
Rüthrich, F.: Lake-Related Cloud Dynamics on the Tibetan Plateau: Spatial Patterns and Interannual Variability, J. Climate, 28, 9080– 9104, doi:10.1175/JCLI-D-14-00698.1, 2015.
Schiemann, R. and Lüthi, D.: The precipitation climate of Cen-tral Asia – intercomparison of observational and numerical data sources in a remote semiarid region, Int. J. Climatol., 28, 295– 314, doi:10.1002/joc.1532, 2008.
Schiemann, R., Lüthi, D., and Schär, C.: Seasonality and Interan-nual Variability of the Westerly Jet in the Tibetan Plateau Re-gion*, J. Climate, 22, 2940–2957, doi:10.1175/2008JCLI2625.1, 2009.
Shinker, J. J., Bartlein, P. J., and Shuman, B.: Synop-tic and dynamic climate controls of North American mid-continental aridity, Quat. Sci. Rev., 25, 1401–1417, doi:10.1016/j.quascirev.2005.12.012, 2006.
Skamarock, W. and Klemp, J.: A time-split nonhydrostatic atmospheric model for weather research and forecast-ing applications, J. Comput. Phys., 227, 3465–3485, doi:10.1016/j.jcp.2007.01.037, 2008.
Spiess, M., Schneider, C., and Maussion, F.: MODIS-derived interannual variability of the equilibrium-line altitude across the Tibetan Plateau, Ann. Glaciol., 57, 140–154, doi:10.3189/2016AoG71A014, 2015.
Tian, L., Yao, T., MacClune, K., White, J. W. C., Schilla, A., Vaughn, B., and Ichiyanagi, K.: Stable isotopic variations in west China: A consideration of moisture sources, J. Geophys. Res., 112, D10112, doi:10.1029/2006JD007718, 2007.
Trenberth, K. E.: Atmospheric Moisture Recycling: Role of Advection and Local Evaporation, J. Climate, 12, 1368–1381, doi:10.1175/1520-0442(1999)012<1368:AMRROA>2.0.CO;2, 1999.
Webster, P., Magana, V., and Palmer, T.: Monsoons: Processes, pre-dictability, and the prospects for prediction, J. Geophys. Res., 103, 14451–14510, 1998.
Xu, X., Lu, C., Shi, X., and Gao, S.: World water tower: An atmospheric perspective, Geophy. Res. Lett., 35, L20815, doi:10.1029/2008GL035867, 2008.
Yang, K., Wu, H., Qin, J., Lin, C., Tang, W., and Chen, Y.: Recent climate changes over the Tibetan Plateau and their impacts on energy and water cycle: A review, Global Planet. Change, 112, 79–91, doi:10.1016/j.gloplacha.2013.12.001, 2014.
Zhang, J. W. and Atkinson, B. W.: Stability and wind shear effects on meso-scale cellular convection, Bound.-Lay. Meteorol., 75, 263–285, doi:10.1007/BF00712697, 1995.