www.atmos-meas-tech.net/5/275/2012/ doi:10.5194/amt-5-275-2012
© Author(s) 2012. CC Attribution 3.0 License.
Measurement
Techniques
Volcanic SO
2
and SiF
4
visualization using 2-D thermal emission
spectroscopy – Part 1: Slant-columns and their ratios
W. Stremme1, A. Krueger1,2, R. Harig2, and M. Grutter1
1Centro de Ciencias de la Atm´osfera, Universidad Nacional Aut´onoma de M´exico, Mexico City, Mexico 2Technische Universit¨at Hamburg-Harburg, Hamburg, Germany
Correspondence to: M. Grutter ([email protected])
Received: 26 August 2011 – Published in Atmos. Meas. Tech. Discuss.: 12 September 2011 Revised: 16 December 2011 – Accepted: 23 January 2012 – Published: 2 February 2012
Abstract. The composition and emission rates of volcanic
gas plumes provide insight of the geologic internal activ-ity, atmospheric chemistry, aerosol formation and radiative processes around it. Observations are necessary for pub-lic security and the aviation industry. Ground-based ther-mal emission infrared spectroscopy, which uses the radiation of the volcanic gas itself, allows for continuously monitor-ing durmonitor-ing day and night from a safe distance. We present measurements on Popocat´epetl volcano based on thermal emission spectroscopy during different campaigns between 2006–2009 using a Scanning Infrared Gas Imaging System (SIGIS). The experimental set-up, measurement geometries and analytical algorithms are described. The equipment was operated from a safe distance of 12 km from the volcano at two different spectral resolutions: 0.5 and 4 cm−1. The 2-dimensional scanning capability of the instrument allows for an on-line visualization of the volcanic SO2 plume and its animation. SiF4 was also identified in the infrared spectra recorded at both resolutions. The SiF4/SO2molecular ratio can be calculated from each image and used as a highly use-ful parameter to follow changes in volcanic activity. A small Vulcanian eruption was monitored during the night of 16 to 17 November 2008 and strong ash emission together with a pronounced SO2cloud was registered around 01:00 a.m. LST (Local Standard Time). Enhanced SiF4/SO2ratios were ob-served before and after the eruption. A validation of the re-sults from thermal emission measurements with those from absorption spectra of the moon taken at the same time, as well as an error analysis, are presented. The inferred propa-gation speed from sequential images is used in a subsequent paper (Part 2) to calculate the emission rates at different distances from the crater.
1 Introduction
Volcanoes are known to emit large amounts of gases into the atmosphere and contribute with 10–15 % of the global anthropogenic sulphur emissions (Halmer, 2002). The gas composition of these volcanic plumes are not well under-stood and differ for each volcano (Aiuppa, 2009). SO2from volcanoes has been detected by remote sensing methods both from the ground and from space. Its strong absorptions in the UV have been widely used by COSPEC (COrrelation SPECtrometer) and now more frequently by DOAS (Dif-ferential Optical Absorption Spectrometer) instruments to monitor its fluxes. Satellite-based instruments such as the SCHIAMACHY (SCanning Imaging Absorption SpectroM-eter for Atmospheric CartograpHY) and OMI (Ozone Mon-itoring Instrument), have also been successful in detecting volcanic plumes from space. In the infrared, global moni-toring by thermal emission measurements is now possible by sounders with enough spectral resolution such as the TES (Tropospheric Emission Spectrometer) and IASI (Infrared Atmospheric Sounding Interferometer) instruments (Clarisse et al., 2008). From the ground, infrared studies of the vol-canic plume composition have mostly used the solar absorp-tion technique but also open-path and thermal emission FTIR spectroscopy.
Fourier Transform Infrared (FTIR) spectroscopy from the ground has been applied in vulcanology for the last two decades (Notsu et al., 1993; Mori et al., 1993; Francis et al., 1996, 1998; Love et al., 1998; Burton et al., 2001; Goff et al., 2001; Duffell et al., 2001) and many more as for example the recent measurements on Popocat´epetl by Grutter et al. (2008) and Stremme et al. (2011). Passive spectroscopy works
A
C
O
B
A
B
B
B
B
b)
a)
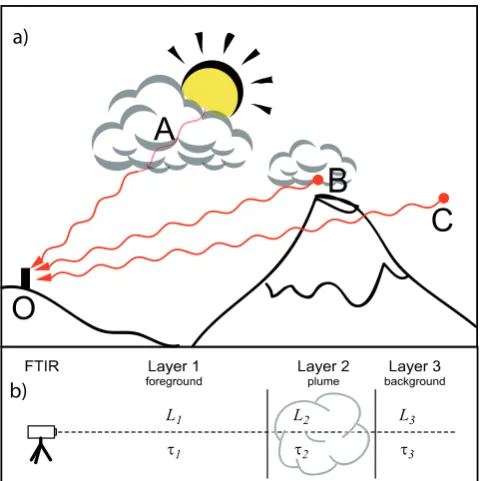
Fig. 1. (a) Different measurement geometries in the infrared using (A) solar/lunar absorption spectroscopy, (B,
C) thermal emission spectroscopy at and beside the plume, respectively. SO2from Popocat´epetl can readily
be detected from thermal IR spectra and imaged by performing 2-D scans around the crater. A plume-sky
difference (C–B) was used to analyze the weak SiF4signal and cope with the strong interferences. (b) Sketch
of the three layers (background, plume and foreground) used in the forward model to simulate the spectra.
20
Fig. 1. (a) Different measurement geometries in the infrared
us-ing (A) solar/lunar absorption spectroscopy, (B, C) thermal
emis-sion spectroscopy at and beside the plume, respectively. SO2from
Popocat´epetl can readily be detected from thermal IR spectra and imaged by performing 2-D scans around the crater. A plume-sky
difference (C–B) was used to analyze the weak SiF4 signal and
cope with the strong interferences. (b) Sketch of the three layers (background, plume and foreground) used in the forward model to simulate the spectra.
without controlling the radiation source and can be further distinguished in (A) absorption spectroscopy, which uses the sun, moon or hot rocks as light source and (B) thermal emis-sion spectroscopy, using the radiation emitted by the target gas itself, which acts therefore as the light source. These geometries are depicted in the sketch provided in Fig. 1. While absorption spectroscopy needs the special condition that source, plume and sensor are in one line, thermal emis-sion spectroscopy only requires a free sight of the plume. However, for a quantitative analysis of the gases, an accu-rate radiometric calibration is needed and the temperature (T-profile) along the line-of sight of the background, plume and foreground should be known or well estimated. A measure-ment along the direction C shown in Fig. 1, which is at the same elevation but barely missing the plume up-wind, as will be shown in this work, can aid in the analysis significantly.
According to our knowledge thermal emission spec-troscopy to characterize volcanic emissions was applied for the first time in 1996 by Love et al. (1998, 2000) and Goff et al. (2001). From thermal emission spectroscopy, SO2, SiF4, H2O, CO2 (Goff et al., 2001) and even HCl (Love et al., 2000) have been determined in volcanic gas plumes. However, good H2O and CO2 results have proven to be
difficult to obtain because of their high atmospheric back-ground. SiF4 in volcanic gas was first detected by Francis et al. (1996) at Vulcano, which is a volcano on an Italian island, and the largest relative SiF4 content was found at Satsuma-Iwojima volcano, Japan (Mori et al., 2002). Love et al. (1998) suggested that the increasing SiF4content mea-sured in Popocat´epetl might be related with the Vulcanian-type eruptions measured then and the molecular ratio of SiF4 to SO2(SiF4/SO2) is thought to be an indicator of explosive activity (McGonigle, 2005). In a recent work, solar absorp-tion measurements of Popocat´epetl during an explosion and quiescent degassing showed a systematic difference in the HCl/SO2, HF/SO2and SiF4/HF molecular ratios (Stremme et al., 2011). It was suggested that SO2/HF ratios change and increase in explosions due to presence of gas originated from fresh magma from the depth, while SiF4/HF ratios can increase due to a cooling of the stored gas near the surface.
In this work we present measurements of the thermal volcanic-plume radiation with a fully automated Scanning Infrared Gas Imaging System (Harig et al., 2005) and new retrieval strategies which allow for simultaneous monitoring of SO2and SiF4. As the determined slant columns are cap-tured in two dimensional images, each scan or plume snap-shot produces an average molecular ratio (SiF4/SO2) with a statistical measure of its significance. This parameter can be used to monitor changes in gas composition day and night, and possibly used as surveillance for future eruptive events. As example the results from a explosive event on the night of 16 to 17 November 2008 are presented. The propagation velocity is calculated from the images and the emission rates of these gases can be determined (see Part 2).
2 Instrumentation
Fig. 2. (a) Schematics of the SIGIS construction with
correspond-ing components and (b) illustration of the instrument scanncorrespond-ing a 2-D image represented by the field of regard (red grid).
background are also produced. Simultaneous with the anal-ysis and visualization of one interferogram by the DSP and the PC, the scanning mirror is set to move to the next position where a new interferogram is recorded. After the measure-ment of the field of regard is completed, the column densi-ties of all directions in which a compound has been identi-fied may be calculated and an additional false-color image is displayed (Harig et al., 2005).
For quantitative analyses of slant column densities, a ra-diometric calibration is necessary (Revercomb et al., 1988). The calibration was realized with spectra recorded at two different temperatures taken from a temperature-controlled black-body. There is a trade-off when choosing the spectral resolution in order to obtain sufficient information about the target and interference gases with higher resolution and look-ing to improve the signal-to-noise ratio and speed in the data acquisition gained when using the smaller resolution (Harig, 2004). We present two different data sets using spectral res-olutions of 4 and 0.5 cm−1. Fast measurements with the lower resolution allow for two-dimensional scans (consisting of typically 35×20 spectra) to be produced within 2 min and still average 5 interferograms per recorded spectrum (pixel). With the higher spectral resolution, 20 interferograms need to be averaged so that full 2-D-scans would take too long to be completed and would not reflect a snapshot of the vol-canic plume. The higher resolution spectra are taken only in the spot-observation mode as described in Sect. 3.2.
The measurements presented in this work were done from the high-altitude Altzomoni site (19.12◦N, 98.65◦W, 4000 m a.s.l.) at a safe distance of 12 km from the crater.
3 Retrieval algorithms
3.1 Algorithm for the 4 cm−1resolution
Passive remote sensing of gas clouds is based on the analysis of infrared radiation absorbed and emitted by the molecules.
Figure 1b illustrates the measurement set-up of the method. The radiation measured by the spectrometer contains the spectral signatures of the background in the field of view, the gas cloud, and the atmosphere. The propagation of ra-diation through the atmosphere is described by the theory of radiative transfer, Eq. (1).
L1 = (1 −τ1) B1 +τ1[(1 −τ2) B2 +τ2L3]. (1)
In order to describe the basic characteristics of spectra mea-sured by a passive infrared spectrometer, a simple model with three layers is used (Fig. 1b). Radiation (L3) from the back-ground (Layer 3), for example the sky (or a surface), prop-agates through the volcanic plume (Layer 2) and the atmo-sphere between the plume and the spectrometer (Layer 1).
τ1,τ2andB1,B2describe the transmissions and the radiation due to thermal emissions (from Plank’s-function) in these layers, respectively. The layers 1 and 2 are assumed homo-geneous with regard to all physical and chemical properties within each layer. The radiation containing the signatures of all layers (L1) is measured by the spectrometer and the spec-tra are analyzed by the GeDetekt software developed for the SIGIS (Harig et al., 2009). The reference spectra with dif-ferent column densities along this path are calculated by the convolution of high resolution transmittance spectra calcu-lated by FASCODE (Smith et al., 1978) using the HITRAN spectral compilation and an instrumental line-shape function. The spectra measured by passive remote sensing spectrom-eters contain both absorption and emission signatures of the target gas. Baseline shifts in the spectrum that exceed the sig-nal of the target compound due to the radiance of the back-ground and emission inside the spectrometer are also con-sidered. The signatures of atmospheric trace gases, and in particular the signatures of ozone and water vapour, are of-ten greater than the signatures of the target gases. Therefore, the algorithm is optimized to identify and quantify the com-pounds where the mentioned interference gases and baseline shifts are less sensitive.
The analysis is realized by the approximation of a mea-sured spectrum with a linear combination of reference spec-tra, which have been converted to brightness-temperature
Tbr(ν)˜ (ν˜: frequency in wavenumbers). Tbr(ν)˜ is obtained by the inversion of Plank’s functionB(ν, T )˜ assuming that the thermal radiation is given by the measured intensity of the radiationL(ν)˜ , Eq. (2).
Tbr(ν)˜ =
h cν˜
k ln
"
2h c2ν˜3
L(ν)˜ +1
#!−1
. (2)
For the calculation of the slant-column densities, a plume temperature in the volcanic layer has to be estimated. For the analysis of spectra at 4 cm−1taken on 16/17 November 2008 the value 275 K was used and for those taken on 28 May 2009 a temperature of 280 K was chosen. Although an exact value of the plume temperature is not known, the visualization and determination of molecular ratios between SiF4and SO2are
quite insensitive to the plume temperature as described by Love et al. (2000) and shown in Sect. 5.1.
An example of the retrieval results of SO2 and SiF4 are shown in Fig. 3. The regions used for the analyses of SO2 and SiF4are 1050–1250 cm−1and 980–1080 cm−1, respec-tively. The strong SO2 ν1-band located around 1150 cm−1 can be clearly seen in the spectrum, while that of SiF4 is weak and slightly larger than the noise in this case. When the fitting parameters from the continuum and other interfer-ence gases are removed (blue trace), the SiF4signal can more easily be identified.
The presence of ash in volcanic plumes can affect the anal-ysis significantly preventing the possibility to quantify the column densities. The emission and absorption of the ash-particles act as a continuum in the spectra similar to that of a solid background like the cone of the volcano. In such cases an analysis using difference spectra (sky-plume) is not possible and a filter is introduced. The integrated intensity between 900 and 1000 cm−1 is used to exclude all spectra which are above an empirical intensity-threshold of the re-ceived IR-radiation. The scheme works also to exclude the pixels in which the volcano or clouds are in the field-of-view so that more representative slant columns of the target gases and a corresponding SiF4/SO2ratio can be obtained.
3.2 Algorithm for the 0.5 cm−1resolution
The instrument was designed for thermal emission spec-troscopy at different resolutions. For the 0.5 cm−1 resolu-tion, the system was set to measure in “spot” mode, which means that it will measure continuously in one direction or it can alternatively switch between two or more directions (pre-defined spots). A new code to retrieve slant columns from individual thermal emission spectra at this resolution was developed. Using a higher resolution has the disad-vantage of a lower S/N but it helps to separate absorption features of different gases better and might therefore lower systematic errors.
Just as for the lower resolution mode the atmosphere is divided also in 3 layers, each containing a number of rel-evant gases described by their partial columns and a mean temperature. The forward model thus is similar as the one described in Sect. 3.1., in Harig et al. (2009) and by Goff et al. (2001). The cross-sections are calculated in a prepro-cessing step using FASCODE with sufficient high resolution (no apodization) and on a fine grid. Depending on the width of the spectral window, a polynomial of orderN is used to simulate the black-body radiation from aerosol, ash particles or water drops in the atmosphere and the volcanic plume.
The assumption of a temperature in each layer is re-quired in the forward model. The vertical T-profile from the daily radiosonde launched in Mexico City and the US Stan-dard atmosphere were used for the background layer and
we estimated the temperature Tbg-layer with a weighted average using
Tbg-layer =
R
T (z) ρO3(z) B(T (z))dz
R
ρO3(z) B(T (z))dz
, (3)
whereB(T (z)) is the black-body radiation andρO3(z) the density of the main gas emitting in that region (for exam-ple ozone in the SiF4 retrievals). The foreground temper-ature is estimated from the instantaneous tempertemper-ature mea-sured at the observation site. The estimation of the temper-ature in the volcanic layer is discussed in Sect. 4. The for-ward model considers that the instrumental line-shape results from a physical triangular apodization with maximal optical path-difference (OPD) of 1.8 cm (Harig et al., 2005; Stremme et al., 2009).
The inversion is done using the optimal estimation ap-proach (Rodgers, 1976) and because the forward model is not linear, a Levenberg-Marquard damping mechanism is added. For each parameter, an a priori value and its co-variance has to be chosen. The choice of the number of parameters, a priori values and constraints is critical. The foreground, vol-canic and atmospheric background layers are assumed to be independent and a diagonal a priori covariance matrix was chosen. The Se-matrix describes the noise in the spectrum but according to the work of von Clarmann et al. (2001), a generalized Se-measurement-noise matrix enables the re-duction of errors introduced by not fitted of poorly known parameter in the forward model.
The spectral region of 1080–1205 cm−1was used for the SO2retrieval and the cross-section were calculated using the HITRAN 2004 database (Rothman et al., 2005). The follow-ing temperatures were assumed for the event on 17 Novem-ber 2008: 300 K (foreground), 280 K (volcanic layer) and 250 K (atmospheric background). A polynomial of order 4 was used to simulate the continuum of this broad spectral window and the gases SO2, O3, CO2, CH4, N2O and H2O are taken into account. SO2from urban origin is considered neg-ligible at this altitude and was only allowed to adapt freely in the volcanic layer, while CO2, CH4, N2O and H2O are fitted in the foreground layer.
A large source of error in the quantitative determination of the SO2slant-columns is the interference of water vapor. For the 0.5 cm−1 resolution the non-Voigt line-shape might be of minor importance, however, its strong variability and the presence of water in all three layers makes it difficult to sim-ulate. Even if one could determinate the foreground water-column using the humidity measured in situ, it would be dif-ficult to get rid of spectroscopic problems with the H2O in-terference, especially with the intense water lines. Therefore, the spectrum was deweighted systematically using the water cross-section as presented in Fig. 4 and which, as mentioned above, is similar like the use of a generalized Se-matrix (von Clarmann et al., 2001).
in br
igh
tness
Temper
a
tur
e [K
]
plume
-sk
y
in br
igh
tness
Temper
a
tur
e [K
]
plume
-sk
y
R
esidual in [K
]
R
esidual in [K
]
30
20
10
0
-10
-20
-30
Wavenumber [cm-1]
1250 1200
1150 1100
5
0
-5
-10
-15
Wavenumber [cm-1] 1060 1040 1020 1000 980 15
0
2.5
0.0
SO2 SiF4
a)
b)
Fig. 3. Spectral regions where SO2(a) and SiF4(b) are retrieved at 4 cm− 1
resolution. Lower plots: The
difference of a plume spectrum and a reference-sky spectrum are shown in black and the corresponding fits in
green. The same is plotted above for the spectra (blue) and fits (red) when all other fit parameters (continuum
radiation and interference gases) are removed. Above: the residuals of the fits for each retrieval window.
22
Fig. 3. Spectral regions where SO2(a) and SiF4(b) are retrieved at 4 cm−1resolution. Lower plots: The difference of a plume spectrum and a reference-sky spectrum are shown in black and the corresponding fits in green. The same is plotted above for the spectra (blue) and fits (red) when all other fit parameters (continuum radiation and interference gases) are removed. Above: the residuals of the fits for each retrieval window.
1050 1100 1150 1200 1250
Wavenumber (cm-1) 0
0.0002 0.0004 0.0006 0.0008
R
a
d
ia
n
c
e
(
W
m
-1
s
r
-1) 0 1
W
e
ig
h
ti
n
g
a
b
Fig. 4. Thermal emission spectrum (below) around the SO2ν1-band on 17 November 2008 at 17:45 LT. The black trace is the measured spectrum in the direction of (B) depicted in Fig. 1, and the red trace corresponds to
the fitted simulation. The H2O cross-section (above) is used for systematically deweighting the water lines in
the analysis.
23
Fig. 4. Thermal emission spectrum (below) around the SO2 ν1 -band on 17 November 2008 at 17:45 LT. The black trace is the mea-sured spectrum in the direction of (B) depicted in Fig. 1, and the red
trace corresponds to the fitted simulation. The H2O cross-section
(above) is used for systematically deweighting the water lines in the analysis.
1.0 cm−1resolution) from Hanst et al. (1996) which has also been used by Francis et al. (1996); Love et al. (1998); Mori et al. (2002). The same temperatures as for the SO2-retrieval were assumed for the three layers. In the chosen spectral
region, 1020–1040 cm−1, the gases SiF4, O3, CO2, CH4, N2O and H2O were forward simulated, but only SiF4, O3, CO2, H2O and a polynomial of order 2 were fitted. Figure 5 shows the measured and simulated spectra with dominant O3 structures, and a SiF4 signature that is only slightly larger than the residual. As we will see in the results, this signal is sufficiently large to follow the evolution of a SiF4which is strongly correlated to SO2.
4 Validation of SO2and SiF40.5 cm−1retrievals from lunar absorption measurements
The results of SO2and SiF4slant columns retrieved form lu-nar absorption spectra (spot A in Fig. 1) are shown in Fig. 6. The analysis of the data was performed as from solar absorp-tion spectra in Stremme et al. (2009). The measurements were taken on 17 November 2008 around 06:30 a.m. LST at when the moon had a zenith angle of 30◦and an illumination fraction of 76 %. The volcanic plume passed just above the observation site and it was possible to take absorption spec-tra for little less than an hour. As the thermal emission from the moon and that of the atmosphere including the volcanic plume have the same order of magnitude, background spectra just next to the moon were also recorded. These background spectra served rather to get slant columns in thermal emis-sion mode since the plume was just above the measurement site. Figure 7 shows that one of the lunar background mea-surements (a thermal emission spectrum) was recorded near the maximum of the slant columns retrieved from lunar ab-sorption. Therefore, it is possible to subtract an individual background obtained by linear interpolation from the ther-mal emission spectra recorded before and afterwards. Since
1020 1024 1028 1032 1036 1040 Wavenumber (cm-1)
0.0002 0.0003
R
a
d
ia
n
c
e
(
W
m
-1
s
r
-1)
-2x10⁻⁵ 0x100 2x10⁻⁵
R
e
si
d
u
a
l a
b
Fig. 5. Thermal emission spectrum (below) in the region used for analyzing SiF4. The black trace is the
measured spectrum in the position of B depicted in Fig. 1, and the red trace corresponds to the fitted simulation.
The fit residual (above) is shown in black together with a forward simulation of SiF4alone with the fitted result
of 4.5×10¹⁵molec cm−2.
24
Fig. 5. Thermal emission spectrum (below) in the region used for
analyzing SiF4. The black trace is the measured spectrum in the
position of B depicted in Fig. 1, and the red trace corresponds to the fitted simulation. The fit residual (above) is shown in black together
with a forward simulation of SiF4 alone with the fitted result of
4.5×10¹⁵molec cm−2.
Time (LST)
6:15 6:30 6:45 7:00 7:15
0x100 1x10¹⁸ 2x10¹⁸ 3x10¹⁸
S
O2
(
m
o
le
c
u
le
s
/c
m
2)
-2x10¹⁵ 0x100 2x10¹⁵ 4x10¹⁵ 6x10¹⁵
S
iF
4
(m
o
le
c
u
le
s
/c
m
2
)
Fig. 6. Time-series of the SiF4(red) and SO2(blue) slant columns retrieved from lunar absorption spectra taken on 17 November 2008. Time is given in local time.Fig. 6. Time-series of the SiF4(red) and SO2(blue) slant columns
retrieved from lunar absorption spectra taken on 17 November 2008. Time is given in local time.
this subtraction eliminates most artifacts in the spectra which occur also from self emission of the instrument (Schreiber et al., 1996), the emission of the instrument is not taken into account in the forward model.
The first assumption of a volcanic plume temperature of 272 K lead to a systematic lower SO2column retrieved from thermal emission spectra than the temperature independent retrieval results from lunar absorption spectra (the blue trian-gle in Fig. 7. is the lunar absorption value interpolated to the
Time (LST)
6:15 6:30 6:45 7:00 7:15
0x100
1x10¹⁸
2x10¹⁸
3x10¹⁸
S
O2
(
m
o
le
c
u
le
s
/c
m
2)
Fig. 7. Slant columns of SO2retrieved from lunar absorption spectra (blue) plotted together with SO2from thermal emission spectra at 0.5 cm−1
(green). The diamonds are results when a plume temperature is assumed to be 272 K and the crosses are after fitting the SO2columns to the lunar absorption value, giving a plume temperature of 266 K.
26
Fig. 7. Slant columns of SO2retrieved from lunar absorption
spec-tra (blue) plotted together with SO2from thermal emission spectra
at 0.5 cm−1(green). The diamonds are results when a plume
tem-perature is assumed to be 272 K and the crosses are after fitting the
SO2columns to the lunar absorption value, giving a plume
temper-ature of 266 K.
time of the thermal emission measurement). The results of the sensitivity study in Fig. 9 shows a temperature of 266 K, for which both SO2-slant columns are consistent. That is in-dicated by the green crosses (thermal emission) and blue tri-angle (interpolated lunar measurements) in Fig. 7. The plume temperature is a parameter which can be obtained from the comparison of both methods. The radiosonde at 17 Novem-ber 2008, 06:00 a.m. L.T. at Mexico City registered a temper-ature of 265 K at 5000 m a.s.l., which was the approx. plume height. This result suggests that the volcanic plume seems to adapt rather fast to the temperature of the environment.
5 Errors and diagnostics
Random errors of the retrieved columns can be estimated from the scattering of the results (Figs. 8, 11 and 12). In the calculation of ratios, the random error obtained from the 95% confidence intervals is small if enough spectra are recorded. This error is used for all molecular ratios (SiF4/SO2) reported in this work and shown as vertical bars in Figs. 9 and 13. However, various parameters in the forward model affect the results systematically and have to be discussed to evaluate the results and to improve future measurements.
5.1 Sensitivity to plume temperatures
SiF
4
(molec./cm
2)
4x10¹⁵
3x10¹⁵
2x10¹⁵
1x10¹⁵
1x10¹⁸ 2x10¹⁸ 3x10¹⁸
0
SO2 (molec./cm2)
0
Fig. 8. Slant columns of SiF4retrieved from lunar absorption
spec-tra (black) plotted together with SiF4from thermal emission spectra
at 0.5 cm−1(red) against the corresponding SO2columns.
Temper-ature of the plume is estimated to be 266 K (see, Fig. 7 and text). The molecule ratios are calculated from the linear fit and its error is indicated by the 95 % confidence interval.
250 270 290 310 330 350
Temperature ( K ) 0x100
1x10¹⁸
2x10¹⁸
3x10¹⁸
4x10¹⁸
S
O2
(
m
o
le
c
./
c
m
2)
0 0.0005 0.001 0.0015 0.002 0.0025
m
o
le
c
. r
a
tio
s
S
iF
4/S
O
2
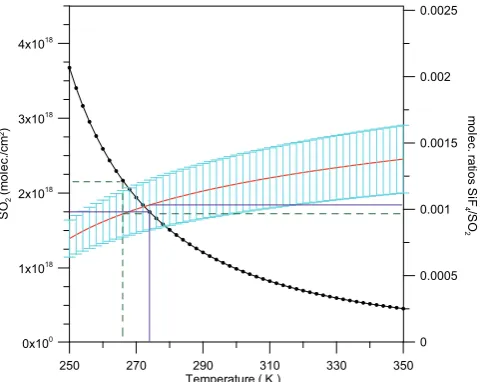
Fig. 9. Sensitivity of the retrieved SO2column to the estimated plume temperature (black points). The red line shows the resulting SiF4/SO2molecular ratios as a function of chosen plume temperature. The ratios and its error are obtained from the slope of the linear fits of six thermal emission spectra taken at 0.5 cm−1resolution
near the moon and between the lunar measurements (see. Figures 7 and 8)
28
Fig. 9. Sensitivity of the retrieved SO2column to the estimated plume temperature (black points). The red line shows the resulting
SiF4/SO2molecular ratios as a function of chosen plume
temper-ature. The ratios and its error are obtained from the slope of the
linear fits of six thermal emission spectra taken at 0.5 cm−1
res-olution near the moon and between the lunar measurements (see, Figs. 7 and 8)
directly. Love et al. (2000) limited their analysis by us-ing molecular ratios of the volcanic gases and not the ab-solute slant column amounts, which would be needed for estimating the flux. They mentioned that from their
analy-Fig. 10. A typical SO2plume from Popocat´epetl volcano measured from the Altzomoni site on 17 March 2006. The slant column densities can be obtained with the on-line evaluation software after proper radiometric cali-bration and plume temperature estimation. The SO2amount of a single puff in the white rectangle corresponed to an estmated mass of (4±1)t.
29
Fig. 10. A typical SO2 plume from Popocat´epetl volcano mea-sured from the Altzomoni site on 17 March 2006. The slant column densities can be obtained with the on-line evaluation software after proper radiometric calibration and plume temperature estimation.
The SO2amount of a single puff in the white rectangle corresponed
to an estmated mass of (4±1)t.
sis, the SiF4/SO2 ratio changes by less than 5 % if a 20 K higher volcanic plume temperature is assumed. This is confirmed from a sensitivity study performed from our re-sults (see Fig. 9). Here it can be seen that although the changes in the retrieved slant columns can be rather large, the temperature dependence of the molecular ratio does not significantly change.
SO2and SiF4were analysed for this sensitivity study as-suming different plume temperatures from a set of six ther-mal emission spectra of the volcanic plume taken some dis-tance down-wind from the crater, close to the direction of the moon (spot A in Fig. 1). As the moon-absorption mea-surements (see Sect. 4) were performed at the same time and elevation angle, the volcanic-plume temperature could be es-timated using the results from the sensitivity study and the moon-absorption quite accurately. This strategy is similar to using simultaneous COSPEC-measurements as described by Love et al. (2000), who used the SO2slant column from an independent technique for “calibrating” the thermal emis-sion result. Other possibilities for estimating the temperature could be from strong saturated water lines or from the alti-tude of the volcanic-plume together with the assumption that it adopts the temperature of the environment at that altitude.
5.2 Plume inhomogeneity
The error discussed above considers the temperature of the plume to be homogeneous. However, the plume is inho-mogeneous and dispersed over a wide area. The center in the field-of-view might not match the center of mass of the plume, and might change during the measurement. The
0
SO (molec./cm2)
1018 1018
1018 1018
0 4
SO (molec
./c
m
2 )
0 6 x10¹⁸
7 x10¹⁵
0
SO
SiF 2
SiF (molec
./c
m
2 )
4
x x
10 2 4 6
15
x 1015 x
1015 x
x x
2 2
4
Fig. 11. Left panel: on-line analysis of the SO2and SiF4plumes displaying the retrieved slant columns in
false-colored images. Difference spectra were calculated using the outermost left pixel as background and
a temperature of 280 K was assumed for the evaluation. The sum of the slant columns within this window
corresponds to 12 t of SO2and 24 kg of SiF4. Right panel: correlation between the column-densities of both
gases in the scanned window resulting in a SiF4/SO2ratio of (1.80±0.034)×10− 3
.
30
Fig. 11. Left panel: on-line analysis of the SO2and SiF4plumes displaying the retrieved slant columns in false-colored images. Difference spectra were calculated using the outermost left pixel as background and a temperature of 280 K was assumed for the evaluation. The sum of
the slant columns within this window corresponds to 12 t of SO2and 24 kg of SiF4. Right panel: correlation between the column-densities
of both gases in the scanned window resulting in a SiF4/SO2ratio of (1.80±0.034)×10−3.
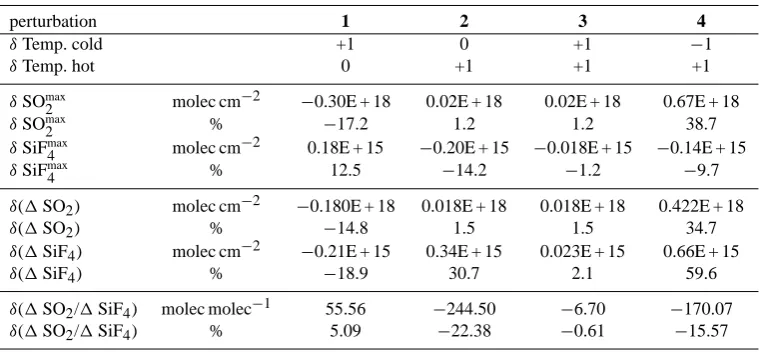
Table 1. Sensitivity to calibration: study with lunar-background measurements assuming a temperature of 273 K of the volcanic plume. The
calibration temperatures were 284.45 and 292.55 K.
perturbation 1 2 3 4
δTemp. cold +1 0 +1 −1
δTemp. hot 0 +1 +1 +1
δSOmax
2 molec cm
−2 −0.30E + 18 0.02E + 18 0.02E + 18 0.67E + 18
δSOmax
2 % −17.2 1.2 1.2 38.7
δSiFmax
4 molec cm
−2 0.18E + 15 −0.20E + 15 −0.018E + 15 −0.14E + 15
δSiFmax
4 % 12.5 −14.2 −1.2 −9.7
δ(1SO2) molec cm−2 −0.180E + 18 0.018E + 18 0.018E + 18 0.422E + 18
δ(1SO2) % −14.8 1.5 1.5 34.7
δ(1SiF4) molec cm−2 −0.21E + 15 0.34E + 15 0.023E + 15 0.66E + 15
δ(1SiF4) % −18.9 30.7 2.1 59.6
δ(1SO2/1SiF4) molec molec−1 55.56 −244.50 −6.70 −170.07
δ(1SO2/1SiF4) % 5.09 −22.38 −0.61 −15.57
average temperature of a plume can be estimated from a range of altitudes covering the plume dispersing down wind. Even if the average plume temperature is well estimated, the temperature variations within the plume may cause un-certainties. The typical field-of-view presents a plume with a vertical thickness of around 2 km. If a lapse rate of 6.5 K km−1 is assumed the temperature difference between the lower and upper part and from the center of the plume would be±6.5 K. According to Fig. 9, this temperature dif-ference would lead to an error of 16 % in the slant column of SO2. However, the error in the molecular ratios would be smaller than 5 %.
5.3 Radiometric calibration
Fig. 12. Visualization of the (a) SO2and (b) SiF4slant columns retrieved at different times during the night of 16 to 17 November 2008
(colorbar for SiF4and SO2is the same as in Fig. 11). The integrated intensity around 900–1000 cm−1is shown in (c) with colors in arbitray
units. The linear fits from the plots in (d) are calculated only from pixels with lower intensities – those with color in (c). A wind direction change is evident from the last row and one reference spectrum as clear sky was used for all the analysis (see video S.2 in the Supplement).
as in the previous study. The instrument was installed inside a building for the latter campaign looking for more stable temperatures and thus the conditions were better.
The error introduced by the calibration is evaluated assum-ing uncertainties in both the upper and lower temperatures of the black-body measurements. Both temperature errors could have the same or opposite signs. If we assume an error of 1 K, the effect in the slant columns and ratios can be calculated. The radiometric calibration also affects the slant columns retrieved from a clear-sky spectrum. Table 1 shows how the absolute slant-columns, the1slant-columns (plume-sky) and the calculated ratio between the1SiF4and SO2are affected. The error resulting from 1 K uncertainty in the temperatures of the black-bodies could lead to a 20 % error in the SO2/SiF4ratios.
The different errors shown in Table 1 are important if the method is applied to determine (i) the absolute values of the slant column densities finally used for emission estimation or (ii) the differences in the slant columns (sky-plume) are retrieved to calculate molecular ratios. As there are differ-ent fitting parameters (continuum and interference gases) in-volved and the forward model is not linear, the error intro-duced through uncertainties in the calibration does not be-have equally for all target gases. The table shows that molec-ular ratios could be affected by as much of 22 %, while a wrong calibration (1 K) might affect the column density by up to 60 % for SiF4and up to 35 % for SO2.
06:00 05:00 04:00 03:00 02:00 23:00
0.001
0.000
19:00 18:00
SiF /SO molecular
ra
ti
o
4
2
Time (LT)
In
tensit
y (800-900 c
m
-1)
A
zimuth 16
4º El
ev
a
tion
7
º
(a. units
)
(a)
(b)
1:06 L
T
ERUPTION
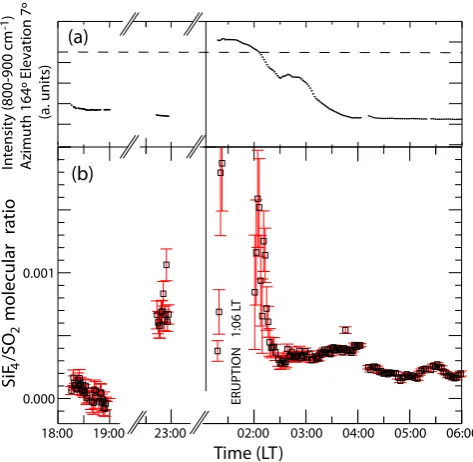
Fig. 13. Time-series of (a) the integrated radiation collected from above the crater and (b) the SiF4/SO2 molec-ular ratio (squares) before and after the eruptive event that took place between 01:06 and 01:45 LT of 17
Novem-ber 2008. The dashed line indicates the threshold chosen to filter-out data for calculating molecular ratios.
32
Fig. 13. Time-series of (a) the integrated radiation collected from
above the crater and (b) the SiF4/SO2molecular ratio (squares)
be-fore and after the eruptive event that took place between 01:06 and 01:45 LT of 17 November 2008. The dashed line indicates the threshold chosen to filter-out data for calculating molecular ratios.
5.4 Interference parameters
The a priori partial slant columns and a priori values used for the interference parameters are empirically adjusted. Errors in the interference gases or fitted parameters can therefore be large sources of error in the retrievals. The error analysis in optimal estimation is described by Rodgers (1990), Bowman et al. (2006) and Sussmann and Borsdorff (2007). An impor-tant tool in the error analysis is the Averaging-Kernel matrix which describes how a change in one parameterxtruej affects the result related to another parameterxreti . For the param-eters which are retrieved with constraint, we define their av-erage impact AIparamj on the target gas, for example for the SO2slant column, as:
AISO2j =ASO2j ·AVG(xretj −a priori) (4) The variance in the impact SIparamj is given by:
SISO2
j =A
SO2
J ·STDEV(x j
ret) (5)
Both quantities AISO2
j and SI
SO2
j help in the optimization
process as they give insight in how the target gas reacts if the a priori value or the constraint of a certain parameter is changed. The retrieval of the target gas can be optimized effi-ciently by adjusting the interference parameters, a priori and constraint, so that the average of the volcanic gases in the clear-sky spectra (spot C in Fig. 1) is effectively zero, while
the target gases are almost unconstrained in the volcanic layer. The variance of the partly constrained interference pa-rameters characterizes the retrieval as well. Both quantities AISO2
j and SI
SO2
j help in the optimization process and could
indicate if something in the forward model is not well fitted or missing. The errors due to interference parameters can be minimized but not quantified in this way.
5.5 Uncertainty in the geometry
The measurements are taken from a rather large distance re-sulting in small scanning angles (maximal range was around 15◦). This allows for geometrical approximations to be done and the slant columns can be thought of having constant sep-arations at the plume distance. Also, the uncertainty in the observer-plume distance depends on both the direction and dispersion of the plume. Larger distances have proportion-ally smaller errors. To estimate the uncertainty rising from this distance, the evaluation is restrained to favourable con-ditions, in which the plume seems to propagate perpendic-ular to the viewing direction. Even in these selected cases the plume at some distance from the crater might have a displacement of half this distance towards or away from the measurement site. Typically the center of the recorded plume is around 2 to 3 km east or west of the crater, so that the distance to the center of the plume might be 11.5±1.5 km. This represents a typical error of 13 % in the distance to the plume (r), leading to an error of 28 % in the integrated area (A=1φ·1θ·r2), whereφandθcorrespond to the azimuth and elevation angles. This error is irrelevant for slant col-umn and molecular ratios, but it might be the major error source when determining the total amount and flux of a gas (see Part 2 of this paper). The total error for the mass cal-culation of a visualized puff of gas has an estimated value of≈32 %, which results from the slant column uncertainty (≈16 %) and the geometrical error (≈28 %) described here.
6 Results and discussion
17:15 17:30 17:45 18:00 2x10¹⁸
4x10¹⁸
6x10¹⁸
S
O
2
(m
o
le
cu
le
s/
c
m
2
)
2x10¹⁵
4x10¹⁵
6x10¹⁵
S
iF4
(
m
o
le
cu
le
s/
c
m
2)
Time (LT)
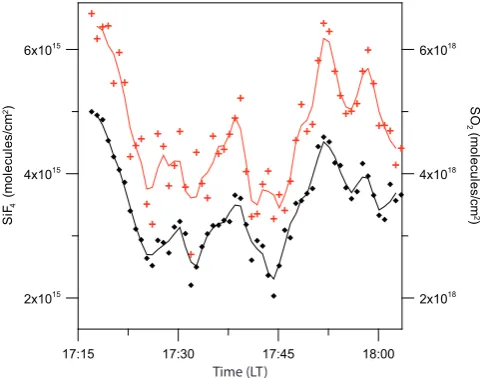
Fig. 14. Time series of the SO2(black diamonds) and SiF4(red crosses) slant columns obtained from thermal
emission spectra recorded at 0.5 cm−1resolution on 17 November 2008.
33
Fig. 14. Time series of the SO2(black diamonds) and SiF4(red crosses) slant columns obtained from thermal emission spectra
recorded at 0.5 cm−1resolution on 17 November 2008.
Volcanic SiF4 slant columns were analysed from differ-ence spectra at 4 cm−1. At favorable conditions like on 28 May 2009, one 2-D scan which lasted around 1.5 min contains enough information to calculate the molecular ra-tio with a statistical error below 5 % (95 % confidence in-terval). The results of this scan are presented in Fig. 11. The SiF4/SO2 molecular ratio in this particular example is (1.18±0.03)×10−3 and the corresponding SO2 and SiF4 amounts within the measured window are (12±4) t and (24±8) kg, respectively. It is important to note that the near-horizontal viewing arrangement produces a strong interfer-ence with ozone and continuum radiation affecting the re-trieved slant columns as well as the resulting absolute value of the molecular ratios. The presence of ash and clouds pro-duce additional uncertainties and the reported ratios should therefore be treated carefully. However, it will be shown next that the relative changes in the measured ratios can be important parameters when related to the volcanic activity.
During the night 16/17 November 2008, an explosion oc-curred around 01:06 a.m. LST and large amounts of SO2and ash were emitted. The SiF4 retrieval was performed from the difference spectra and still very close to the detection limit (see Sect. 3.1). To improve the signal-to-noise ratio in this event, the retrieved slant column densities of the near-est neighbors were averaged vertically and horizontally by a running average of 4. The results of a sequence are presented in Fig. 12. White areas where the integrated intensity are large (see Sect. 3.1) are filtered out clearly showing the pres-ence of the ash-plume and the contour of the volcano in the third row, a few minutes after the explosion (01:18 a.m. LST). The corresponding animation of this sequence is presented as Supplement S.2.
0.0x100
2.0x10¹⁸
4.0x10¹⁸
6.0x10¹⁸ 0.0x100
2.0x10¹⁵ 4.0x10¹⁵ 6.0x10¹⁵
S
iF4
(m
o
le
cu
le
s/
cm
2)
SO2(molecules/cm2)
Fig. 15. SiF4/SO2correlation plot from data in Fig. 10 including both plume and clear-sky spectra (
slope = (1.4±0.07)×10−3.)
34
Fig. 15. SiF4/SO2correlation plot from data in Fig. 10 including
both plume and clear-sky spectra. Slope = (1.4±0.07)×10−3.
A difference between the spatial distributions of SiF4and SO2would be interesting to analyze, as recent measurements at Fuego Volcano in Guatemala by Nadeau et al. (2011) with a UV-imaging system found SO2 emitted through different vents. It is possible that just after the explosion, as seen in the third row of this sequence, the maximum of SiF4is prop-agated earlier towards the right border than SO2. Although a single snapshot does not provide sufficient arguments for making conclusions, it can be seen from the simultaneous plume animations that this instrument is capable of identify-ing differences in the spatial distribution of the gases (see S.2 in the Supplement).
In Fig. 13, the time series of both the integrated IR ra-diation collected just above the crater and the calculated SiF4/SO2 molecular ratios is presented. The time series of the integrated intensity (Fig. 13a) indicates the time and du-ration of the explosion. Only the values below the threshold, represented by the dashed line, were considered for calculat-ing the gas ratios. One reference spectrum and one radiomet-ric calibration, with a plume temperature assumed at 275 K, were used in the evaluation. These assumptions introduce uncertainties and therefore not the absolute but rather the rel-ative behavior is interesting to observe. There is a clear in-crease in the SiF4/SO2ratio not only after the eruption, but also a couple of hours before. The ratio then returns to low values several hours after the explosion.
Table 2. Results of the SiF4/SO2ratios obtained from different measurement strategies.
Event Mode Resol. (cm−1) SiF4/SO2×10−3 R2 N
17 November 2008 early morning thermal emission image 4 0.39±0.02 – 1 frame
17 November 2008 early morning lunar absorption 0.5 1.68±0.02 0.67 57
17 November 2008 early morning thermal emission spot 0.5 0.90±0.45 0.66 6
17 November 2008 morning solar absorptionν1+ν3 0.5 2.56±0.30 0.65 213
17 November 2008 morning solar absorptionν1 0.5 2.54±0.26 0.66 156
17 November 2008 afternoon thermal emission spot 0.5 1.40±0.07 0.96 114
28 March 2009 early morning thermal emission image 4 1.18±0.03 0.80 828
28 March 2009 early morning thermal emission spot 0.5 1.50±0.18 0.69 110
A general behavior is deduced from the interpretation of Figs. 12 and 13. There is a low emission of gases several hours prior to the explosion. The SiF4/SO2 ratio starts to increase 2–3 h before, rises excessively during and just af-ter the event and then drops to low values a few hours laaf-ter. The emissions of both SO2and SiF4, however, remain strong throughout the next day probably through open-venting.
Slant columns of SO2 and SiF4 at 0.5 cm−1 were also recorded on 17 November 2008 (spot B in Fig. 1) during al-most 1 h and are plotted in Fig. 14. The spectra were recorded
∼16 h after the explosion with optimal conditions for mea-suring with thermal emission spectroscopy. A large variabil-ity observed in the retrieved slant columns is consistent with the puffs observed by Grutter et al. (2008). The SiF4 and SO2 columns are, however, changing synchronously. The Pearson’s correlation of both columns including those from the clear sky (spot C in Fig. 1) results in a coefficient R2
of 0.96 and a molecular ratio SiF4/SO2of 0.00140±0.00007 (Fig. 15). Errors are calculated with the 95 % confidence interval, assuming that the ratio is constant and errors in the SiF4 retrieval are dominant. During the measurement period no significant change in the SiF4/SO2 ratio could be observed.
The results from various measurement periods, however, shows a significant variation in the SiF4/SO2molecular ratios during quiescent degassing of Popocat´epetl, Table 2. Not all measurements are equally reliable, as the geometry, meteoro-logical conditions and calibration conditions might have dif-fered. Table 2 differentiates between thermal emission mea-surements made in image mode, as shown in Figs. 11 and 12, and the spot mode as presented in Figs. 14 and 15. On the morning of 17 November 2008, a few spectra with volcanic gas were recorded near the moon when the measurement site was almost directly below the gas cloud. On 28 May 2009, measurements were recorded before sunrise using the scan-ning infrared system pointing above the crater while the in-strument was located in the hut under more stable conditions. The comparison of the molecular ratios presented in Ta-ble 2 between lunar absorption and thermal emission shows a difference of 0.00078±0.0005. These measurements were
taken at the same time and the plume-temperature was ad-justed according to the description presented in Sect. 4. As the systematic difference is only slightly larger than their un-certainty, the errors are estimated with the 95 % confidence interval, however, the dataset is based on only 6 measure-ments and in fact one plume measurement and 5 background measurements. As the interference gases and parameters play an important role in the SiF4retrievals, a greater set of measured spectra would be helpful. As the slant columns of SO2are consistent using the temperature of the environment at 5000 m a.s.l., we assume that there is a small systematic error in the retrieval of SiF4. However, not sufficient evi-dence is available to infer which of both retrievals (thermal emission or absorption) remains slightly biased.
7 Conclusions
This work describes how a fully automatized scanning FTIR emission spectrometer can be used for plume visualization of volcanic gases, as well as continuous monitoring of emis-sion ratios at favorable conditions. The instrument opera-tion for thermal emission spectroscopy and the retrieval al-gorithms are described. The instrument can also be deployed to monitor other atmospheric relevant sources and in the case of continuous operation for volcanic surveillance, its autom-atized capability presents many benefits and opportunities allowing for:
– the detection of large column densities and molecular
ratios of specific gases even during the night (with the possibility to warn with an alarm algorithm during an eruptive event),
– a visual representation of the individual volcanic gas
plumes (with a large statistical significance from the increased data collection in various atmospheric and volcanic conditions),
– the identification of opportunities for taking solar or
– a detailed reanalysis of special events using individual
optimized and adapted retrieval strategies.
The visualization of the SO2plume and its animation from longer sequences is presented (see the Supplement). The SiF4 gas relevant for volcanic activity was simultaneously analyzed from the lower resolution spectra and it was possi-ble to visualize its plume for the first time. SiF4/SO2 molec-ular ratios could be monitored from the sequential 2-D im-ages at 4 cm−1with detected enhancements before and after an eruptive event. Alternatively, the 0.5 cm−1 spectral res-olution set in spot-observation mode just above the crater allowed for more information about the individual interfer-ences to be acquired and an error estimation to be performed. Down-wind plumes can be quantified such as in the false-color images of 28 May 2009 (Fig. 6), where the total SiF4 and SO2contents were found to be (24±8) kg and (12±4) t, respectively, the latter being equivalent to the average SO2 emission of Popocat´epetl in 7 min. On 17 November 2008, there was an opportunity to measure the volcanic plume both by thermal emission and lunar absorption at the same time. The plume temperature for the thermal emission retrieval was adapted to match the slant columns of the lunar absorption result. The resulting temperature came out to be that of the environment at that particular altitude.
The large distance of 12 km to the crater and the near-horizontal field-of-view used in this study has some advan-tages, as the plume moved relatively slow and there was a possibility to monitor plumes in different altitudes and direc-tions with almost the same elevation angle. However, that the atmospheric interference gases have large slant columns is a disadvantage. Therefore, the spectral signature of gases with smaller abundances, such as SiF4, have small S/N ratios and can only be analyzed from difference-spectra.
The time series of SiF4/SO2ratios, registered for the night of 16/17 November 2008, revealed a significant increase in SiF4 before and during a Vulcanian-type eruption. The SiF4/SO2 ratio alone, however, might not be a reliable in-dicator for explosions and dome cooling, as both the S/F atomic ratio and the SiF4/HF ratio are variable in the vol-canic gas. An improvement of the spectrometer using for example a larger telescope together with a broader-range de-tector (MCT/InSb sandwich dede-tector with bandpass-filters) would allow to simultaneously measure HCl at 2800 cm−1 (Love et al., 2000; Gross et al., 2010). Multi-element de-tectors in the near future could also improve the acquisition speed and avoid the need of a scanning mirror. Also, as has been mentioned, the possibility of long-term monitoring with this technique would allow for gaining better emission statis-tics, which together with other parameters, wind conditions and seismic data, could provide new insights in the behavior of volcanic emission and activity.
Supplementary material related to this article is available online at:
http://www.atmos-meas-tech.net/5/275/2012/ amt-5-275-2012-supplement.zip.
Acknowledgement. We thank Claus Siebe from the Dept. of
Vulcanology, Geophysics Inst.-UNAM for important discussions, Ivan Ortega for helping with the measurements, Alfredo Rodriguez form the workshop for technical support. We are also greatfull with CONANP (the Izta-Popo National Park authorities) for hosting and supporting the field campaigns. DGAPA-UNAM (IN119310) is acknowledged for partial funding of this work. The referees are thanked for their comments which improved the quality of the manuscript
Edited by: J. Notholt
References
Aiuppa, A.: Degassing of halogens from basaltic volcanism: In-sights from volcanic gas observations, Chem. Geol., 263, 99– 109, doi:10.1016/j.chemgeo.2008.08.022, 2009.
Bowman, K. W., Rodgers, C. D., Kulawik, S. S., Worden, J., Sarkissian, E., Osterman, G., Steck, T., Lou, M., Eldering, A., Shephard, M., Worden, H., Lampel, M., Clough, S., Brown, P., Rinsland, C., Gunson, M., and Beer, R.: Tropospheric Emis-sion Spectrometer: Retrieval Method and Error Analysis, IEEE Transactions on Geoscience and Remote Sensing, 44, 1297– 1307, doi10.1109/TGRS.2006.871234, 2006.
Burton, M. R., Oppenheimer, C., Horrocks, L. A., and Francis, P. W.: Diurnal changes in volcanic plume chemistry observed by lunar and solar occultation spectroscopy, Geophys. Res. Lett., 28, 843–846, doi:10.1029/2000GL008499, 2001.
Clarisse, L., Coheur, P. F., Prata, A. J., Hurtmans, D., Razavi, A., Phulpin, T., Hadji-Lazaro, J., and Clerbaux, C.: Tracking
and quantifying volcanic SO2 with IASI, the September 2007
eruption at Jebel at Tair, Atmos. Chem. Phys., 8, 7723–7734, doi:10.5194/acp-8-7723-2008, 2008.
Duffell, H., Oppenheimer, C., and Burton, M.: Volcanic gas emis-sion rates measured by solar occultation spectroscopy, Geophys. Res. Lett., 28, 3131–3134, doi:10.1029/2000GL012425, 2001. Francis, P., Chaffin, C., Maciejewski, A., and Oppenheimer, C.:
Remote determination of SiF4 in volcanic plumes: A new
tool for volcano monitoring, Geophys. Res. Lett., 23, 249–252, doi:10.1029/96GL00022, 1996.
Francis, P., Burton, M. R., and Oppenheimer, C.: Remote measure-ments of volcanic gas compositions by solar occultation spec-troscopy, Nature, 396, 567–570, doi:10.1038/25115, 1998. Goff, F., Love, S. P., Warren, R. G., Counce, D., Obenholzner,
J., Siebe, C., and Schmidt, S. C.: Passive infrared remote
sensing evidence for large, intermittent CO2 emissions at
Popocat´epetl volcano, Mexico, Chem. Geol., 177, 133–156, doi:10.1016/S0009-2541(00)00387-9, 2001.
Gross, K. C., Bradley, K. C., and Perram, G. P.: Remote Identifica-tion and QuantificaIdentifica-tion of Industrial Smokestack Effluents via Imaging Fourier-Transform Spectroscopy, Environ. Sci. Tech-nol., 44, 9390–9397, doi:10.1021/es101823z, 2010.
Grutter, M., Basaldud, R., Rivera, C., Harig, R., Junkerman, W.,
Caetano, E., and Delgado-Granados, H.: SO2 emissions from
Popocat´epetl volcano: emission rates and plume imaging us-ing optical remote sensus-ing techniques, Atmos. Chem. Phys., 8, 6655–6663, doi:10.5194/acp-8-6655-2008, 2008.
Halmer, M.: The annual volcanic gas input into the
atmo-sphere, in particular into the stratosphere: a global data set for the past 100 years, J. Volcanol. Geoth. Res., 115, 511–528, doi:10.1016/S0377-0273(01)00318-3, 2002.
Hanst, P., Hanst, S., and Williams, G.: Infrared Spectra for Quan-titative Analysis of Gases, QASoftDatabase, Infrared Analysis, Inc., Anaheim, CA, 1996.
Harig, R.: Passive Remote Sensing of Pollutant Clouds by Fourier-Transform Infrared Spectrometry: Signal-to-Noise Ratio as a Function of Spectral Resolution, Appl. Opt., 43, 4603–4610, doi:10.1364/AO.43.004603, 2004.
Harig, R., Rusch, P., Dyer, C., Jones, A., Moseley, R., and Truscott, B.: Remote measurement of highly toxic vapors by scanning imaging Fourier-transform spectrometry, in: Society of Photo-Optical Instrumentation Engineers (SPIE) Conference Series, edited by: Jensen, J. O. and Th´eriault, J.-M., vol. 5995 of Society of Photo-Optical Instrumentation Engineers (SPIE) Conference Series, 316–327, doi:10.1117/12.631730, 2005.
Harig, R., Rusch, P., Peters, H., Gerhard, J., Braun, R., Sab-bah, S., and Beecken, J.: Field-portable imaging remote sens-ing system for automatic identification and imagsens-ing of haz-ardous gases, in: Society of Photo-Optical Instrumentation Engi-neers (SPIE) Conference Series, vol. 7475 of Society of Photo-Optical Instrumentation Engineers (SPIE) Conference Series, doi:10.1117/12.830627, 2009.
Love, S. P., Goff, F., Counce, D., Siebe, C., and Delgado, H.: Pas-sive infrared spectroscopy of the eruption plume at Popocat´epetl volcano, Mexico, Nature, 396, 563–567, doi:10.1038/25109, 1998.
Love, S. P., Goff, F., Schmidt, S. C., Counce, D., Pettit, D., Chris-tensen, B., and Siebe, C.: Passive infrared spectroscopic remote sensing of volcanic gases: ground-based studies at White Island and Ruapehu, New Zealand, and Popocat´epetl, Mexico, vol. 116 of Geophys. Monogr., Am. Geophys. Union, 117–138, 2000. McGonigle, A. J. S.: Volcano remote sensing with ground-based
spectroscopy, Philos T. Roy. Soc. Lond. A, 363, 2915–2929, doi:10.1098/rsta.2005.1668, 2005.
Mori, T., Notsu, K., Tohjima, Y., and Wakita, H.: Remote
detec-tion of HCl and SO2in volcanic gas from Unzen volcano, Japan,
Geophys. Res. Lett., 20, 1355–1358, doi:10.1029/93GL01065, 1993.
Mori, T., Sato, M., Shimoike, Y., and Notsu, K.: High SiF4/HF ratio
detected in Satsuma-Iwojima volcano’s plume by remote FT-IR observation, Earth Planets Space, 54, 249–256, 2002.
Nadeau, P. A., Palma, J. L., and Waite, G. P.: Linking volcanic
tremor, degassing, and eruption dynamics via SO2imaging,
Geo-phys. Res. Lett., 38, 1304–1308, doi:10.1029/2010GL045820, 2011.
Notsu, K., Mori, T. G. G. I., Tohjima, Y., and Wakita, H.: Infrared
spectral radiometer: a new tool for remote measurement of SO2
of volcanic gas, Geochem. J., 27, 361–366, 1993.
Revercomb, H. E., Smith, W. L., Buijs, H., Howell, H. B., and La-porte, D. D.: Radiometric calibration of IR Fourier transform spectrometers - Solution to a problem with the High-Resolution Interferometer Sounder, Appl. Opt., 27, 3210–3218, 1988. Rodgers, C. D.: Retrieval of Atmospheric Temperature and
Compo-sition From Remote Measurements of Thermal Radiation, Rev. Geophys. Space Ge., 14, 609–624, 1976.
Rodgers, C. D.: Characterization and error analysis of profiles re-trieved from remote sounding measurements, J. Geophys. Res., 95, 5587–5595, 1990.
Rothman, L. S., Jacquemart, D., Barbe, A., Chris Benner, D., Birk, M., Brown, L. R., Carleer, M. R., Chackerian, C., Chance, K., Coudert, L. H., Dana, V., Devi, V. M., Flaud, J.-M., Gamache, R. R., Goldman, A., Hartmann, J.-M., Jucks, K. W., Maki, A. G., Mandin, J.-Y., Massie, S. T., Orphal, J., Perrin, A., Rinsland, C. P., Smith, M. A. H., Tennyson, J., Tolchenov, R. N., Toth, R. A., Vander Auwera, J., Varanasi, P., and Wagner, G.: The HI-TRAN 2004 molecular spectroscopic database, J. Quant. Spec-trosc. Ra., 96, 139–204, , 2005.
Schreiber, J., Blumenstock, T., and Fischer, H.: Effects of the self-emission of an IR Fourier-transform spectrometer on measured absorption spectra, Appl. Opt., 35, 6203–6209, 1996.
Smith, H. J. P., Dube, D. J., Gardner, M. E., Clough, S. A., and Kneizys, F. X.: FASCODE: Fast Atmospheric Signature CODE (spectral transmittance and radiance), 1978.
Stremme, W., Ortega, I., and Grutter, M.: Using ground-based solar and lunar infrared spectroscopy to study the diurnal trend of car-bon monoxide in the Mexico City boundary layer, Atmos. Chem. Phys., 9, 8061–8078, doi:10.5194/acp-9-8061-2009, 2009. Stremme, W., Ortega, I., Siebe, C., and Grutter, M.: Gas
compo-sition of Popocat´epetl Volcano between 2007 and 2008: FTIR spectroscopic measurements of an explosive event and during quiescent degassing, Earth Planet. Sc. Lett., 301, 502–510, doi:10.1016/j.epsl.2010.11.032, 2011.
Sussmann, R. and Borsdorff, T.: Technical Note: Interference errors in infrared remote sounding of the atmosphere, Atmos. Chem. Phys., 7, 3537–3557, doi:10.5194/acp-7-3537-2007, 2007. von Clarmann, T., Grabowski, U., and Kiefer, M.: On the role of