www.the-cryosphere.net/8/1825/2014/ doi:10.5194/tc-8-1825-2014
© Author(s) 2014. CC Attribution 3.0 License.
Influence of stress, temperature and crystal morphology on
isothermal densification and specific surface area decrease
of new snow
S. Schleef, H. Löwe, and M. Schneebeli
WSL Institute for Snow and Avalanche Research SLF, Davos, Switzerland Correspondence to: H. Löwe ([email protected])
Received: 10 February 2014 – Published in The Cryosphere Discuss.: 31 March 2014 Revised: 31 August 2014 – Accepted: 2 September 2014 – Published: 9 October 2014
Abstract. Laboratory-based, experimental data for the mi-crostructural evolution of new snow are scarce, though ap-plications would benefit from a quantitative characterization of the main influences. To this end, we have analyzed the metamorphism and concurrent densification of new snow un-der isothermal conditions by means of X-ray microtomog-raphy and compiled a comprehensive data set of 45 time series. In contrast to previous measurements on isothermal metamorphism on time scales of weeks to months, we an-alyzed the initial 24–48 h of snow evolution at a high tem-poral resolution of 3 hours. The data set comprised natural and laboratory-grown snow, and experimental conditions in-cluded systematic variations of overburden stress, tempera-ture and crystal habit to address the main influences on spe-cific surface area (SSA) decrease rate and densification rate in a snowpack. For all conditions, we found a linear relation between density and SSA, indicating that metamorphism has an immediate influence for the densification of new snow. The slope of the linear relation, however, depends on the other parameters which were analyzed individually to derive a best-fit parameterization for the SSA decrease rate and den-sification rate. In the investigated parameter range, we found that the initial value of the SSA constituted the main morpho-logical influence on the SSA decrease rate. In turn, the SSA decrease rate constituted the main influence on the densifica-tion rate.
1 Introduction
The temporal evolution of new snow is delicate, since fast changes in bulk density or specific surface area (SSA) as
key microstructural characteristics occur within hours after snowfall. Various applications rely on a quantitative under-standing of these initial snowpack processes. For avalanche prediction, a fast or slowly densifying snowpack eventually discerns between conditions of high or low snowpack sta-bility. Initial modeling uncertainties of the densification will propagate and persist through the entire season (Steinkogler et al., 2009). The density of snow is also important for hydro-logical applications, where estimates of snow-water equiva-lent are commonly obtained from snow-height measurements of meteorological stations via empirical correlations between height and density. The development of these parameteri-zations is complicated by intermediate snow falls and short time densification (McCreight and Small, 2014). If the state of the snowpack is instead monitored via remote sensing, the key quantity is snow albedo, which is mainly determined via SSA (Flanner and Zender, 2006). Even thin layers of new snow have a measurable impact on the total snow albedo (Perovich, 2007). Finally, the validation of winter precipi-tation schemes for meteorological models also relies on the connection between airborne crystal sizes (which might be related to the inverse SSA) and the bulk densities of new snow (Thompson et al., 2008).
number. The choice of these microstructural parameters is motivated by the natural variation of snow-crystal habits, plus some metric of connectivity. These empirical parameters are, however, ambiguous and cannot be measured objectively for aggregated snow. Therefore recent versions of snowpack models have replaced the empirical parameters by objective ones which can be uniquely defined for arbitrary bicontin-uous structures. Of primary interest was the replacement of grain size by the SSA (or, more precisely, the optical radius) (Carmagnola et al., 2014) which is considered as the most important, morphological parameter of snow which can be measured in the field by various techniques.
Besides SSA, there is certainly a demand for higher-level morphological metrics to characterize snow microstructure. Various physical properties have been shown to be influenced by morphological characteristics beyond the SSA, e.g., ther-mal conductivity (Löwe et al., 2013) by anisotropy, the ex-tinction of light (Libois et al., 2013) by grain shape, the scat-tering of microwaves by correlation lengths (Wiesmann et al., 1998) or confined compression of new snow by the Euler characteristic (Schleef et al., 2014b). The Euler characteris-tic is a topological metric for the connectivity of the struc-ture (Michelsen et al., 2003). On the one hand, it might be regarded as a generalization of the grain-based concept of a coordination number (Lehning et al., 2002) to arbitrary three-dimensional microstructures. On the other hand, the Euler characteristic is also exactly related to the average Gaus-sian curvature. The Euler characteristic thus constitutes a link to structure characterization in terms of full distributions of interfacial curvatures as a high-level morphological metric. This has, for example, recently been used to reveal details of temperature-gradient metamorphism (Calonne et al., 2014). These recent advances in microstructural insight are indeed necessary and important, but none of these higher-level mor-phological metrics have been implemented in snow models yet, not to mention the difficulties of measuring them by methods other than micro-computed tomography (µCT). In the absence of advances to include or alternatively measure higher-level metrics, the density and the SSA must still be considered as the most important microstructural parameters for current snowpack models. A good representation of the time evolution of these parameters is a minimum requirement for these models. To reveal shortcomings of present models, there is a need to bridge the gap between laboratory-based techniques (e.g., µCT) and field techniques in order to fa-cilitate the validation of basic processes like metamorphism and densification under a wide range of environmental con-ditions.
From the perspective of laboratory experiments, some progress has recently been made in understanding the phys-ical mechanisms underlying new snow densification and metamorphism within creep experiments (Schleef and Löwe, 2013). The results indicate that the evolution of the SSA oc-curs autonomously without being affected by the concurrent densification. The experiments were carried out for a
gle type of new snow obtained from a snowmaker at a sin-gle temperature (Schleef et al., 2014a). However, this small range of experimental conditions is only of limited use for the aforementioned applications and the validation of mod-els. To cover a wide range of environmental conditions for snow types and temperatures, applications are interested in best-fit behavior of large data sets which are essential bench-marks to validate and drive snow-evolution models. From the perspective of field experiments, some data sets are available for well-aged seasonal snow (Domine et al., 2007) and data of experiments which include new snow in their first few days of evolution (Cabanes et al., 2002, 2003; Legagneux et al., 2003; Taillandier et al., 2007). However, comparable data from in situ experiments which monitor the evolution of the same sample of new snow at high temporal resolution are almost non-existent.
To fill this gap, we present a comprehensive data set of µCT experiments for new snow densification and metamor-phism covering various examples of natural and laboratory-grown new snow with a wide range of initial crystal mor-phologies. The primary goal of the present work is to pro-vide laboratory-based experimental data for validation pur-poses. Our aim is to bridge the gap between high-level labo-ratory experiments and the capabilities of field measurements by assessing whether densification and metamorphism under isothermal conditions can be described by the most impor-tant yet available parameters for snow models, namely the density, temperature, overburden stress and the SSA. We fo-cus on the SSA as the most important morphological met-ric for snow microstructure. To relate to the original idea of crystal classification, we include a qualitative characteriza-tion of our experiments in terms of crystal-habit classes. To make contact with recent high-level morphological metrics, we also analyze the Euler characteristic.
SSA and density, and based on previous modeling ideas, we derive simple parameterizations for the rate equation of SSA and density for new snow in terms of the most impor-tant yet available parameters, namelyφi, SSA, temperatureT and stressσ. Our parameterization for the SSA is compared to an existing parameterization (Taillandier et al., 2007) in Sect. 3.6. Finally, we discuss our results in Sect. 4.
2 Methods
For a self-contained presentation we summarize the main steps of the method and outline differences or extensions to Schleef and Löwe (2013); Schleef et al. (2014a, b).
All snow samples were prepared from fresh snow which was either collected outside or produced with a machine in the cold laboratory (Schleef et al., 2014a), referred to as “natural snow” and “snowmaker snow”, respectively. An overview of all sets of experiments with their main charac-teristics is given in Table 1. The natural snow was collected just outside the cold laboratory in Davos, Switzerland, during the winters of 2011/2012 and 2012/2013. To minimize pre-vious metamorphism, only intense snowfalls at air tempera-tures below−2◦C with a deposition time less than an hour were chosen. Immediately afterwards, the snow was sieved (mesh size 1 mm) into sample holders of an 18 mm diame-ter with a 15 mm filling height. In between, photographs of sieved snow crystals were taken to capture the crystal habit. Each set of snow samples comprised several identically pre-pared samples which were stored in a freezer at −60◦C. The storage conditions suppress metamorphism almost com-pletely prior to the experiments (Kaempfer and Schneebeli, 2007). In total, eight sets of snow samples from different nat-ural snow falls and six sets from different snowmaker runs were prepared (Table 1). In Schleef and Löwe (2013), the po-tential bias caused by different storage times was addressed. We found that no systematic change in the SSA and density during storage times of 3 weeks at−60◦C in the SSA range of around 70 mm−1could be measured by µCT. The storage influence observed for some samples (SSA:∼2 %, density:
∼5 %) is generally small compared to the observed evolution during the experiments.
All experiments were conducted within a maximum of 3 weeks after sample preparation. The respective sample was placed in the cold laboratory 1 hour before the first measure-ment for thermal equilibration. For some experimeasure-ments (Ta-ble 1), a cylindrical weight, corresponding to a stress of 133, 215 or 318 Pa, respectively, was carefully put on the sam-ple half an hour before starting the first measurement to ana-lyze the influence of external stress. Stress values were cho-sen to mimic different potential burial depths of new snow inside the snowpack. The stress values correspond to burial depths of about 0–30 cm, given an average new snow density of 100 g m−3.
The measurements were conducted with a computer tomo-graph (µCT 80, desktop system, SCANCO medical) operated in a cold laboratory at isothermal temperatures of about−13 or −18◦C. For a single set (no. 14, cf. Table 1), the tem-perature was varied systematically between higher values of about−3 and−8◦C to investigate the influence of temper-ature. For these samples, the temperature was recorded dur-ing the whole experiment with a sensor (iButton device) in the sealing cap of the sample holder. All samples were kept undisturbed in the µCT during the whole experiment which took 1 or 2 days. In one case, the measurement was extended to an entire week. µCT scans of a fixed (cylindrical) sub-volume in the middle of the sample with a total height of 6.3 mm were conducted automatically with a time-interval of 3 h. The nominal resolution was 10 µm voxel size and the energy 45 kV. One scan took about 2 hours. In total, 45 time series were measured, leading to more than 600 µCT scans.
For the analysis, a cubic volume of 6.3 mm edge length was extracted for each measurement and segmented into a bi-nary file of ice and air. From the resulting three-dimensional images, the ice fraction and the SSA was calculated – details in Schleef and Löwe (2013). In the following, the results are exclusively presented in terms of the the ice volume fraction φi, which is directly obtained from the µCT. The volume frac-tion can be related to the snow density viaρ=φiρiwith the temperature dependent density of iceρi=917−920 kg m−3 (0 to−20◦C) (Petrenko and Whitworth, 1999). For the SSA, we use the definition as surface area per ice volume, which is related to the surface area per ice mass (SSAm) by SSA=
ρiceSSAm.
Though we mainly focus on the ice volume fraction and the SSA for the analysis, we have additionally evaluated the Euler characteristicχ of the samples. The Euler char-acteristic provides information about the topology which has been proven useful to understand the evolution of the snow microstructure under forced compression in a micro-compression device (Schleef et al., 2014b). The Euler char-acteristic χ=2−2g is related to the interface genus g, which is an indicator for the connectivity of a structure (cf. e.g., Michelsen et al. (2003)). The Euler characteris-tic typically assumes negative values, corresponding to high positive values of the interface genus. The higher the genus, the lowerχand the higher the number of inter-particle con-tacts. We calculated the Euler characteristic from the inte-gral geometric approach of Minkowski functionals outlined by Michelsen et al. (2003). In accordance to the calculation of the SSA as a surface area per ice volume, we normalized the Euler characteristicχby the ice volume.
Table 1. Overview of experiments. Set numbers (1–8) correspond to natural snow, while (9–14) are snowmaker snow grown in the lab. The sets 9 and 10 were already used in Schleef and Löwe (2013) and included here for comparison. For each set, the number of samplesNsand the total number of measurementsNmper sample in a time series are given, in addition to applied stressesσand used temperaturesT. The initial values of ice fractionφi,0and SSA SSA0are averages over all samples within the set. For all observed crystal habits, the classification number is given according to Kikuchi et al. (2013), including potentially broken parts (I3a) of them.
Set no. Ns Nm σ T φice,0 SSA0 Class. no.
Pa ◦C mm−1
1 2 32 133, 215 –18 0.08 92 P3a, P3b, R1c, H1a, I2a
2 5 76 0, 133, 215, 318 –18 0.11 64 P2b, P4c, P4d 3 7 90 0, 133, 215, 318 –18 0.07 102 P3a, R1c, I2a
4 4 43 0, 133, 215, 318 –18 0.08 91 P3b, R1c
5 2 68 0 –13 0.11 77 C3b, C3c, C4d, P3a, P3b, A1a
6 2 30 0 –13 0.09 75 P3b, P4e, P4f, A2a, R1c
7 2 24 0 –13 0.08 92 C4b, C4d, P2b, H1a, H1b
8 2 24 0 –13 0.06 86 P1a, P2a, P3a, P3b, P4e, P4g
9 7 111 0, 133, 215, 318 –18 0.11 66 Not analyzed
10 2 32 215 –18 0.10 69 Not analyzed
11 1 19 0 –13 0.07 74 P3b, P3c, P4c
12 2 23 0 –13 0.07 75 P3b, P3c
13 1 8 0 –13 0.12 66 C1a, C1b, C1c, I1a
14 6 48 0, 133 –3, –8, –13 0.08 74 P3b, P3c
3 Results 3.1 Overview
The natural, new snow samples show large variations in the initial values of SSA and density. The snowmaker sam-ples also varied in their initial characteristics and param-eters due to different temperature settings of the machine (Schleef et al., 2014a). Overall, the initial ice volume frac-tions ranged from about 0.05 to 0.12. The initial SSA val-ues were in the range 62–105 mm−1, and the initialχvalues were between −2×105mm−3 and −12×105mm−3. The averaged initial values ofφiand SSA of each new snow type are listed in Table 1. The initial values had an influence on the settling, yielding a faster densification for a lower initial φiand a faster SSA decay for a higher initial SSA, but varia-tions of other parameters like temperature and stress also led to a high variability.
As a starting point for our subsequent analysis, we show the entire data for the temporal evolution of the ice volume fraction and the SSA for all samples in Fig. 1 and Fig. 2, re-spectively. Despite the variability, some trends are immedi-ately visible, e.g., an influence of the initial SSA on the sub-sequent decay. However, other trends which may be expected (e.g., a clear ordering of the densification rates according to the applied stress) are clearly absent. A more detailed analy-sis of the individual influences is necessary.
For one randomly selected sample of natural snow at
−13◦C, we extended the observation to a whole week. From the analysis, we obtained the evolution ofφiand SSA at high temporal resolution, as shown in Fig. 3. For the given ex-ample, no external stress was applied, but the volume
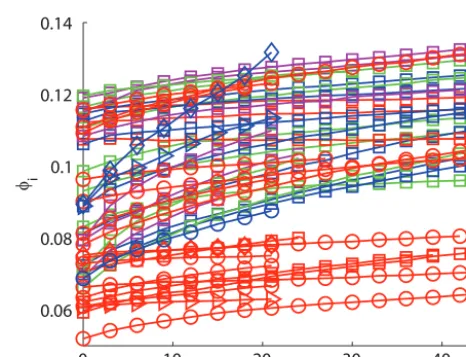
frac-Figure 1. Evolution of the ice volume fractionφi for all samples. Colors indicate different stress values: red – 0 Pa; blue – 133 Pa; green – 215 Pa; magenta – 318 Pa. Symbols indicated different tem-peratures:–18◦C,–13◦C,F–8◦C,♦–3◦C)
tion φi increased by more than 40 % from an initial value of about 0.11. At the same time, the SSA decreased from 77 mm−1 to 45 mm−1. A widely confirmed decay law for the SSA (Legagneux et al., 2004; Flanner and Zender, 2006; Kaempfer and Schneebeli, 2007; Schleef and Löwe, 2013) is given by
SSA(t )=SSA(0)
τ
t+τ
1/n
Figure 2. Evolution of the SSA for all samples. Colors indicate different stress values: red – 0 Pa; blue – 133 Pa; green – 215 Pa; magenta – 318 Pa. Symbols indicated different temperatures:– 18◦C,–13◦C,F–8◦C,♦–3◦C.
Figure 3. Evolution of ice volume fraction and SSA in 1 week at about−13◦C. The initial three-dimensional structure and crystal habit of this experiment are shown in Fig. 8 (bottom) and listed as snow 5 in Table 1. A fit of the SSA to Eq. (1) is plotted as black line.
with the parametersτ andn. A fit to the SSA data is shown in Fig. 3, with the parameters τ=27 h and n=3.8 (R2> 0.99).
For a visual demonstration of the microstructural evolu-tion, we combined sections of the three-dimensional images (snow 5) to a time-lapse movie which is provided as supple-mentary material. The densification and coarsening is clearly visible in the movie and occurs in the absence of recogniz-able particle rearrangements and the creation of new inter-particle contacts.
Figure 4. Plot of the ice volume fraction versus the SSA for all experiments reveals an almost linear relation for each time series. Legend: stress indicated by colors: red – 0 Pa; blue – 133 Pa; green – 215 Pa; magenta – 318 Pa. Temperature indicated by symbols:– 18◦C,–13◦C,F–8◦C,♦–3◦C;
3.2 General relation between density and SSA
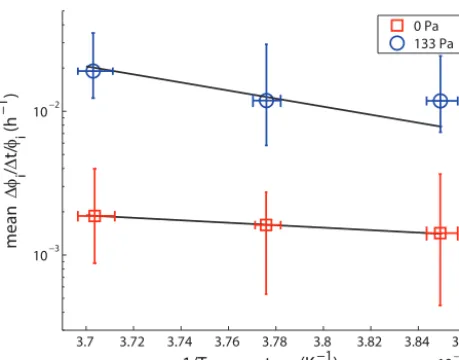
Figure 5. Densification rate averaged over 24 h as a function of tem-perature.
3.3 Influence of temperature
To investigate the influence of different (isothermal) tem-peratures, we measured the settling for one set of samples (snow 14 in Table 1) at three different laboratory tempera-tures. The temperature of the samples was recorded contin-uously during the experiments, resulting in mean values of
−3.1◦C,−8.3◦C and−13.4◦C. Even though additional fans were mounted inside the µCT to minimize temperature fluc-tuations, the temperature changed during each scan by up to
±0.5◦C due to the heating of the X-ray tube. In addition,
the defrosting cycles of the cold laboratory heat exchanger caused small changes in the temperature twice a day. In total, the temperature fluctuations were at a maximum of±0.6◦C over 1 day, with the largest changes for the mean temper-ature at −3.1◦C. For each temperature, we conducted one series without a weight on the sample and another one with a weight corresponding to a stress of 133 Pa, and we analyzed the density and the SSA.
3.3.1 Densification rate
The initial ice volume fractions of the samples were about 0.06–0.09. For the samples without applied stress, almost no densification was observed in 1 day. Therefore a clear de-pendency on the temperature could not be obtained from the data of these samples. In contrast, the series with an applied stress of 133 Pa showed a significant, steady densification of 27–48% per day, which is clearly influenced by the tempera-ture. The temperature influence of the densification of snow is often described by an Arrhenius law (Bader, 1960; Arnaud et al., 2000; Kirchner et al., 2001; Delmas, 2013),
˙
φi/φi=νexp
− E
kBTK
, (2)
Figure 6. SSA decay rate averaged over 24 h as a function of tem-perature.
with a rate constantν, an activation energyE, the Boltzmann constantkBand the temperatureTKin Kelvin. From the dif-ferences of the ice volume fraction between successive time steps, we obtain the experimental densification rates. Follow-ing the Arrhenius law, the mean densification rates per hour for each series are plotted against the inverse temperature in Kelvin in Fig. 5. The horizontal error bars result from the measured temperature fluctuations, whereas the vertical er-rors bars indicate the maximum deviations from the mean values. By fitting the results to Eq. (2), we find the parame-tersν=4.8×10⁸h−1andE=0.56 eV (R2=0.49) for the experiments with a stress of 133 Pa. The same fit for the ex-periments without stress yieldsν=2.8 h−1andE=0.16 eV (R2=0.99). However, there was only a marginal change in the density.
3.3.2 SSA decrease rate
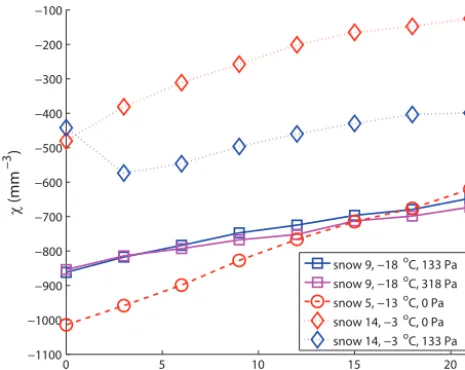
Figure 7. Selected examples of the evolution of the Euler character-isticχfor different new snow types (cf. Table 1) during the first day of settlement: The 1-week measurement (snow 5, Fig. 3), two exam-ples of snow 9 with different applied stresses (taken from Schleef and Löwe (2013)), and two examples of snow 14 with different, applied stresses at−3◦C.
a much higher SSA difference between the first two measure-ments of the time series. By neglecting the first measurement, the difference of the SSA rate at high temperatures between the experiments with and without applied stress would only be small. The particularity of the first time step is revealed by the Euler characteristic, which is analyzed below.
3.4 Influence of other morphological properties 3.4.1 Euler characteristic
A few selected examples for the evolution of the Euler char-acteristic χ over 1 day are shown in Fig. 7. For most ex-periments, the Euler characteristic χ increases monotoni-cally with a decreasing rate. In these cases, the rate increased slightly with increasing temperature, but an influence of ex-ternal stress was not observed. This is shown for one example (snow 9 in Fig. 7). For some experiments, at higher tempera-tures, this monotonic behavior of the Euler characteristic dis-appears. The measurement without applied stress (snow 14,
−3◦C, 0 Pa) shows a monotonic increase, similar to the other experiments at lower temperatures, similar to the evolution of the 1-week measurement (snow 5) and similar to the experi-ments from Schleef and Löwe (2013) (snow 9). However, if the stress is changed to 133 Pa (snow 14 at−3◦C, 133 Pa), a different non-monotonic evolution of the Euler character-istic at the beginning of the experiment is observed. After this initial phase, the connectivity decreased again monoton-ically (i.e., increase of χ), similar to the evolution of the corresponding experiment without applied stress. The rate was, however, slightly lower. Such a significant decrease of
the Euler characteristic within the first 3 hours between the first and the second measurement has been observed only for a few measurements, predominantly at higher temperatures. This decrease of the Euler characteristic corresponds to an increase of the number of inter-particle contacts, which con-tributes to the decrease of the SSA (Schleef et al., 2014b). These cases gave rise to the larger error in the SSA rate for higher temperatures in Fig. 6.
3.4.2 Crystal habit
Finally, we turn to apparent visual differences in the mor-phology of the crystals. From the photographs, we compared the crystal habits of our samples to the classification of natu-ral snow crystals (Kikuchi et al., 2013), as listed in Table 1. In most cases, we observed broken parts of the respective crystal types, which might be caused by sieving. However, also wind can lead to broken crystals in nature, and we could still identify the original crystal for the classification. An un-ambiguous classification for each snow sample was, how-ever, not possible, because each sample contained a mixture of different habits. This was particularly the case for natu-ral snow. For some samples, however, specific crystal habits dominated.
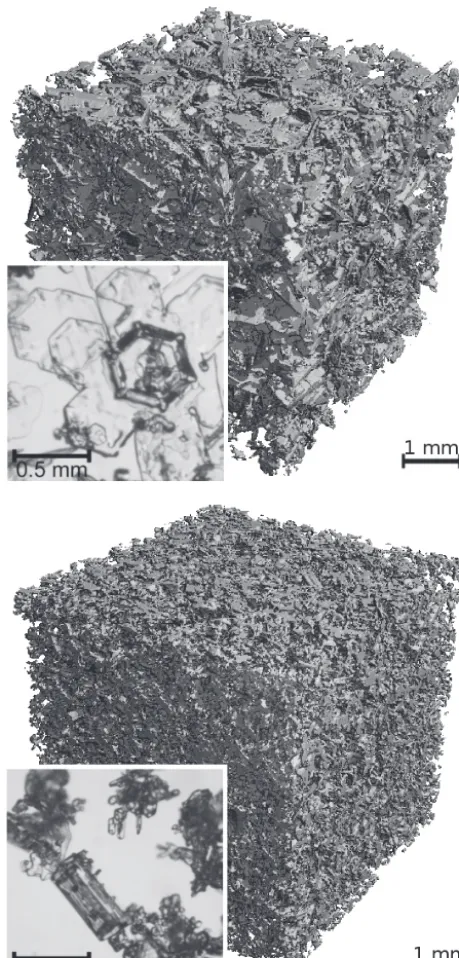
Figure 8 shows two examples of natural snow samples with a photo of the prominent crystal habit and the cor-responding µCT image of the initial structure. The sam-ple (Fig. 8, bottom) is the one with the evolution shown in Figure 3 (snow 5 in Table 1), with dominant crystal habit of skeletal columns with scrolls (C3c) and combinations of columns and bullets (A1a). For comparison, we picked an-other sample (Fig. 8, top) which had almost the same initial ice fraction (snow 2 in Table 1) but a different dominating crystal habit (broad branches, P2b). This sample was unique since no densification at all could be measured within 2 days at−18◦C, in contrast to the previous sample (snow 5), which showed a densification of about 18 % within the same span at−13◦C. However, the large difference cannot be explained by the temperature, because, for all other samples, there is no trend for the densification between the measurements at−13 or−18◦C. There are also other samples with smaller differ-ences in the densification rates for the same volume fraction and the same temperature and stress. In contrast, for the SSA decay rate, no clear influence of the crystal habit has been found. In most cases, the SSA evolution at the same temper-ature is identical for the same SSA values.
3.5 Combined influence of stress, temperature and morphology: parameterizations
Figure 8. Examples of natural snow samples with a photograph of the crystal habit and an µCT image of the initial structure. The parameters of the sample at the top are φi,0≈0.1 and SSA0≈ 62 mm−1 (snow 2 in Table 1), and of the sample at the bottom
φi,0≈0.1 and SSA0≈77 mm−1 (snow 5 in Table 1, evolution shown in Fig. 3).
Figure 9. Scatterplot of SSA decay rates SSA, computed from˙ Eq. (4) (horizontal axis) versus measurements. Different stresses are indicated by colors: red 0 Pa, blue 133 Pa, green 215 Pa, ma-genta 318 Pa; different temperatures are indicated by the symbols: –18◦C,–13◦C,F–8◦C,♦–3◦C; snow types are indistin-guishable.
3.5.1 SSA decrease rate
For the SSA decrease, we start from the widely used power law given in Eq. (1). This is motivated by the very good agreement of Eq. (1) for the 1-week measurement (Fig. 3), even though other functional forms are also discussed in lit-erature (Taillandier et al., 2007). To proceed, we note that Eq. (1) is the solution of the differential rate equation
˙
SSA=A×SSAm, (3)
if the parameters from Eq. (1) are chosen according ton=
m−1 andτ = − 1
A nSSA(0)
−n. The proportionality ofτ to SSA(0)−nis in accordance with the derivation from Legag-neux et al. (2004). On the other hand, our observations from Sect. 3.3 indicate a linear influence of the temperature on the SSA decrease rate. However, no influence on the ap-plied stress has been observed during coarsening, except for one case discussed in Sect. 3.3.2. In addition, we have ob-served that, for some cases, the initial SSA rates are influ-enced by topological changes during densification (Fig. 7), as described by the Euler characteristicχ(Sect. 3.4.1). In sum-mary, we chose the following form for the statistical model
˙
SSA=(a+b T )SSAm+cχ ,˙ (4)
Figure 10. Scatterplot of densification ratesφ/φ˙ , computed from Eq. (7) (horizontal axis) versus measurements (vertical axis). Dif-ferent stresses are indicated by colors: red – 0 Pa; blue – 133 Pa; green – 215 Pa; magenta – 318 Pa. Different temperatures are indi-cated by symbols:–18◦C,–13◦C,F–8◦C,♦–3◦C; snow types are indistinguishable.
contacts during settling between the ice grains. Crucial topo-logical changes, i.e., the creation of new contacts within the structure, occurred only for a few samples at the beginning of the series of measurements.
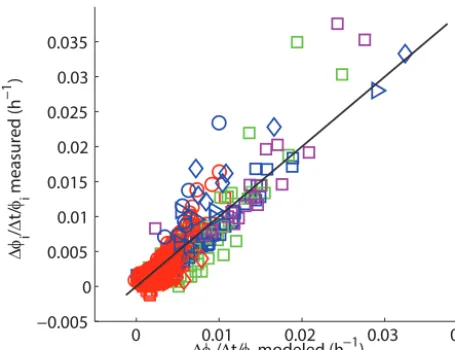
A fit of Eq. (4) to the SSA rates obtained from the differ-ence1SSA/1t of successive measurement typically within 3 hours for our complete data set yielda=2.9×10⁻⁷, b=
9.5×10⁻⁹, c= −3.5×10⁻³ andm=3.5 with R2=0.83 (T in◦C, SSA in mm−1andχ˙ in mm−3). The scatterplot be-tween modeled and measured SSA rates is shown in Fig. 9.
If we neglect the measurements where noticeable topolog-ical changes (χ <˙ 0) occurred, which was only the case for 10 samples for the first measurements, we could simplify the model to
˙
SSA=(a0+b0T )SSAm0, (5)
leading to fit parameters a0=1.1×10⁻⁶, b0=3.1×10⁻⁸ andm0=3.1. In this case, we obtain an even improved per-formance (R2=0.87). This is particularly interesting, given the practical impossibility to measure the Euler characteris-tic without tomography.
3.5.2 Densification rate
A parameterization for the densification rateφi˙ for all
mea-surements turns out to be more complicated than for SSA,˙ since φ˙i is not only influenced by temperature and the ini-tial valueφi,0, but also by the stress and the crystal habit, as described before.
To motivate a model which aims to fit the entire data, we start from the common stress dependence of the strain rate for visco-plastic flow of polycrystalline ice, which is
Figure 11. Scatterplot of the predicted SSA difference1SSA(48 h)
after 48 h, obtained from the parameterizations Eq. (13) in Tail-landier et al. (2007) (vertical axis) and from the present parameteri-zation, Eq. (5) (horizontal axis), which were respectively applied to the different available data sets (legend).
commonly described by Glen’s law for secondary creep,
˙
ε=Aσk (Petrenko and Whitworth, 1999). A similar form is believed to be valid for snow (Kirchner et al., 2001). In a one-dimensional system, the strain rateε˙ can be taken as the relative densification rateε˙= ˙φi/φi(cf. also Schleef and Löwe (2013)), leading to
˙
φi/φi=Aσk, (6)
with a constantAcontaining the rate of the process. On the other hand, we have empirically observed that the volume fraction is almost linearly related to the SSA (Sect. 3.2). Hence, we chose the rate in Eq. (6) to be deter-mined mainly by the SSA rate,A=BSSA, and end up with˙
˙
φi/φi=BSSA˙ σk (7)
for our parameterization model, which includes two parame-ters,Bandk. We note that integrating Eq. (7) in fact implies ln(φi)∼SSA and not a linear dependence. This is, however, in accordance with the result from Sect. 3.2, in which the logarithmic or the linear relation are indistinguishable. Thus, Eq. (7) constitutes a reasonable trade off and naturally in-cludes a dependence of the densification rate on the density itself.
the evaluation cube. The same value was chosen by Schleef and Löwe (2013). The scatterplot between modeled and mea-sured densification rates is shown in Fig. 10, yieldingR2=
0.82.
As suggested by the results from Schleef et al. (2014b), the Euler characteristic has an influence on the densification by discerning different connectivities. Accordingly, a slight improvement of the parameterization (7) is obtained by in-cluding the Euler characteristic via
˙
φi/φi=(B0σk+C0χ )˙ SSA˙ (8) which yieldsR2=0.85. In contrast to Eq. (4), where the ad-ditive dependence of the SSA decrease on the Euler char-acteristic was motivated by process insight (Schleef et al., 2014b), the inclusion ofχin Eq. (8) is purely empirical. 3.6 Comparison to an existing parameterization Finally, we compare our parameterization (5) for the SSA evolution to an existing parameterization from Taillandier et al. (2007), who derived a parameterization SSAT2007(t, T ,SSA(0)) – Eq. (13) in their paper – for the isothermal and quasi-isothermal evolution of the SSA, with time (t) for given temperature (T) and initial value SSA(0). The parameterization was derived from SSA measurements which were conducted by the Brunauer– Emmett–Teller (BET) method of gas adsorption, with new-snow samples collected after snowfall. With re-spect to the involved parameters, this is exactly equiva-lent to our parameterization SSAS2014(t, T ,SSA(0)), which is obtained from integrating Eq. (5). To compare the overall trends of both parameterizations, we have com-puted the SSA difference after 48 h, viz. 1SSAX(48h)= SSAX(48h, T ,SSA(0))−SSAX(0h, T ,SSA(0))for both for-mulations X=T2007,S2014, as a measure of the averaged SSA decay rate on the first day after snowfall. To use realis-tic values for(T ,SSA(0))from real data sets, we have eval-uated the difference1SSAX(48 h) for the present data set – 45 tuples of(T ,SSA(0))–, the isothermal experiments 1–9 from Taillandier et al. (2007) (9 tuples), and the experiments 1–5 from Legagneux et al. (2003) (5 tuples). The results are shown in Fig. 11. A clear deviation from the 1:1 line is ob-served. In general, our parameterization of the SSA decay rate is biased low, compared to Taillandier et al. (2007). This bias remains, even if 1SSAX(t )is evaluated for other ts. However, the parameterization T2007, based on BET mea-surements, and the parameterization S2014, based on µCT measurements, are clearly correlated. In both cases, the ma-jor influence on the SSA decrease rate stems from the initial value SSA(0).
4 Discussion 4.1 Main result
We start the discussion with the parameterization of the SSA and the densification for new snow under isothermal con-ditions (Sect. 3.5). The parameterizations are motivated by available models for the SSA (Legagneux et al., 2004) and Glen’s law for creep of polycrystalline ice (Petrenko and Whitworth, 1999). Conceptually, current snowpack models (Vionnet et al., 2012; Jordan, 1991; Bartelt and Lehning, 2002) use a similar approach for the densification, but still based on traditional grain size to characterize the microstruc-ture. Only recently was the model Crocus reformulated (Car-magnola et al., 2014) to use SSA as the simplest objective, morphological metric directly.
Our experiments focused only on new snow with low den-sity and high SSA, and most of our results are probably not valid for denser snow. In contrast to denser snow under isothermal metamorphism, we found that the densification rate is directly related to metamorphism via the SSA decrease rate. This is reflected by the consistent linear variation of the ice volume fraction with the SSA (Fig. 4). This observation was implemented in the parameterization by a prefactor in the densification rate, which is proportional to the SSA rate. We have set up the parameterization for the densification in a way to guarantee that both evolution laws are only dependent on the quantitiesφi (or the density), the stressσ, the SSA and theT to best fit the entire available data of new snow. These quantities are directly available in snowpack models, and Eqs. (5, 7) provide a closed set of empirical, microstruc-tural evolution equations for the density and the SSA under isothermal conditions. Both microstructural parameters, SSA and density can also be obtained in the field without the use of tomography (Matzl and Schneebeli, 2006; Gallet et al., 2009; Arnaud et al., 2011).
might have an influence. If the isothermal experiments from Taillandier et al. (2007) were subject to temperature fluctua-tions larger than our accuracy of±0.6◦C, these fluctuations
might cause an increase of the SSA decay rate, according to mechanisms mentioned in Pinzer and Schneebeli (2009). A quantitative estimate of this effect is, however, not yet possi-ble. Third, a systematic error of the µCT measurements com-pared to BET measurements used in Taillandier et al. (2007) at these very high SSA values could not be ruled out. The comparison of BET and µCT from Kerbrat et al. (2008) has not revealed a systematic bias, though, but the uncertainty between both methods clearly increases at high SSA values. For very high SSA values, our µCT measurements with a voxel size of 10µm are at the limit of the resolution. Ideally, remaining uncertainties about absolute values of very high SSA should be further investigated within dedicated inter-comparison experiments.
The origin of the remaining differences between both pa-rameterizations could not be convincingly explained. How-ever, the trends from Fig. 11 obtained from the two parame-terizations, which were based on different experimental tech-niques (µCT vs BET), are highly consistent. This motivates to measure the SSA of new snow also by other, less demand-ing techniques in the field. This will help to explore the in-fluence of the initial SSA on new snow densification and im-prove the performance of snowpack models. Below, we dis-cuss the particularities of the SSA decrease rate and densifi-cation rate in view of the involved parameters.
4.3 SSA decrease rate
Our simple parameterization for the SSA change (4) yielded good agreement for almost all of our measurement data. The exponent m, obtained from the fit, must be compared to n from the widely used Eq. (1) vian=m−1, yieldingn=2.5. As already outlined by Schleef and Löwe (2013), the precise value ofnis difficult to estimate if the duration of the exper-iment is similar toτ, which is typically on the order of 1 day. This is confirmed by the 1-week measurement which allowed a better estimate of the fit parameters in Eq. (1). The obtained exponentn=3.8 agreed well with the results of Legagneux et al. (2004), who found n=3.4−5.0 at a temperature of
−15◦C. In contrast, the results of the short time measure-ments did not lead to a conclusive estimate forn. Also, the fits to the 2-day time series by Schleef and Löwe (2013) gave higher values ofnand only an adapted combination of all se-ries resulted in a similarnof about 3.9. However, the value n=2.5 indicates that, even for short times, the SSA decrease rate is dominantly influenced by the present value of the SSA in a non-linear way. It is generally believed that the value of n is also influenced by temperature, potentially caused by different underlying mechanisms of mass transport (Vetter et al., 2010; Löwe et al., 2011). In view of the difficulties of estimatingnfor the short time series, we have restricted our-selves to an inclusion of the temperature dependence into the
prefactor in Eq. (4) to account for the acceleration of meta-morphism at higher temperatures (Fig. 6).
We have previously observed that the SSA evolution was in fact independent of the densification or the applied stress, respectively (Schleef and Löwe, 2013). This was confirmed here for all experiments conducted at lower temperatures of
−13◦C or−18◦C (cf. Table 1). This behavior seems to be generally valid for all examined types of new snow. In addi-tion, no difference could be observed between the evolution of sieved, natural, new snow and snowmaker snow, which is in agreement with the results presented by Schleef et al. (2014a). The reason for the negligible stress dependence at low temperatures is that coarsening is the only relevant process. In these cases, the Euler characteristic is a mono-tonic function with time (this is further explained below). At higher temperatures, we have also observed cases in which the Euler characteristic initially decreased. This is a clear in-dicator of structural rearrangements and newly formed ice– ice contacts, which contribute to the SSA decrease (Schleef et al., 2014b). This was, however, observed only for a few cases. If present, the structural rearrangements and their im-pact on the SSA do depend on stress. This was revealed by the 2 (out of 584)1SSA/1toutliers in Fig. 9. These are the first values of the series of measurements with an applied stress of 133 Pa at temperatures of−3◦C and −8◦C. For these exact measurements, a significant, direct influence of the applied stress on the SSA evolution was observed, which is not captured by the model (4). The data are, however, too limited to investigate this effect in greater detail. Apart from that, the parameterization in Eq. (4), which is solely based on common snowpack model parameters, is well suited for modeling the SSA decrease of new snow.
4.4 Densification rate
The analysis ofφ˙iis based on the observation of the almost linear relation between the evolution ofφiand SSA for each series of measurement (Fig. 4). Measurements of Legagneux et al. (2002); Domine et al. (2007) show a logarithmic re-lation between density and SSA, which is, however, derived from independent measurements in a seasonal snowpack and covers much wider SSA and density ranges. As outlined in Sect. 3.2, a logarithmic relation for each of our series of mea-surements would also be possible here, and the linear relation might only be an approximation for short observation times. It is, however, not the functional form which is worth men-tioning, but rather the fact that the density evolution and the SSA evolution are intimately related.
creep rateAin Eq. (7). The Arrhenius analysis of the tem-perature dependence for one of the sets for two stress values (Fig. 5) revealed that the densification is almost negligible for the case without weight. For the experiments with applied stress, a faster rate ofφ˙i/φi could only be observed at about
−3◦C. The Arrhenius fit (2) yields an activation energy in the same order of magnitude as known for different possible processes in ice (about 1 eV, cf. Kirchner et al. (2001) and references therein), but the limited amount of data with just one series of measurement at−3◦C and 133 Pa did not allow for conclusive parameter estimates. Obtaining reliable data for higher temperatures by desktop tomography is generally difficult, since the time scales for the fast structural changes in new snow are already on the order of the scanning times; image artifacts arise. Due to this technical limitation, most experiments were conducted at−13◦C or−18◦C, where no
general trend for a faster densification at higher temperatures could be observed.
4.5 The influence of other morphological parameters Besides the most important microstructural parameters, den-sity and SSA, we have also classified crystal habits to make contact to traditional characterization of crystal morphology and calculated the Euler characteristic to make contact with more advanced morphological metrics.
4.5.1 Crystal habit
For selected examples, the classification of crystal habits has helped to empirically interpret experimental scatter. The ex-amples in Fig. 8 have shown that densification can easily dif-fer by about 18%, which cannot be explained by the temper-ature difference alone. Differences in crystal habit and their influence on the densification rate are not captured by our pa-rameterization, which contains the SSA as the only morpho-logical parameter. It seems unlikely that SSA is a sufficient morphological description of new snow type in the densifica-tion rate, as suggested by Eq. (7). However, for most of our measurements, the parameterization in Eq. (7) works reason-ably well, even though only two fit parameters are involved. In contrast, for the SSA evolution, the crystal habit does not have an evident influence. Similar decay rates were found for samples with similar initial SSA but different crystal habits. Overall, the classification in terms of crystal habits was only of limited use. Some influence of the habit might be acknowl-edged, but future effort should rather aim at other quantita-tive, morphological parameters to explain the remaining scat-ter.
4.5.2 Euler characteristic
As suggested by recent compression experiments of new snow (Schleef et al., 2014b), the Euler characteristic might be a candidate morphological parameter to better interpret the evolution of SSA and density. Quantitatively, we have
seen that the inclusion of the Euler characteristic in the pa-rameterizations with Eqs. (4) and (8) only makes a slight difference for the very initial stage at which some particle rearrangements are noticeable. For the majority of samples, we observed a monotonic increase of the Euler characteris-tic, or, equivalently, a monotonic decrease of the number of contacts. This is expected as a consequence of coarsening of bicontinuous morphologies alone (Kwon et al., 2007), where contacts, made of fine filaments, disappear. For a highly porous material like new snow, the slow creep deformation considered here does not cause significant structural rear-rangements and new contacts. This is also confirmed by vi-sual inspection of the deformation in the movie (cf. supple-mentary material). For a few experiments, the Euler charac-teristic signaled an increase of the connectivity at the begin-ning. This was the case for samples with faster creep rates due to higher temperature, higher stresses or a very tenu-ous structures. In these cases, an influence on the evolution of SSA andφi can be observed, which is not captured by Eqs. (4) and (8). However, initial structural rearrangements stabilize quickly. This is consistent with externally forced re-arrangements in deformation controlled compression exper-iments (Schleef et al., 2014b), though in a less pronounced way.
5 Conclusions
We have compiled a large data set of 45 time series (and a to-tal of 600 µCT measurements) of in situ experiments of new snow densification and metamorphism by µCT. For a quanti-tative characterization of all experiments, we have derived a parameterization for the SSA decrease and densification rate, which performs reasonably well (R2=0.87,0.82, respec-tively) for the entire data set of new snow experiments which were evaluated for the present analysis. The parameterization is only based on the parameters SSA, density, temperature and stress, which are already available in current snowpack models, and which can be easily measured in the field. With these parameters, the main influences of metamorphism and densification of new snow can be quantitatively described. Advanced morphological metrics like the Euler characteris-tic give additional insight in the interpretation of the SSA and density evolution. The parameterizations have, however, not improved significantly upon inclusion of this parameter. This might be different for high temperatures close to 0◦C, where only few data are available due to the experimental limita-tions of µCT imaging for fast microstructural changes. It is, however, likely that an additional morphological parameter besides the SSA is required to reduce the remaining scatter in the description of new-snow densification. This will re-quire additional, theoretical work to guide the choice of a relevant parameter and suggest functional forms for parame-terizations which improve existing ones.
The comparison of our parameterization for the SSA (as a function of time, temperature and initial SSA) with a for-mally equivalent one from Taillandier et al. (2007) has re-vealed a bias in the absolute values of SSA decrease. The trends of both formulations are, however, highly consistent. These trends can probably also be reproduced by simpler SSA retrieval methods (other than µCT or BET) which are more convenient to use in the field. This is important for fur-ther validation of snowpack models. We have shown that the rate of SSA decrease, and thereby the SSA itself, probably has the most dominant influence on isothermal densification of new snow. Hence, monitoring the SSA for operational pur-poses might greatly help to constrain the initial densification of snow after snowfall.
The Supplement related to this article is available online at doi:10.5194/tc-8-1825-2014-supplement.
Acknowledgements. We thank Florent Domine and two anony-mous reviewers for their helpful suggestions on the manuscript. This work was funded by the Swiss National Science Foundation (SNSF) through grant no. 200021 132549.
Edited by: F. Domine
References
Arnaud, L., Barnola, J. M., and Duval, P.: Physical modeling of the densification of snow / firn and ice upper part of polar ice sheets, in: Physics of Ice Core Records, edited by Hondoh, T., vol. 159, pp. 285–305, Hokkaido University Press, Sapporo, Japan, 2000. Arnaud, L., Picard, G., Champollion, N., Domine, F., Gallet, J., Lefebvre, E., Fily, M., and Barnola, J.: Measurement of verti-cal profiles of snow specific surface area with a 1 cm resolution using infrared reflectance: instrument description and validation, J. Glaciol., 57, 17–29, 2011.
Bader, H.: Theory of densification of dry snow on high polar glaciers, US Army SIPRE Res. Rep., 69, 1960.
Bartelt, P. and Lehning, M.: A physical SNOWPACK model for the Swiss avalanche warning Part I: numerical model, Cold Reg. Sci. Technol., 35, 123–145, 2002.
Cabanes, A., Legagneux, L., and Domine, F.: Evolution of the spe-cific surface area and of crystal morphology of Arctic fresh snow during the ALERT 2000 campaign, Atmos. Environ., 36, 2767– 2777, 2002.
Cabanes, A., Legagneux, L., and Domine, F.: Rate of evolution of the specific surface area of surface snow layers, Environ. Sci. Technol., 37, 661–666, 2003.
Calonne, N., Flin, F., Geindreau, C., Lesaffre, B., and Rolland du Roscoat, S.: Study of a temperature gradient metamorphism of snow from 3-D images: time evolution of microstructures, phys-ical properties and their associated anisotropy, Cryosphere Dis-cuss., 8, 1407–1451, 2014.
Carmagnola, C. M., Morin, S., Lafaysse, M., Domine, F., Lesaffre, B., Lejeune, Y., Picard, G., and Arnaud, L.: Implementation and evaluation of prognostic representations of the optical diameter of snow in the SURFEX/ISBA-Crocus detailed snowpack model, The Cryosphere, 8, 417–437, 2014,
http://www.the-cryosphere-discuss.net/8/417/2014/.
Delmas, L.: Influence of snow type and temperature on snow vis-cosity, J. Glaciol., 59, 87–92, 2013.
Domine, F., Taillandier, A.-S., and Simpson, W. R.: A parameteri-zation of the specific surface area of seasonal snow for field use and for models of snowpack evolution, J. Geophys. Res., 112, F02031, 2007.
Flanner, M. G. and Zender, C. S.: Linking snowpack microphysics and albedo evolution, J. Geophys. Res., 111, D12208, 2006. Gallet, J.-C., Domine, F., Zender, C. S., and Picard, G.:
Measument of the specific surface area of snow using infrared re-flectance in an integrating sphere at 1310 and 1550 nm, The Cryosphere, 3, 167–182, 2009,
http://www.the-cryosphere-discuss.net/3/167/2009/.
Jordan, R.: A one-dimensional temperature model for a snow cover: Technical documentation for SNTHERM.89, CRREL Spec. Rep., 91-16, 1991.
Kaempfer, T. and Schneebeli, M.: Observation of isothermal meta-morphism of new snow and interpretation as a sintering process, J. Geophys. Res., 112, D24101, 2007.
Kerbrat, M., Pinzer, B., Huthwelker, T., Gaeggeler, H., Ammann, M., and Schneebeli, M.: Measuring the specific surface area of snow with X-ray tomography and gas adsorption: comparison and implications for surface smoothness, Atmos. Chem. Phys., 8, 1261–1275, 2008,
Kikuchi, K., Kameda, T., Higuchi, K., and Yamashita, A.: A global classification of snow crystals, ice crystals, and solid precipita-tion based on observaprecipita-tions from middle latitudes to polar regions, Atmos. Res., 132-133, 460–472, 2013.
Kirchner, H. O. K., Michot, G., Narita, H., and Suzuki, T.: Snow as a foam of ice: plasticity, fracture and the brittle-to-ductile transi-tion, Philos. Mag. A, 81, 2161–2181, 2001.
Kwon, Y., Thornton, K., and Voorhees, P.: Coarsening of bicontinu-ous structures via nonconserved and conserved dynamics, Phys. Rev. E, 75, 021120, 2007.
Legagneux, L., Cabanes, A., and Domine, F.: Measurement of the specific surface area of 176 snow samples using methane adsorp-tion at 77 K, J. Geophys. Res., 107, 4335, 2002.
Legagneux, L., Lauzier, T., Domine, F., Kuhs, W., Heinrichs, T., and Techmer, K.: Rate of decay of specific surface area of snow during isothermal experiments and morphological changes stud-ied by scanning electron microscopy, Can. J. Phys., 81, 459–468, 2003.
Legagneux, L., Taillandier, A.-S., and Domine, F.: Grain growth theories and the isothermal evolution of the specific surface area of snow, J. Appl. Phys., 95, 6175, 2004.
Lehning, M., Bartelt, P., Brown, B., Fierz, C., and Satyawali, P.: A physical SNOWPACK model for the Swiss avalanche warning Part II. Snow microstructure, Cold Reg. Sci. Technol., 35, 147– 167, 2002.
Libois, Q., Picard, G., France, J. L., Arnaud, L., Dumont, M., Car-magnola, C. M., and King, M. D.: Influence of grain shape on light penetration in snow, The Cryosphere, 7, 1803–1818, 2013, http://www.the-cryosphere-discuss.net/7/1803/2013/.
Löwe, H., Spiegel, J., and Schneebeli, M.: Interfacial and structural relaxations of snow under isothermal conditions, J. Glaciol., 57, 499–510, 2011.
Löwe, H., Riche, F., and Schneebeli, M.: A general treatment of snow microstructure exemplified by an improved relation for thermal conductivity, The Cryosphere, 7, 1473–1480, 2013, http://www.the-cryosphere-discuss.net/7/1473/2013/.
Matzl, M. and Schneebeli, M.: Measuring specific surface area of snow by near-infrared photography, J. Glaciol., 52, 558–564, 2006.
McCreight, J. L. and Small, E. E.: Modeling bulk density and snow water equivalent using daily snow depth observations, The Cryosphere, 8, 521–536, 2014,
http://www.the-cryosphere-discuss.net/8/521/2014/.
Michelsen, K., De Raedt, H., and De Hosson, J.: Aspects of math-ematical morphology, Adv. Imag. Elect. Phys., 125, 119–194, 2003.
Perovich, D. K.: Light reflection and transmission by a temperate snow cover, J. Glaciol., 53, 201–210, 2007.
Petrenko, V. F. and Whitworth, R. W.: Physics of ice, Oxford Uni-versity Press, 1999.
Pinzer, B. R. and Schneebeli, M.: Snow metamorphism under alter-nating temperature gradients: Morphology and recrystallization in surface snow, Geophys. Res. Lett., 36, L23503, 2009. Schleef, S. and Löwe, H.: X-ray microtomography analysis of
isothermal densification of new snow under external mechanical stress, J. Glaciol., 59, 233–243, 2013.
Schleef, S., Jaggi, M., Löwe, H., and Schneebeli, M.: An improved machine to produce nature-identical snow in the laboratory, J. Glaciol., 60, 94–102, 2014a.
Schleef, S., Löwe, H., and Schneebeli, M.: Hot pressure sintering of low density snow analyzed by X-ray microtomography and in-situ micro-compression, Acta Mater., 71, 185–194, 2014b. Steinkogler, W., Fierz, C., Lehning, M., and Obleitner, F.:
Sys-tematic Assessment of New Snow Settlement in SNOWPACK, Proceedings of the 2009 International Snow Science Workshop, Davos, Switzerland, 132–135, 2009.
Taillandier, A.-S., Domine, F., Simpson, W. R., Sturm, M., and Dou-glas, T. a.: Rate of decrease of the specific surface area of dry snow: Isothermal and temperature gradient conditions, J. Geo-phys. Res., 112, F03003, 2007.
Thompson, G., Field, P. R., Rasmussen, R. M., and Hall, W. D.: Ex-plicit Forecasts of Winter Precipitation Using an Improved Bulk Microphysics Scheme. Part II: Implementation of a New Snow Parameterization, Mon. Wea. Rev., 136, 5095–5115, 2008. Vetter, R., Sigg, S., Singer, H. M., Kadau, D., Herrmann, H. J., and
Schneebeli, M.: Simulating isothermal aging of snow, Europhys. Lett., 89, 26001, 2010.
Vionnet, V., Brun, E., Morin, S., Boone, A., Faroux, S., Le Moigne, P., Martin, E., and Willemet, J.-M.: The detailed snowpack scheme Crocus and its implementation in SURFEX v7.2, Geosci. Model Dev., 5, 773–791, 2012.