www.atmos-meas-tech.net/9/535/2016/ doi:10.5194/amt-9-535-2016
© Author(s) 2016. CC Attribution 3.0 License.
Multi-sensor analysis of convective activity in central Italy
during the HyMeX SOP 1.1
N. Roberto1, E. Adirosi1, L. Baldini1, D. Casella1, S. Dietrich1, P. Gatlin2, G. Panegrossi1, M. Petracca1,3, P. Sanò1, and A. Tokay4,5
1CNR – Istituto di Scienze dell’Atmosfera e del Clima, Rome, Italy 2NASA Marshall Space Flight Center, Huntsville, AL, USA 3Department of Physics, University of Ferrara, Ferrara, Italy
4Joint Center for Earth Systems Technology, University of Maryland Baltimore County, Baltimore, MD, USA 5NASA Goddard Space Flight Center, Greenbelt, MD, USA
Correspondence to: N. Roberto ([email protected])
Received: 30 July 2015 – Published in Atmos. Meas. Tech. Discuss.: 7 September 2015 Revised: 12 January 2016 – Accepted: 14 January 2016 – Published: 17 February 2016
Abstract. A multi-sensor analysis of convective precipita-tion events that occurred in central Italy in autumn 2012 dur-ing the HyMeX (Hydrological cycle in the Mediterranean experiment) Special Observation Period (SOP) 1.1 is pre-sented. Various microphysical properties of liquid and solid hydrometeors are examined to assess their relationship with lightning activity. The instrumentation used consisted of a C-band dual-polarization weather radar, a 2-D video dis-drometer, and the LINET lightning network. Results of T-matrix simulation for graupel were used to (i) tune a fuzzy logic hydrometeor classification algorithm based on Liu and Chandrasekar (2000) for the detection of graupel from C-band dual-polarization radar measurements and (ii) to re-trieve graupel ice water content. Graupel mass from radar measurements was related to lightning activity. Three signif-icant case studies were analyzed and linear relations between the total mass of graupel and number of LINET strokes were found with different slopes depending on the nature of the convective event (such as updraft strength and freezing level height) and the radar observational geometry. A high coef-ficient of determination (R2=0.856) and a slope in agree-ment with satellite measureagree-ments and model results for one of the case studies (15 October 2012) were found. Results confirm that one of the key features in the electrical charging of convective clouds is the ice content, although it is not the only one. Parameters of the gamma raindrop size distribution measured by a 2-D video disdrometer revealed the transition from a convective to a stratiform regime. The raindrop size
spectra measured by a 2-D video disdrometer were used to partition rain into stratiform and convective classes. These results are further analyzed in relation to radar measurements and to the number of strokes. Lightning activity was not al-ways recorded when the precipitation regime was classified as convective rain. High statistical scores were found for re-lationships relating lightning activity to graupel aloft.
1 Introduction
ex-periment (HyMeX) includes some exex-perimental activities to investigate convection. In particular, the Special Observa-tion Period (SOP) 1.1 that took place between 5 Septem-ber and 6 NovemSeptem-ber 2012 in target regions of the Mediter-ranean region was dedicated to observing heavy precipita-tion and flash floods (Ducrocq et al., 2014). Several instru-mented hydrometeorological sites, three of them in Italy – Liguria–Tuscany (LT), northeastern Italy (NEI), and central Italy (CI) – were set up to investigate the mechanisms re-sponsible for the heavy precipitation events in these areas (see Ferretti et al., 2014; for an overview of the SOP activ-ities in Italy). The CI site is of particular interest both for its central position between the Adriatic Sea and the Tyrrhe-nian Sea, and because it includes the densely populated ur-ban area of Rome consisting of approximately 4 million in-habitants. In the late summer–early autumn, severe weather conditions are quite frequent in CI and are mostly related to the development of intense convective systems (Melani et al., 2013). The correct forecast of precipitation associated with these events is linked to the ability of numerical models to initiate convection, which is especially challenging over the Tyrrhenian Sea, and with the correct representation of cloud microphysical processes (Ferretti et al., 2014). The micro-physical schemes used by NWP models often misrepresent the auto-conversion processes as well as the characteristics of cloud particles (e.g., size distribution, densities). The mi-crophysical parameterization should be tuned to the different types of precipitation regimes (i.e., convective vs. stratiform) throughout the life cycle of the simulated event (Lang et al., 2003; Wu et al., 2013). Ground-based instruments such as weather radars and disdrometers can be used to gain insights about the microphysical structure of a precipitating cloud and to derive the parameters required by microphysics schemes.
Lightning information is useful to monitor the evolution of convective events (e.g., Gatlin and Goodman, 2010) as well as to assess the NWP model ability to reproduce their intensity and predict their evolution in time (e.g., Federico et al., 2014). Robust relationships of lightning activity to cloud microphysics and dynamical properties (such as up-draft strength) could be exploited by assimilating lightning data into NWP models to improve the initiation and forecast in both time and space of convective activity (Lynn et al., 2012; Lagouvardos et al., 2013).
Numerous studies have investigated the relationship be-tween lightning and heavy precipitation, and, more specif-ically, between the volume of precipitable water and light-ning flashes (or lightlight-ning strokes), and it was found to de-pend on climatology as well as on geographical location (e.g., Petersen and Rutledge, 1998 and references therein; Lang and Rutledge, 2002; Latham et al., 2004; Albrecht et al., 2011). However, the relationship between total lightning activity and ice mass appears to be more robust (Petersen et al., 2005; hereinafter PE05, Deierling et al., 2008; For-menton et al., 2013, hereinafter FO13). The non-inductive cloud charging mechanism, considered to be the main source
of charges involved in lightning flashes within thunderstorms (Saunders, 1993; Latham et al., 2007), is mainly related to the collisions between ice crystals (positively charged) and grau-pel (typically associated with negative charge in the cloud), suggesting a relation between ice mass and lightning ac-tivity. Several studies over the last decade have shown that dual-polarization (DP) radar measurements may exhibit sig-natures that can be tied to lightning activity (e.g., López and Aubagnac, 1997; Goodman et al., 1989; Carey and Rutledge, 1996, 2000; Wiens et al., 2005; Preston and Fuelberg, 2015). López and Aubagnac (1997) showed that the evolution of lightning activity in an Oklahoma supercell thunderstorm that produced copious amounts of hail was related to the changes in the microphysical characteristics of the storm that were inferred from polarimetric radar measurements. Their results indicate that the development of graupel above the freezing level is related to the overall increase/decrease in the number of cloud-to-ground (CG) flashes. Carey and Rut-ledge (2000) showed that CG lightning flashes were highly correlated with radar-inferred mixed-phase ice mass in time and space. Moiser et al. (2011) used the radar-derived ver-tically integrated ice (VII) to forecast CG lightning and showed that any increase of VII over 0.42 kg m−2 is a suf-ficient amount of precipitation mass for cloud electrification. Contributions concerning quantitative relationships between graupel mass and lightning activity also come from studies based on satellite observations or numerical cloud electrifi-cation models. PE05 used cloud ice microphysical informa-tion obtained from the Precipitainforma-tion Radar onboard the Na-tional Aeronautics and Space Administration (NASA) Trop-ical Rainfall Measuring Mission (TRMM) satellite to find global relationships between ice water content and the light-ning activity observed by the Lightlight-ning Imaging Sensor on-board TRMM. They found a linear relationship on a global scale between columnar precipitation ice mass and lightning flash density regardless of land, ocean, and coastal regimes. FO13, using a 1-D numerical cloud electrification model, found a linear relation between flash rate and a minimum threshold of columnar ice water content of graupel.
Rain at the ground, characterized by its raindrop size dis-tribution (RSD) (i.e., the number concentration of rain drops as a function of their equivolume diameter), is measured by raindrop sampling instruments (disdrometers). RSD can present distinctive properties, allowing rain to be classified as convective or stratiform (e.g., Bringi et al., 2003; Friedrich et al., 2013) and, can be related to lightning activity. The main novelty of this work concerns the study of relationships occurring between lightning activity and different measure-ments characterizing different phases of precipitation (solid and liquid) and as seen using different instruments. In partic-ular, the hypothesis of correlation between graupel mass and flashes is verified.
micro-physical parameters and the cloud electrical activity. The in-vestigation is based on a ground-based lightning sensor net-work, a scanning C-band DP radar, which was installed in the southeastern part of Rome, and a nearby instrumented site (14 km from the C-band radar, in the historic center of Rome) that included a disdrometer. In such a configuration, DP radar is used to estimate the mass of graupel, while RSDs are es-timated from disdrometer observations. Both estimates are analyzed in relation to the number of total lightning strokes detected by the ground-based lightning detection network or to variables inferred from such lightning measurements.
Section 2 presents the instrumentation used and some is-sues related to data quality. In Sect. 3, the techniques em-ployed to retrieve graupel properties and RSD, as well as lightning data processing, are described. The data set and de-tails of selected case studies are given in Sect. 4, while Sect. 5 discusses the important results of the study. Our conclusions can be found in the last section.
2 Instrumentation
Several instruments were made available during the HyMeX SOP1.1 to be deployed in the CI hydrometeorological site thanks to the cooperation amongst the Italian meteorolog-ical services and the scientific community, as well as to the contribution from NASA Global Precipitation Measure-ment (GPM) Ground Validation Program (Ferretti et al., 2014). Instruments selected for this study are the DP C-band radar (Polar 55C) of the National Research Council of Italy, Institute of Atmospheric Science and Climate (CNR-ISAC), and a 2-D video disdrometer (2-DVD), located in the historic center of Rome. Lightning data from the European LIght-ning detection NETwork (LINET; Betz et al., 2009) made available in real time at CNR-ISAC were also used.
LINET provides continuous data for both research and op-erational purposes, with total lightning capability (cloud-to-ground (CG) and intra-cloud (IC) strokes are registered), and low-amplitude reporting capability (signals with currents be-low 5 kA are recorded) utilizing very be-low frequency/be-low fre-quency (VLF/LF) techniques (i.e., 10 frefre-quency intervals be-tween 1 and 200 KHz). More than 120 sensors in over 20 Eu-ropean countries compose the network, with good coverage of the central and western Mediterranean region, from 10◦W to 35◦E in longitude and from 30 to 65◦N in latitude. Fur-ther details and specifications are in Betz et al. (2009). The detection efficiency of ICs and CGs depends on the distance between the stroke event and the LINET sensors, and on the network baseline. In the coastal areas and over the Mediter-ranean basin, the baseline is larger, and weak strokes (IC or CG) may not be detected or properly located (Zinner et al., 2013).
A 2-DVD (compact version) by Joanneum Research mbH, Graz, Austria (Schönhuber et al., 2008), was installed on the roof of the Department of Electrical Engineering and Telecommunications at Sapienza University of Rome
(here-inafter “Sapienza site”, 41.89◦N, 12.49◦E; 70 m a.s.l.). The 2-DVD is an optical disdrometer that provides properties of raindrops such as diameter, fall velocity, and oblateness of each particle falling through a 10×10 cm2 effective mea-surement area (Schönhuber et al., 2008). Drop size and drop velocity measured by the 2-DVD are more accurate across a broad spectrum of drop sizes than similar measurements col-lected by disdrometers employing other measuring principles (Tokay et al., 2013).
Polar 55C is a research-grade C-band (5.6 GHz) DP Doppler radar located on the outskirts of Rome (41.84◦N, 12.65◦E; 130 m a.s.l.) 14 km southeast of the Sapienza site (Sebastianelli et al., 2013). Radar measurements were col-lected using a pulse duration of 0.5 µs (corresponding to a range resolution of 75 m) and a pulse repetition frequency of 1200 Hz. The scanning strategy was configured as follows: (i) a volume scan consisting of unevenly spaced elevation an-gles to obtain a vertical resolution of 1 km above the Sapienza site and eight plan position indicator (PPI) maps (elevation angles in degrees are 0.6, 1.6, 2.6, 4.4, 6.2, 8.3, 11.0, 14.6), (ii) scans at vertical incidence, and (iii) RHIs directed toward the Sapienza site. Tasks (ii) and (iii) were added to the vol-ume scan depending on the presence of precipitation above the Polar 55C and the Sapienza site, respectively. The scan-ning strategy was designed to provide an update every 5 min. During the SOP 1.1, the Polar 55C also performed operator-supervised RHI scans along the route of a research aircraft (the Falcon 20 of Service des avions français instrumentés pour la recherche en environnement) that did not fly over CI during convection. The use of DP radar observations col-lected using an ad hoc scanning strategy allows quantitative graupel mass estimation to be improved, first by detecting the radar sample volume with graupel, and then by estimating the ice water content using specific algorithms. This ability of DP radar and its application to operational forecasting of the precursor microphysical conditions leading to lightning production (short-term flash forecasting), are highlighted by Woodard et al. (2012).
3 Analysis techniques
3.1 Graupel detection and graupel mass estimation from DP radar measurements
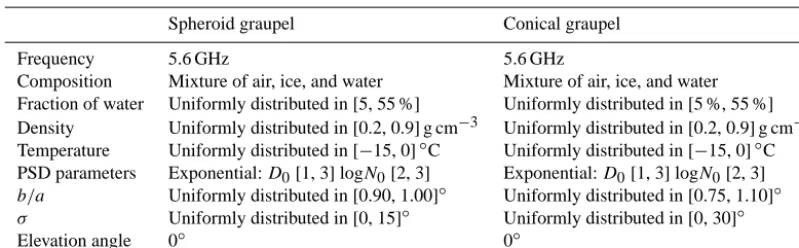
Table 1. Inputs to T-matrix simulations for graupel. Spheroid and conical graupels differ mainly for the axis ratio (b/a) and standard deviation of canting angle (σ ).
Spheroid graupel Conical graupel
Frequency 5.6 GHz 5.6 GHz
Composition Mixture of air, ice, and water Mixture of air, ice, and water Fraction of water Uniformly distributed in [5, 55 %] Uniformly distributed in [5 %, 55 %] Density Uniformly distributed in [0.2, 0.9] g cm−3 Uniformly distributed in [0.2, 0.9] g cm−3 Temperature Uniformly distributed in [−15, 0]◦C Uniformly distributed in [−15, 0]◦C PSD parameters Exponential:D0[1, 3] logN0[2, 3] Exponential:D0[1, 3] logN0[2, 3] b/a Uniformly distributed in [0.90, 1.00]◦ Uniformly distributed in [0.75, 1.10]◦ σ Uniformly distributed in [0, 15]◦ Uniformly distributed in [0, 30]◦
Elevation angle 0◦ 0◦
employed in this study to quantify the mass of graupel em-bedded in the convective cells occurring within 120 km of the radar. First, a Hydrometeor Classification Algorithm (HCA) based on DP radar measurements is employed to identify radar volumes containing graupel. Then, ice water content of graupel for these volumes is estimated from reflectivity fac-tor measurements, utilizing a power law relation. A specific study to optimize the HCA and the graupel mass estimation algorithm was conducted.
3.1.1 HCA optimization for graupel identification A T-matrix method (Barber and Yeh, 1975) was used to study the electromagnetic scattering properties of graupel with two main purposes: (1) to define proper membership functions to identify graupel by means of a fuzzy logic HCA using C-band radar measurements, and (2) to obtain a sim-ple algorithm to retrieve the ice water content of graupel from measured radar reflectivity factor. A broad population of graupel particle size distributions (PSDs) was obtained by randomly varying parameters of an exponential PSD (Chan-drasekar et al., 2003; Dolan and Rutledge, 2009) in the form N (D)=N0exp[−3.67(D/D0)], (1) whereN0(mm−1m−3)is the intercept parameter of the size distribution,Dis the equivalent volume particle diameter (in mm), and D0 is the median volume diameter (in mm). T-matrix simulations were performed for temperatures between
−15 and 0◦C, liquid water fractions between 5 and 55 %, and particle densities between 0.2 and 0.9 g cm−3 (Prup-pacher and Klett, 1978; Dolan and Rutledge, 2009; Dolan et al., 2013). The microphysical parameters used for simu-lations are summarized in Table 1. All these quantities were randomly varied, assuming a uniform distribution in the in-tervals defined in the table to include the heterogeneous characteristics of the different types of graupel. The wide ranges from which microphysical parameters are randomly chosen take into account mechanisms that involved graupel formation and accretion during cloud development and are consistent with graupel microphysics described in literature
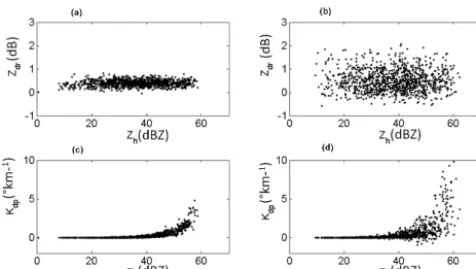
cited above. Some classification algorithms do not distin-guish graupel from small and dense ice hydrometeors, such as small hail (Straka et al., 2000), while others categorize it as either low-density or high-density graupel (Dolan et al., 2013). A wide, single set of graupel microphysics to take into account the different types of graupel including low-density graupel to small hail was used. Graupel can take on differ-ent shapes, primarily hexagonal, lump, spheroidal, and con-ical, which are difficult to identify using polarimetric radar, although some studies showed that the presence of conical shapes can be inferred from differential reflectivity (Evaristo et al., 2013). Therefore, two different simulations were per-formed to model graupel as having either spheroidal or con-ical shape by varying the axis ratio (ratio of semi-minor to semi-major axis) and canting angle. The mathematical for-mulation described by Wang (1982) was used for modeling conically shaped graupel. The fall behavior of graupel, espe-cially its orientation, is not well established, and some inves-tigators have hypothesized that the larger rimed ice particles probably tumble, though conical graupel may have a pref-erential fall orientation (Pruppacher and Klett, 1978), oscil-lating between±20◦ about its vertical axis (Zikmunda and Vali, 1972). Some graupel particles can fall with an axis ratio exceeding 1 (prolate) and other particles with an axis ratio less than 1 (oblate) (Wang, 1982). For conical shapes, we assumed a random uniform distribution between 0.75 and 1.1 for the axis ratio (Heymsfield, 1978), and a zero-mean Gaussian distribution for canting angle, with randomly vary-ing standard deviation between 0 and 30◦. For spheroidal shapes, the canting angle standard deviation varied between 0 and 15◦, and the axis ratio between 0.9 and 1 (Prupac-cher and Klett, 1978; Aydin and Seliga, 1984; Straka et al., 2000; Bringi et al., 1986). Figure 1 shows the output of sim-ulated DP radar observables (obtained from 1000 iterations) for spheroidal (a, c), and conical (b, d) shaped graupel. Ob-serving the four scatter plots,Zh ranges from about 10 to
Figure 1. Scatter plots of C-band differential reflectivity (a, b) and
specific differential phase shift (c, d) vs. reflectivity factor obtained by T-matrix simulations for graupel. Left panels refer to spheroid graupel simulations (details in second column of Table 1), while right panels refer to conical graupel simulations (third column of Table 1).
values also exhibited larger variation for the conical shapes (Fig. 1c and d).
The results of T-matrix simulations were used to define proper beta membership functions of a fuzzy logic (FL) HCA (Liu and Chandrasekar, 2000; Lim et al., 2005) tailored for C-band and graupel detection. Inputs of the FL classifica-tor are the Polar 55C radar measurements of Zh,Zdr, and Kdp, the standard deviation of the differential propagation phase shift (φdp)(calculated in a 375 m range moving win-dow, i.e., five 75 m range bins), and the height of the top of the melting layer (ML). The height of the top of ML is con-sidered to be the 0◦C level from vertical temperature sound-ings collected at the nearby (20 km south of Rome) Pratica di Mare airport (whose ICAO code is LIRE and where radio soundings are routinely collected at 00:00 and 12:00 UTC). Measurements ofZhandZdr were corrected for attenuation by utilizing linear relations between specific attenuation at horizontal polarization, specific differential attenuation, and Kdp (parameterizations used can be found in Baldini et al., 2014) that were applied to propagation paths below the 0◦C level. For each radar measurement bin, the FL scheme as-signs a score to each radar measurement. These scores are obtained by considering how the radar measurements fit the set of membership functions for a given hydrometeor class. The hydrometeor class with the highest score is assigned to each radar resolution volume. The results of the simulations of Fig. 1 have been used to tune the membership functions for graupel. Those of Zdr andKdp were set to account for both spheroidal and conical shaped graupel by allowingZdr to vary between −1 and 2 dB andKdp to vary between−2 and 10◦−1 similarly to Dolan et al. (2013) and Evaristo et al. (2013). Table 2 lists the parameters of the membership functions for the planesZh−ZdrandZh−Kdpin compari-son with those used in Baldini et al. (2005).
3.1.2 Graupel IWC estimation
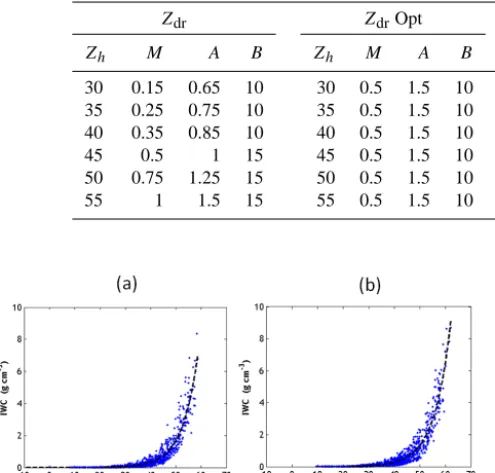
The second important implication of the T-matrix simula-tion results concerns the estimasimula-tion of graupel ice water con-tent (IWC). The IWC of graupel (hereinafter IWCg)was fit-ted to the simulafit-tedZh(shown in Fig. 2 for spheroidal and
conical shapes of graupel) by means of a power law relation of the form
IWCg=aZhb, (2)
wherea=4.64×10⁻⁴,b=7.12×10⁻¹for spheroid grau-pel anda=4.70×10⁻⁴,b=6.89×10⁻¹for conical grau-pel; IWCg is in g cm−3 and Zh is in mm6m−3. To assess
the uncertainty of (2) we considered the normalized stan-dard error (NSE) between the simulated IWCgobtained from (1) and the one estimated by (2). The NSE was 0.553 for speroidal and 0.523 for conical shapes, respectively. The nor-malized bias was 0.012 for spheroidal and 0.005 for conical shapes, indicating that (2) is unbiased. Since the coefficients of (2) for the two shapes of graupel were very similar, we simply used those found for spheroidal graupel. When ap-plied to conical graupel, the NSE changed by less than 6 %. 3.1.3 Radar data processing
The basic steps listed below are applied to radar data ac-quired during the events considered in this study:
– selection of volumes with eight complete PPIs and total LINET strokes (both CG and IC) detected within the 5 min of each radar volume scan in the 120 km radius radar coverage area
– estimation of 0◦C level using vertical profiling of LIRE soundings for each day
– estimation ofKdp from 8dp using the finite difference method (Bringi and Chandrasekar, 2001)
– attenuation correction forZhandZdr using linear rela-tion ofKdpwith specific attenuation and specific linear attenuation
– resampling of the polarimetric measurements to obtain a 1200 m resolution in range (i.e., 16 range bins) – detection of graupel using the C-band radar FL HCA
optimized for graupel
Table 2. Parameters of betaZh−ZdrandZh−Kdpmembership functions (Liu and Chandrasekar, 2000) for C-band and graupel identification (Ais half-width,Mis the center, andBis the slope of the beta functions). Columns denoted by “Opt” refer to the functions of the modified HCA scheme optimized for graupel identification.
Zdr ZdrOpt Kdp KdpOpt
Zh M A B Zh M A B Zh M A B Zh M A B
30 0.15 0.65 10 30 0.5 1.5 10 30 −0.15 0.35 10 30 2.5 1.5 10 35 0.25 0.75 10 35 0.5 1.5 10 35 −0.1 0.4 10 35 2.5 2.5 10 40 0.35 0.85 10 40 0.5 1.5 10 40 0.05 0.55 10 40 2.5 3.5 10
45 0.5 1 15 45 0.5 1.5 10 45 0.5 1 15 45 2.5 4.5 10
50 0.75 1.25 15 50 0.5 1.5 10 50 0.75 1.25 15 50 2.5 5.5 10
55 1 1.5 15 55 0.5 1.5 10 55 1 1.5 15 55 2.5 6.5 10
Figure 2. Scatter plots of C-band radar reflectivity and IWCg. The left panel refers to spheroidal shape and the right panel to conical shape of graupel. Exponential fits (Eq. 2) are shown by black dashed curves.
– estimation of IWCgonly performed beyond 25 km from the Polar 55C radar to detect cells above the ML and to avoid underestimation due to the cone of silence in the vicinity of the radar; calculation of the total amount of graupel (TAG, in kg) by summing all the columnar IWCg, each one multiplied by the area at the base of each column.
3.2 2-D video disdrometer processing
The 2-DVD data were filtered to remove spurious drops due to splashing or wind effects (Tokay et al., 2001). This re-sulted in removing 14 % of the 2.2×10⁶drops collected dur-ing SOP1.1. Then, the observed diameters were partitioned into 50 bins with a constant width of 0.2 mm. Ten drops in each 1 min spectra were requested to classify a spectrum as rain. A total of 4761 1 min RSDs were obtained.
Techniques for partitioning rain into stratiform or convec-tive from point-wise disdrometer measurements collected at the ground may be based on properties of rain rate time se-ries, such as intensity and time variability (e.g., Bringi et al., 2003; Marzano et al., 2010) or those based on RSD param-eters (e.g., Bringi et al., 2009). In this study, the technique of Bringi et al. (2009), which classified rain minutes into convective, stratiform, and transition classes, was
reformu-lated to apply it to both radar measurements and disdrometer data. The latter was converted into DP radar measurements via T-matrix scattering computations. Simulations were per-formed for rain with the following assumptions: temperature of 20◦C, the shape-size model of Beard and Chuang (1987), and zero-mean Gaussian canting angle distribution with a standard deviation of 7.5◦. The 1 min RSDs were classified as stratiform or convective using the criteria of Bringi et al. (2009) based onNw(i.e., the normalized intercept
param-eter) andD0. The representation of the corresponding radar measurements at a specific frequency in the 2-D space de-fined byZh andZdr leads to the identification of different precipitation regimes. Measurements collected by 2-DVD from 12 September to 12 November 2012 were analyzed at different frequencies (not shown). For C-band a threshold has been identified partitioning theZh−Zdrplane into stratiform and convective regions (herein afterC/Sthreshold) as
Zh=36.86+0.84Zdr, (3)
whereZdris in dB andZhin dBZ. The results of the
classi-fication and their relation with other measurements available are presented and discussed in Sect. 5.2.
4 Data set description
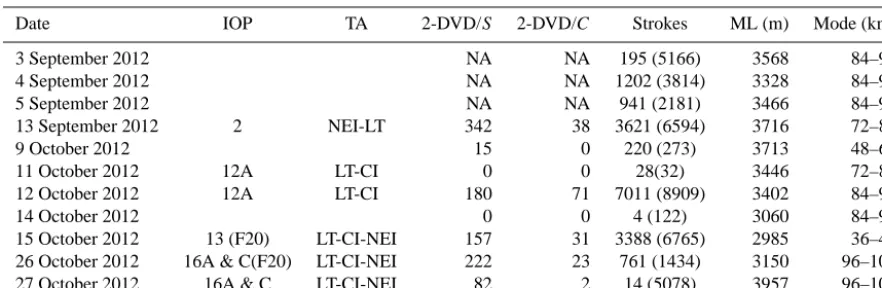
Table 3. Dates for which both radar and LINET data are simultaneously available. Second and third columns: HyMeX SOP 1.1 IOP number
(with availability of the F20 flights), and the target area (TA) involved in the IOP. Fourth and fifth columns: stratiform (S) and convective (C) minutes measured by 2-DVD over the Sapienza site. Sixth column: number of LINET strokes that occurred during Polar 55 C observations and (in parentheses) the number of strokes in 24 h. Seventh column: 0◦C level height (in meters). Last column: mode of the distance to the radar of the peak of IWCg. NA represents data that are not available.
Date IOP TA 2-DVD/S 2-DVD/C Strokes ML (m) Mode (km)
3 September 2012 NA NA 195 (5166) 3568 84–96
4 September 2012 NA NA 1202 (3814) 3328 84–96
5 September 2012 NA NA 941 (2181) 3466 84–96
13 September 2012 2 NEI-LT 342 38 3621 (6594) 3716 72–84
9 October 2012 15 0 220 (273) 3713 48–60
11 October 2012 12A LT-CI 0 0 28(32) 3446 72–84
12 October 2012 12A LT-CI 180 71 7011 (8909) 3402 84–96
14 October 2012 0 0 4 (122) 3060 84–96
15 October 2012 13 (F20) LT-CI-NEI 157 31 3388 (6765) 2985 36–48 26 October 2012 16A & C(F20) LT-CI-NEI 222 23 761 (1434) 3150 96–108 27 October 2012 16A & C LT-CI-NEI 82 2 14 (5078) 3957 96–108
October, respectively (Table 3). These three events, associ-ated with three IOPs with the most intense precipitation, are described and analyzed in detail.
4.1 13 September 2012 case study
This case occurred during the IOP2 (12–13 September 2012) that mainly involved NEI and LT sites, while intense precipi-tation also occurred in CI. During the morning of 12 Septem-ber, a cold front extending from northern Germany to the northern Alps occurred, with an associated trough moving toward Italy, and then evolving into a cut-off low between Corsica and CI in the afternoon of 13 September. Concern-ing central southern Italy, most of the rainfall activity was located in the Naples area, while scattered deep convection occurred over the CI site.
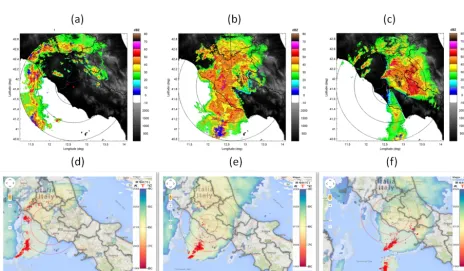
Radar data collected by the Polar 55C radar during the event were used to monitor the evolution of the convective activity. Figure 3a–c show PPIs of horizontal equivalent re-flectivity factor collected by the Polar 55C at 1.6◦elevation angle during three phases of the precipitation event on 13 September 2012. A maximum radar range of 120 km was used. LINET strokes are superimposed on radar observation. At 20:00 UTC the initial stage of a convective cell (a high reflectivity area with few strokes superimposed) can be ob-served 80 km south of Polar 55C. One hour later, this cell developed and covered a larger high reflectivity area, with 30 strokes superimposed, while at 22:30 UTC, this cell splits into a number of cells covering a wide area, moving south-ward, away from the radar. Coincident Meteosat Second Generation (MSG) SEVIRI infrared (IR) images at 10.8 µm, providing the whole view of the system beyond the radar range, are shown in Fig. 3d–f with the LINET strokes super-imposed. The intense convective system developed over the Tyrrhenian Sea, moved, and extended eastward, entering the
Polar 55C radar range after 20:00 UTC. The MSG 10.8 µm brightness temperatures associated with the strokes are be-low−50 ◦C indicating a cloud top height of around 10 km .
4.2 12 October 2012 case study
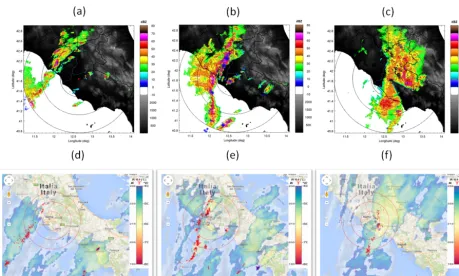
This event, associated with a secondary trough over the cen-tral Mediterranean Sea, occurred during IOP12a and carried heavy precipitation over the CI site, mainly Lazio and Um-bria regions, on 11–12 October 2012. This event started over the Tyrrhenian Sea, where several MCSs (mesoscale con-vective systems) developed during the night of 11 October. Convective systems reached central Italy in the early morn-ing of 12 October, with heavy precipitation over the north-ern part of Lazio and Umbria regions. Rain was not persis-tent, but the maximum cumulated rainfall registered in CI exceeded 150 mm in 6 h. This event mostly occurred outside of the Polar 55C radar coverage as shown in the MSG IR images (Fig. 4d–f). At 04:30 UTC the most intense portion of the system, where LINET strokes were detected, was over the Tyrrhenian Sea, to the southwest of the radar. Polar 55C (Fig. 4a–c) was able to observe only part of the MCS and beyond 80 km distance. One hour and 30 min later, the MCS moved to the south and farther away from the radar (100 km). 4.3 15 October 2012 case study
Figure 3. Polar 55CZh(1.6◦of elevation angle) at 20:00 UTC (a), 21:00 UTC (b), and 22:30 UTC (c) on 13 September 2012. The strokes registered in 5 min are superimposed (blue cross). In (d–f) panels, the corresponding infrared (IR) MSG images at 10.8 µm are shown with the LINET strokes that occurred in 15 min (CG in red dots; IC in blue dots) and Polar 55C range rings at 40, 80, and 120 km (d–f panels were generated using the MAMS tool developed at ISAC-CNR, Petracca et al., 2013).
Figure 5. As in Fig. 3 for the 15 October 2012 at 16:00 UTC (a, d), 17:30 UTC (b, e), and 19:10 UTC (c, f).
system eastward, and advected moist air from the Tyrrhenian Sea inland to fuel deep convection on the Tyrrhenian coast, west of Rome. The synoptic-scale system moved rapidly to the east and triggered a line of convection that crossed the western half of central Italy from north to south within a few hours (see also Federico et al., 2014). Most of the precip-itation produced by this system occurred in the late after-noon of 15 October across the western part of CI and on the western slopes of the Apennines. The total rainfall amount recorded in Rome was weaker than predicted – the highest daily amount recorded within the historic area of Rome was 35 mm by the operational rain gauge in Eleniano (close to the Sapienza site). A maximum rainfall rate of 124 mm h−1 was recorded by the Sapienza 2-DVD at 18:09 UTC. Three phases of the precipitation event are shown by the PPIs ofZh
in Fig. 5a–c. At 16:00 UTC a few convective cells were de-tected by Polar 55C in the northwest sector (Fig. 5a), while the lightning activity within the radar coverage area was low (14 strokes detected by LINET in 5 min within the radar cov-erage circular area of 120 km radius). By 17:30 UTC, a line of convective cells with radar reflectivity above 50 dBZ had developed and the lightning activity became more intense (Fig. 5b). LINET detected 227 strokes in 5 min within the radar coverage area, mostly co-located with the higher radar reflectivity areas (Fig. 5b). The convective activity weakened after 19:00 UTC (Fig. 5c), and most of the precipitation de-tected by the radar exhibited stratiform characteristics, espe-cially over Rome, with drastically weakened lightning
activ-ity (37 strokes were recorded in 5 min over the radar cov-erage area). MSG IR images with LINET strokes superim-posed (Fig. 5d–f) confirm that the most intense portion of the line of convection occurred within the radar coverage area.
5 Results
5.1 Dual-polarization radar analysis and lightning activity
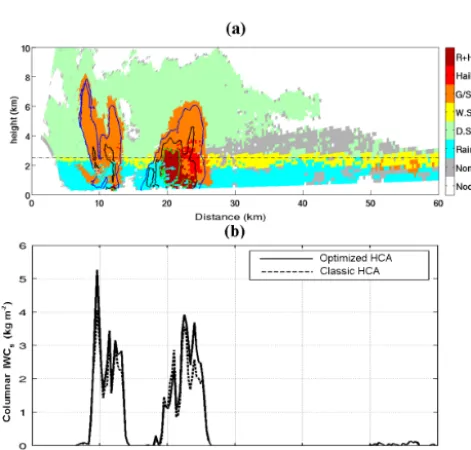
The RHIs collected by Polar 55C along the azimuth of the Sapienza site (293◦) during the intense precipitation phases enabled us to test the FL-based HCA results and the IWCg estimation. An example of the classification output from the RHI performed on 15 October 2012 at 17:55 UTC is shown in Fig. 6a. Radar measurements were resampled, averaging four consecutive range bins to a range resolution of 300 m. The hydrometeor classes identified by the HCA are rain, dry snow, wet snow, graupel and small hail, hail, and a mix of rain and hail. Two intense convective cells were present around 12 and 25 km from the radar in the vicinity of Rome at 17:55 UTC. The closest one was characterized by the pres-ence of graupel from the ground to a height of 8 km, while the second one was characterized by graupel (up to 6 km), as well as hail, and hail mixed with other hydrometeors, also in proximity of the surface. These cells mostly hadZh values
ob-Table 4. Coefficients for the linear regression (y=ax+b)and coefficient of determination (R2)obtained for the three case studies shown in Fig. 8. The first three parameters concern the TAG obtained from the new scheme of HCA, while the next three parameters from TAG are obtained by the former HCA.
Date a b R2 a b R2
13 September 2012 1.63×10⁶ 2.86×10⁶ 0.506 1.75×10⁶ 3.71×10⁶ 0.478 12 October 2012 1.23×10⁶ 1.03×10⁷ 0.824 1.82×10⁶ 2.68×10⁷ 0.807 15 October 2012 5.77×10⁶ 2.71×10⁷ 0.856 6.31×10⁶ 3.66×10⁷ 0.850
Figure 6. Polar 55C RHI scan collected at 17:55 UTC on 15
Octo-ber 2012 for the azimuth at 293◦along the Sapienza site with resam-pled radar measurements at a 300 m range resolution. (a) FL HCA optimized for graupel, with the color bar as follows: white denotes no data, gray denotes data that are not classified, light blue denotes rain, green denotes dry snow, yellow denotes wet snow, orange de-notes graupel and small hail, red dede-notes hail, and dark red dede-notes a hail/rain mix. TheZhcontours at 40 dBZ (blue solid line), 50 dBZ (black solid line), and 55 dBZ (green solid line) are superimposed. The black dashed-dotted line shows the 0◦C level. (b) Columnar IWCgcorresponding to the RHI obtained from the HCA optimized for graupel (black solid line) and from the classical HCA (black dashed line).
tained using the scheme presented in Baldini et al. (2005), the new scheme adds 8 % of pixels classified as graupel. Fig-ure 6b shows the columnar IWCg(in kg m−2)for each range bin for the two classification schemes. The new scheme esti-mates from 2 to 10 % more columnar IWCg, along the range distance. At this time (within 2 min around the RHI scan) LINET detected 18 strokes within a 10 km radius of the peaks of the columnar IWCg. Although the RHI scanning mode provides better vertical resolution than PPI volume scans, the RHI measurements cover a very narrow azimuthal slice (i.e.,
only the 1◦beam width), which makes it difficult to relate the estimated graupel mass content to the lightning occur-ring across a wider horizontal area. Therefore, volume scans processed as described in Sect. 3.1.3 were used to consider the entire 120 km radar coverage area and to have data every 5 min.
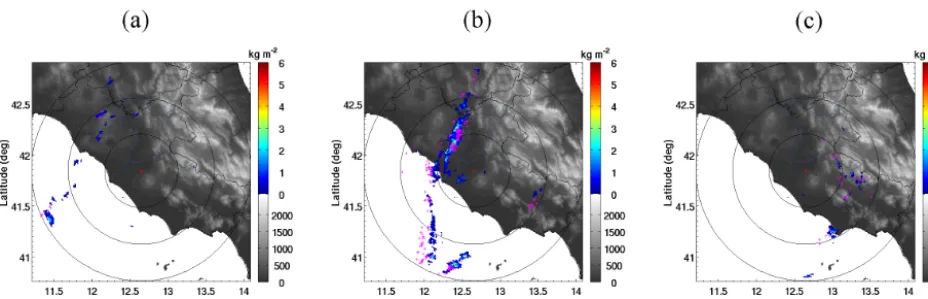
To investigate the relationship between the graupel mass and lightning activity, the columnar IWCgwas calculated for nearly the entire radar coverage area and compared with the number of strokes (CG and IC) detected by the LINET. Fig-ure 7 shows an example of columnar IWCgin three PPI scans of 15 October. We found the relative peaks in lightning ac-tivity tended to follow peaks in columnar IWCg. Figure 7a shows that columnar IWCgwas less than 3 kg m−2during the initial stage of the event at 16:00 UTC when only a few coin-cident strokes were detected, indicating early convective de-velopment in the radar coverage area. At 17:30 UTC (Fig. 7b) the line of cells oriented northeast to southwest were charac-terized by high values of columnar IWCg (up to 5 kg m−2) and a high number of lightning strokes overlapping quite well with the line of convective cells. Figure 7c shows the colum-nar IWCgat 19:20 UTC, when convection had weakened (in the northwestern part of Rome). Just a few strokes and low columnar IWCgwere found southeast of Rome.
Figure 7. The columnar IWCgestimated from Polar 55C at 16:00 UTC (a), 17:30 UTC (b), and 19:20 UTC (c) on the 15 October 2012. Strokes detected by LINET network are represented by the magenta crosses.
characteristics). Strokes recorded in 1 km2within 0.2 s were grouped into one flash. Furthermore, we have calculated a mean value of the columnar IWCg for each radar volume
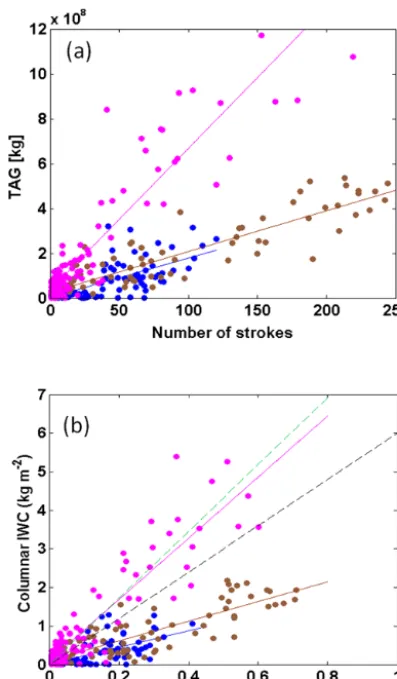
(computed every 5 min), dividing the TAG by the mean total area covered by graupel (in km2). This quantity was related to the flash number density (number of flashes km−2 regis-tered in 5 min) and the results for the three case studies are shown in Fig. 8b. The different behavior for 15 October and the other two cases found in Fig. 8a is still evident. The min-imum threshold linear function of FO13 and the linear func-tion found by PE05 over land (properly converted to match the units used for this plots) are also shown. The data of the 15 October case (and its best fit) are in agreement with the PE05 linear relation (obtained by TRMM measurements) and are (for the most part) above the columnar IWCgminimum threshold found by FO13 for lightning occurrence. However, for the 13 September and 12 October, the linear functions have a lower slope; i.e., for these two cases, the columnar IWCgassociated with a given flash number density is lower than FO13 model or TRMM observations. Different causes could contribute to this result and can be related to (i) radar measurement geometry and to (ii) the nature of the convec-tive event.
Concerning (i), the radar measurements for the three events show that the areas of intense precipitation, where graupel is detected, are at different distances from the Po-lar 55C. On 13 September and 12 October, PoPo-lar 55C ob-serves the edge of the MCS’s core located over the Tyrrhe-nian Sea (see Figs. 3 and 4). The areas with most intense precipitation (and LINET strokes) were mostly farther than 80 km (the mode of the distance of the maximum colum-nar IWCgwas located over 70 km from the radar, as shown in the last column of Table 3). At such distance, the radar beam becomes very wide (1◦of beamwidth corresponds to a sample volume of about 1.8 km height at 80 km), imply-ing that backscatterimply-ing is generated by larger volumes more likely filled by different types of hydrometeors, and
induc-ing possible miss-detection of graupel by the FL HCA. An-other source of underestimation of IWCgby radar can be at-tributed at the different height of the 0◦C isothermal (freez-ing level) estimated by radiosound(freez-ing. For the 15 October 2012 it was estimated at about 2.9 km, while for the other two cases it was above 3.4 km (Table 3). Since the IWCgis cal-culated for the radar beams above the 0◦C level, the higher the freezing level is, the lower the depth of the column con-sidered for the IWCg computation is. In order to quantify such an effect on the graupel mass estimation we have per-formed some simulations, considering a homogeneous 6 km graupel column (from the ground) and using different freez-ing level heights. The columnar IWCg can be reduced up
Figure 8. (a) The total number of strokes detected (in 5 min) by
LINET in the Polar 55C coverage area in relation to TAG (com-puted every 5 min) on 13 September 2012 (blue), 12 October 2012 (brown), and 15 October 2012 (magenta); (b) flash density in rela-tion to the mean columnar IWCg(each computed every 5 min for the same days). All points for each day are fitted with linear regres-sion (solid line). In (b) the black dashed line is the threshold found by FO13 and the green dashed line is the linear relation found by PE05 over land.
solely use TAG to fully explain the differences in the total number of strokes amongst the three case studies. Consid-ering the flux hypothesis (Blyth et al., 2001; Latham et al., 2004), we can say that the differences in TAG for a similar total number of strokes detected by LINET (Fig. 8a) sug-gest that there were differences in the updraft characteristics between the two type of events. For the 15 October event (magenta dots in Fig. 8a) with the highest amount of grau-pel, the updraft does not need be as strong/large through the charging zone (i.e., −5 < T <−30◦C) to produce observed lightning activity similar to the other events. For the 12 Oc-tober (or 13 September) event, with a lower amount of grau-pel, a stronger/larger updraft through the charging zone was required to produce similar lightning activity as 15 Octo-ber. However, measurements of the updraft at altitudes above
Table 5. Number of occurrences (from 16:00 to 20:25 UTC on
15 October) of the different kind of LINET strokes (second col-umn), andR2of the linear correlation between strokes and the total amount of IWCg.
Strokes Occurrence R2
−CG 1834 0.73
+CG 732 0.66
IC 518 0.48
Total 3084 0.86
−5◦C (not available from ground instruments deployed dur-ing SOP1.1 in CI) would be required to validate such conclu-sions.
Although different regimes were found in the relation be-tween TAG and the number of strokes (or columnar IWCg and flash number density), the rather good linear fit confirms the linear relations found in other studies. In particular, the relation for the case of 15 October is in good agreement with both TRMM measurements and model results, supporting the hypothesis that measurements for this case were taken in optimal conditions with respect to the radar geometry of acquisition.
fol-Figure 9. The time evolution of TAG (black stars andyaxis on the left side) and the−CG stroke counts (solid line andyaxis on the right side) that occurred on 15 October 2012 within the Polar 55C coverage area.
low that of the total mass of graupel, in agreement with the findings of López and Aubagnac (1997).
Some general considerations can be obtained from the re-sults shown: (i) the linear correlation between TAG and the number of strokes (total and −CG) supports the theory for which the amount of graupel aloft, often associated with the negative charge in the clouds (Saunders, 1993), is directly re-lated to the mechanism of lightning production, and (ii) the linear relation between the columnar IWCgand flash num-ber density found using radar observations for the 15 Octo-ber 2012 is in agreement with results obtained by PE05 for TRMM measurements and with the model results obtained by FO13. This important finding could be exploited for ap-plications involving lightning data simulation and/or assimi-lation in NWP models in order to improve the forecast of the convection (Lynn et al., 2012; Federico et al., 2014). 5.2 Multi-sensor analysis over the Sapienza site The 4761 1 min RSDs were classified as stratiform and con-vective using the criterion described in Sect. 3.2 and com-pared with radar measurements observed over the Sapienza site for all the data set. Furthermore, their relation with light-ning activity was assessed. The scatter plotZh−Zdr com-puted for all the 1 min RSD is shown in Fig. 10 (the threshold separating convective from stratiform regimes is plotted as a black solid line). It is worth noting that most stratiform min-utes are below the C/S threshold detected by 2-DVD and some of these (7.5 %) are just above, around the threshold. The Polar 55C radar reflectivities and differential reflectiv-ities (colored stars) measured at a 1.6◦ elevation angle and averaged over four consecutive 75 m range bins above the Sapienza site are also shown in Fig. 10. AC/Sclassification method based on the detection of the melting layer signature corresponding to the standard deviation ofZdr (Baldini and Gorgucci, 2006) was adopted. Six convective minutes are de-tected by Polar 55C and one of these is found just below the C/S threshold. Results confirm that radar classification of
Figure 10. Plot of theZh andZdr obtained from the disdrometer measured RSD through electromagnetic simulation for all the data sets collected by 2-DVD (gray markers). The different gray shades are based on theC/Sclassification of Bringi et al. (2009). TheC/S threshold is shown by Eq. (3). The rainy minutes above theC/S threshold are classified as convective, and the ones below as strat-iform. Colored stars denote the Polar 55C measurements collected over the Sapienza site (elevation 1.6◦) for all the databases classified according to Baldini and Gorgucci (2006).
convective vs. stratiform from Baldini and Gorgucci (2006) is in fairly good agreement with the C/S threshold from Zh−Zdr(Eq. 3).
The RSD averages over the convective minutes of the three cases are shown in Fig. 11. The shape of lines of 13 Septem-ber and the 12 OctoSeptem-ber are very similar, while, concerning the 15 October, the concentration of larger drops (D> 3 mm) is greater than for the other two cases. This different behav-ior highlights the different type of convective precipitation events (actually, this concerns only the portion of the event occurring over Rome). In fact, on 15 October, the event ob-served in Rome was more intense than the other two and was characterized by more intense lightning activity: 156 strokes were detected by LINET in 1 min and within 10 km of the Sapienza site on 15 October, while 43 and 7 strokes were measured on 13 September and 12 October, respectively.
Table 6. Contingency tables between the presence of strokes (St) that occurred over the Sapienza site (within 10 km radius in 1 min) and
convective or stratiform (C/S) minutes recorded by 2-DVD (a), and IWCggreater than 0 g cm−3as estimated by Polar 55C over the Sapienza site (Gr) (b).
(a) (b)
C/Sminutes recorded by 2-DVD IWCggreater than 0 g cm−3
Yes (St) No (St) Yes (St) No (St)
C 20 11 Yes (Gr) 58 12
S 21 134 No (Gr) 6 5
POD FAR ETS POD FAR ETS
0.64 0.51 0.29 0.85 0.25 0.64
Figure 11. RSD averaged over the convective minutes for 13
September 2012 (blue), 12 October 2012 (brown), and 15 October 2012 (magenta).
Figure 12. Time series of the reflectivity factors and the number
of LINET strokes. Circles represent the reflectivity factor computed from the RSD measured by the 2-DVD, while stars represent the values measured by the Polar 55C radar over the Sapienza site. Green markers indicate stratiform rain, while the red markers indi-cate convective rain classified with theC/Sthreshold. Finally, the gray bars are the number of strokes registered in 1 min in a circular area of 10 km radius centered at the Sapienza site (2-DVD position).
one stroke was detected at that time. Before 17:00 UTC there may not have been sufficient graupel aloft to produce light-ning (see also FO13). Between 16:50 and 17:00 UTC, the rain at Sapienza was classified as stratiform, but at that time there were strokes likely associated with the convective cells containing graupel detected by the radar within its coverage area. Furthermore, no graupel was detected by the Polar 55C at the Sapienza site at this time, which agrees with the pres-ence of stratiform rain there. The most intense precipitation was detected between 17:43 and 19:09 UTC, when the most intense lightning activity was registered. Radar reflectivity factor exhibited two peaks during the convective rain, sep-arated by a few minutes classified as stratiform rain around 18:00 UTC (Fig. 12). This trend and theC/S classification agreed with that found from the RHI in Fig. 6a, where two consecutive, intense convective cells spatially separated by a region of uniform hydrometeors (i.e., similar to the bright band present in stratiform precipitation) were detected by the HCA. Lightning activity at the Sapienza site ended by 18:25 UTC, and afterwards, all rain was classified as strati-form.
The relationship between different phases of precipitation (liquid and solid) and the lightning activity over the Sapienza site is found in the contingency tables for all the database (Ta-ble 6). Stratiform events calculated using 2-DVD threshold (Table 6a), and the absence of graupel according to the radar (IWCg=0) (Table 6b), correspond quite well to the absence of LINET strokes. Statistical scores comparing convective minutes with strokes (Table 6a) and the presence of grau-pel with strokes (Table 6b) were calculated. Higher probably of detection (POD) and equitable threat score (ETS) and a lower false alarm rate (FAR) are found in Table 6b compared to Table 6a, indicating that graupel aloft is better related to lightning activity than surface (liquid) precipitation.
6 Summary and conclusions
C-band weather radar, and a 2-D video disdrometer. Measure-ments from the LINET network provided the common frame-work to interpret different signatures of convection detected by the other instruments and to relate them to lightning activ-ity. The disdrometer, installed 14 km away from the DP radar, provided estimates of raindrop size distribution at the ground, whereas data from the scanning DP C-band radar were used to analyze important cloud processes related to convection in a wider region. In particular, radar scans at constant az-imuths and variable elevations (RHIs) were used to detect the vertical fine structure of convective cells with the support of a fuzzy logic hydrometeor classification system, properly tuned for C-band measurements and for graupel detection. Data from volume scanning, regularly repeated every 5 min, have been used to highlight the relationship between light-ning activity (expressed by the number of strokes detected by LINET) and the amount of graupel, whose presence in a radar resolution volume is revealed by the hydrometeor clas-sification algorithm. Using T-matrix simulation results, we formulated a power law relation to obtain graupel IWC from radar reflectivity in order to examine impact of the total mass of graupel on the number of LINET strokes. Among the 11 convective precipitation events that occurred during SOP1.1, three important case studies were analyzed. For these cases, linear relations with different slopes between the total mass of graupel and number of LINET strokes were found. Notice-ably, the linear relation found for the case study on 15 Octo-ber exhibits a high coefficient of determination (R2=0.856) and a slope in agreement with both TRMM measurements and model results. The variability of the slopes found for dif-ferent cases can be related to the characteristics of convec-tion, such as the ice mass and the different strength of up-draft, although the radar measurement geometry might also play a significant role. The fact that these events developed over the sea and far from the radar (farther than 80 km) sug-gests also a possible influence of observation geometry, while the flux hypothesis suggests that there were differences in the updraft characteristics between the events. Further research, beyond the HyMeX SOP 1.1, will be carried out to inves-tigate these aspects. The relationships found can be consid-ered an important step towards quantifying the microphysical mechanisms that play a role in lightning activity.
To assess the impact of lightning activity on the rain-drop size distribution at the ground, we partitioned the 2-DVD measured raindrop spectra into stratiform or convec-tive classes and tested the results against the classification-based polarimetric radar measurements and the number of lightning strokes detected by LINET. Comparison with the classification method based on polarimetric radar measure-ments showed a fairly good agreement, particularly for the detection of the stratiform regime. A large number of strokes were detected by LINET when rain was classified as con-vective. Nevertheless, rain was classified as convective also when only a few strokes were detected, associated with a low amount of graupel aloft as estimated from radar
mea-surements. High performance in terms of statistical and skill scores was obtained for the presence of graupel in relation to the occurrence of LINET strokes. However, lightning activ-ity was not always found when the precipitation regime was classified as convective. In fact, a certain quantity of graupel aloft is needed to produce strokes although characteristics for convective rain may be observed at the ground.
This study is the first one conducted in Italy with the ob-jective of investigating convection from the point of view of lightning detection networks, raindrop size distributions at the ground, and graupel aloft, as estimated by a dual-polarization weather radar. It has confirmed that a correlation exists between graupel and lightning activity. This aspect is very important to improve the modeling of convection, es-pecially as far as the detection of conditions for triggering lightning and/or convection. However, the differences found among the three main cases considered suggest the need of a more extensive and accurate investigation, considering a larger data set of radar/lightning measurements, trying to separate possible effects of errors related to the geometry of the radar observation from those due to graupel retrieval al-gorithms.
Acknowledgements. This research has been carried out as a contribution to the SOP 1 of the HyMeX program. The setup of instruments for HyMeX SOP 1.1 in the CI area was possible thanks to a synergy between Italian institutions (CETEMPS-University of L’Aquila, ISAC-CNR, DIET-Sapienza (CETEMPS-University of Rome, University of Ferrara), NASA-GSFC, and the HyMeX coordination. Authors thanks Angelo Viola, Stefania Argentini, Ilaria Pietroni, and Giampietro Casasanta for providing and processing SODAR data. The authors also acknowledge the NASA GPM mission Ground Validation Program under the direction of Matthew Schwaller and Walter A. Petersen, GPM ground valida-tion and science manager, respectively, for providing instruments and expertise, and Arthur Hou, former GPM project scientist (de-ceased), who promoted the participation of NASA in this campaign.
Edited by: G. Vulpiani
References
Albrecht, R., Morales, C., and Dias, M.: Electrification of pre-cipitating systems over the Amazon: Physical processes of thunderstorm development, J. Geophys. Res., 116, D08209, doi:10.1029/2010JD014756, 2011.
Aydin, K. and Seliga, T. A.: Radar Polarimetric Backscattering Properties of Conical Graupel. J. Atmos. Sci., 41, 1887–1892, 1984.
Baldini, L. and Gorgucci, E.: Identification of the melting layer through dual-polarization radar measurements at vertical inci-dence, J. Atmos. Ocean. Tech., 23, 829–839, 2006.
https://ams.confex.com/ams/pdfpapers/95865.pdf (last access: 8 February 2016), 2005.
Baldini, L., Roberto, N., Gorgucci, E., Fritz, J., and Chandrasekar, V.: Analysis of dual polarization images of precipitating clouds collected by the COSMO SkyMed constellation, Atmos Res., 144, 21–37, doi:10.1016/j.atmosres.2013.05.010, 2014. Barber, P. and Yeh, C.: Scattering of electromagnetic waves by
ar-bitrarily shaped dielectric bodies, Appl. Optics, 14, 2864–2872, 1975.
Beard, K. V. and Chuang, C.: A new model for the equilibrium shapes of raindrops, J. Atmos. Sci., 44, 1509–1524, 1987. Betz, H.-D., Schmidt, K., Laroche, P., Blanche, P., Oettinger, W. P.,
Defer, E., Dziewit, Z., and Konarski, J.: LINET – an international lightning detection network in Europe, Atmos. Res., 91, 564– 573, 2009.
Blyth, A. M., Christian, H. J., Driscoll, K., Gadian, A. M., and Latham J.: Determination of ice precipitation rates and thunder-storm anvil ice contents from satellite observations of lightning, Atmos. Res., 59–60, 217–229, 2001.
Bringi, V. N. and Chandrasekar, V.: Polarimetric Doppler Weather Radar, Cambridge Univ. Press, Cambridge, UK, 2001.
Bringi, V. N., Rasmussen, R. M., and Vivekanandan, J.: Multiparameter radar measurements in Colorado convective storms. Part I. Graupel melting studies, J. Atmos. Sci., 43, 2545–2563, doi:10.1175/1520-0469(1986)043%3C2545:MRMICC%3E2.0.CO;2, 1986. Bringi, V. N., Chandrasekar, V., Hubbert, J., Gorgucci, E., Randeu,
W. L., and Schoenhuber M.: Raindrop size distribution in differ-ent climatic regimes from disdrometer and dual-polarized radar analysis, J. Atmos Sci., 60, 354–365, 2003.
Bringi, V. N., Williams, C. R., Thurai, M., and May, P. T.: Using dual-polarized radar and dual-frequency profiler for DSD charac-terization: a case study from Darwin, Australia. J. Atmos. Ocean. Tech., 26, 2107–2122, 2009.
Carey L. D. and Rutledge, S. A.: A multiparameter radar case study of the microphysical and kinematic evolution of a lightning pro-ducing storm, J. Meteorol. Atmos. Phys., 59, 33–64, 1996. Carey, L. D. and Rutledge, S. A.: The relationship between
precip-itation and lightning in tropical island convection: A C-band po-larimetric radar study: A C-band popo-larimetric radar study, Mon. Weather Rev., 128, 2687–2710, 2000.
Carey, L. D. and Rutledge S. A.: Characteristics of cloud-to-ground lightning in severe and nonsevere storms over the cen-tral United States from 1989–1998, J. Geophys. Res., 108, 4483, doi:10.1029/2002JD002951, 2003.
Chandrasekar, V., Fukatsu, H., and Mubarak, K.: Global mapping of attenuation at Ku- and Ka-band, IEEE T. Geosci. Remote, 41, 2166–2176, 2003.
Cummins, K. L., Murphy M. J., and Tuel, J. V.: Lightning detection methods and meteorological applications, Proc. Of the IV Inter-national Symposium on Military Meteorology, 25–28 September 2000, Malbork, Poland, 2000.
Deierling, W. and Petersen, W. A.: Total lightning activity as an in-dicator of updraft characteristics, J. Geophys. Res., 113, D16210, doi:10.1029/2007JD009598, 2008.
Deierling, W., Petersen, W. A., Latham, J., Ellis, S., and Chris-tian, H. J.: The relationship between lightning activity and ice fluxes in thunderstorms, J. Geophys. Res., 113, D15210, doi:10.1029/2007JD009700, 2008.
Dolan, B. and Rutledge, S. A.: A theory-based hydrometeor iden-tification algorithm for X-band polarimetric radars, J. Atmos. Ocean. Tech., 26, 2071–2088, 2009.
Dolan, B., Rutledge, S. A., Lim, S., Chandrasekar, V., and Thu-rai, M.: A robust C-band hydrometeor identification algorithm and application to a long-term polarimetric radar dataset, J. Appl. Meteorol. Clim., 52, 2162–2186, 2013.
Ducrocq, V., Braud, I., Davolio S., Ferretti R., Flamant C., Jansa A., Kalthoff, N., Richard, E., Taupier-Letage I., Ayral, P.A., Be-lamari, S., Berne, A., Borga, M., Boudevillain B., Bock O., Boichard, J. L., Bouin, M. N., Bousquet, O., Bouvier, C., Chig-giato, J., Cimini, D., Corsmeier, U., Coppola, L., Cocquerez, P., Defer, E., Delanoe, J., Girolamo, P.D., Doerenbecher, A., Drobinski, P., Dufournet, Y., Fourrie, N., Gourley, J.J., Labatut, L., Lambert, D., Le Coz, J., Marzano F.S., Molinie, G., Montani, A., Nord, G., Nuret, M., Ramage, K., Rison, B., Roussot, O., Said, F., Schwarzenboeck, A., Testor, P., Baelen, J.V., Vincendon, B., Aran, M., and Tamayo, J.: HyMeX-SOP 1, the field campaign dedicated to heavy precipitation and flash flooding in the north-western Mediterranean, B. Am. Meteorol. Soc., 95, 1083–1100, 2014.
Evaristo, R., Bals-Elsholz, T. M., Williams, E. R., Smalley, D. J., Donovan, M. F., and Fenn A.: Relationship of grau-pel shape to differential reflectivity: Theory and observa-tions. Proceedings, 93rd Amer. Meteor. Soc. Annual Meet-ing, Austin, TX, USA, Amer. Meteor. Soc., 1–9, 5–10 Jan-uary 2013, available at: https://ams.confex.com/ams/93Annual/ webprogram/Paper214462.html (last access: 8 February 2016), 2013.
Federico, S., Avolio, E., Petracca, M., Panegrossi, G., Sanò, P., Casella, D., and Dietrich, S.: Simulating lightning into the RAMS model: implementation and preliminary results, Nat. Hazards Earth Syst. Sci., 14, 2933–2950, doi:10.5194/nhess-14-2933-2014, 2014.
Ferretti, R., Pichelli, E., Gentile, S., Maiello, I., Cimini, D., Davo-lio, S., Miglietta, M. M., Panegrossi, G., Baldini, L., Pasi, F., Marzano, F. S., Zinzi, A., Mariani, S., Casaioli, M., Bartolini, G., Loglisci, N., Montani, A., Marsigli, C., Manzato, A., Pucillo, A., Ferrario, M. E., Colaiuda, V., and Rotunno, R.: Overview of the first HyMeX Special Observation Period over Italy: observa-tions and model results, Hydrol. Earth Syst. Sci., 18, 1953–1977, doi:10.5194/hess-18-1953-2014, 2014.
Formenton, M., Panegrossi, G., Casella, D., Dietrich, S., Mugnai, A., Sanò, P., Di Paola, F., Betz, H.-D., Price, C., and Yair, Y.: Using a cloud electrification model to study relationships be-tween lightning activity and cloud microphysical structure, Nat. Hazards Earth Syst. Sci., 13, 1085–1104, doi:10.5194/nhess-13-1085-2013, 2013.
Friedrich, K., Kalina, E. A., Masters, F. J., and Lopez, C. R.: Drop-Size distributions in thunderstorms measured by optical disdrom-eters during VORTEX2, Mon. Weather Rev., 141, 1182–1203, 2013.
Gatlin, P. N. and Goodman, S. J.: A total lightning trending algo-rithm to identify severe thunderstorms, J. Atmos. Ocean. Tech., 27, 3–22, 2010.
Heymsfield, A. J.: The characteristics of graupel particles in north-eastern Colorado cumulus congestus clouds, J. Atmos. Sci., 35, 284–295, 1978.
Lagouvardos, K., Kotroni, V., Defer, E., and Bousquet, O.: Study of a heavy precipitation event over southern France, in the frame of HYMEX project: Observational analysis and model re-sults using assimilation of lightning, Atmos. Res., 134, 45–55, doi:10.1016/j.atmosres.2013.07.003, 2013.
Lang, S., Tao, W.-K., Simpson, J., and Ferrier, B.: Modeling of convective-stratiform precipitation processes: Sensitivity to par-titioning methods, J. Appl. Meteorol., 42, 505–527, 2003. Lang T. J. and Rutledge S. A.: Relationships between convective
storm kinematics, precipitation, and lightning, Mon. Weather Rev., 130, 2492–2506, 2002.
Latham, J., Blyth, A. M., Christian Jr., J. H., Deierling, W., and Gadian A. M.: Determination of precipitation rates and yields from lightning measurements, J. Hydrol., 288, 13–19, 2004. Latham, J., Petersen, W. A., Deierling, W., and Christian Jr., H. J.:
Field identification of a unique globally dominant mechanism of thunderstorm electrification, Q. J. Roy. Meteor. Soc., 133, 1453– 1457, 2007.
Lim, S., Chandrasekar, V., and Bringi, V. N.: Hydrometeor clas-sification system using dual-polarization radar measurements: model improvements and in situ verification, IEEE Trans. Geosci. Remote Sens., 43, 792–801, 2005.
Liu, H. and Chandrasekar, V.: Classification of hydrometeor based on polarimetric radar measurements: Development of fuzzy logic and neuro- fuzzy systems and in situ verification, J. Atmos. Ocean Tech., 17, 140–164, 2000.
López R. E. and Aubagnac J. P.: The lightning activity of a hail-storm as a function of changes in its microphysical characteris-tics inferred from polarimetric radar observations, J. Geophys. Res., 102, 16799–16813, doi:10.1029/97JD00645, 1997. Lynn, B., Yair, Y., Price, C., Kelman, G., and Clark, A. J.:
Predict-ing cloud-to-ground and intracloud lightnPredict-ing in Weather Forecast Models, Weather Forecast., 27, 1470–1488, doi:10.1175/WAF-D-11-00144.1, 2012.
Machado, L. A. T, Silva Dias, M. A. F., Morales, C. A., Fisch, G. F., Vila, D., Albrecht, R., Goodman, S. J., Calheiros, A. J. P., Bis-caro T, Kummerow C., Cohen, J., Fitzjarrald, D., Nascimento, E., Sakamoto, M., Cunningham, C., Chaboureau, J. P., Petersen, W. A., Adams, D., Baldini, L., Angelis, C. F., Sapucci, L. F., Salio P, Barbosa, H. M. J., Landulfo, E., Souza, R.F., Blakeslee, R.J., Bailey, J., Freitas, S., Lima, W. F., and Tokay, A.: The CHUVA Project – how does convection vary across Brazil?, B. Am. Me-teorol. Soc., 95, 1365–1380, 2013.
Marzano F. S., Cimini D., and Montopoli M.: Investigating precip-itation microphysics using ground-based microwave remote sen-sors and disdrometer data, Atmos. Res., 97, 583–600, 2010. Melani, S., Pasi, F., Gozzini, B., and Ortolani, A.: A four year
(2007–2010) analysis of longlasting deep convective systems in the Mediterranean basin, 6th European Conference on Severe Storms 2011, Palma de Mallorca, Spain, Atmos. Res., 123, 151– 166, 2013.
Miglietta, M. M. and Rotunno, R.: Application of theory to ob-served cases of orographically forced convective rainfall, Mon. Weather Rev., 140, 3039–3053, 2012.
Mosier, R. M., Schumacher, C., Orville, R. E., and Carey, L. D: Radar nowcasting of cloud-to-ground lightning over Houston, Texas, Weather Forecast., 26, 199–212, 2011.
Petersen, W. A. and Jensen, M.: The NASA-GPM and DOE-ARM Midlatitude Continental Convective Clouds Experiment (MC3E). The Earth Observer, Vol. 24, Issue 1, Earth Observ-ing System Project Science Office, NASA GSFC, Greenbelt, MD, 12–18, available at: http://eospso.nasa.gov/sites/default/ files/eo_pdfs/Jan_Feb_2012_col_508.pdf (last access: 17 Febru-ary 2016), 2012.
Petersen, W. A. and Rutledge S. A.: On the relationship between cloud-to-ground lightning and convective rainfall, J. Geophys. Res., 103, 14025–14040, 1998.
Petersen, W. A., Christian Jr., H. J., and Rutledge, S. A.: TRMM observations of the global relationship between ice wa-ter content and lightning, Geophys. Res. Lett., 32, L14819, doi:10.1029/2005GL023236, 2005.
Petracca, M., Casella, D., Dietrich, S., Panegrossi, G., and Sanò, P.: Multisensor Atmospheric data Mapping System: a Web-based graphic tool for multisensor observations of atmospheric data and NWP model forecasts, Eumetsat Meteorological Satellite Conference, 16–20 September 2013, Vienna, Austria, 2013. Preston, A. D. and Fuelberg, H. E.: Improving lightning cessation
guidance using polarimetric radar data, Weather Forecast., 30, 308–328, 2015.
Pruppacher H. R. and Klett J. D.: Microphysics of clouds and pre-cipitation, D. Reidel Publishing company, 10–73, 1978. Saunders, C. P. R.: A review of thunderstorm electrification
pro-cesses, J. Appl. Meteorol., 32, 642–655, 1993.
Schönhuber, M., Lammer, G., Randeu, W. L.: The 2-D-video-distrometer. Precipitation: advances in measurement, estimation and prediction, edited by: Michaelides, S., Springer, 3–32, 2008. Sebastianelli, S., Russo, F., Napolitano, F., and Baldini, L.: On precipitation measurements collected by a weather radar and a rain gauge network, Nat. Hazards Earth Syst. Sci., 13, 605–623, doi:10.5194/nhess-13-605-2013, 2013.
Straka, J. M., Zrnic, D. S., and Ryzhkov, A. V.: Bulk Hydrometeor Classification and Quantification Using Polarimetric Radar Data: Sythesis of Relations, J. Appl. Meteorol., 39, 1341–1372, 2000. Tokay, A., Kruger, W., and Krajewski, J.: Comparison of drop size
distribution measurements by impact and optical disdrometers, J. Appl. Meteorol., 40, 2083–2097, 2001.
Tokay, A., Petersen, W. A., Gatlin, P., and Wingo, M.: Compari-son of raindrop size distribution measurements by collocated dis-drometers, J. Atmos. Ocean. Tech., 30, 1672–1690, 2013. Wang, P. K.: Mathematical description of the shape of conical
hy-drometeors, J. Atmos. Sci. 39, 2615–2622, 1982.
Weisman, M. L., Davies, C., Wang, W., Manning, K. W., and Klemp, J. B.: Experiences with 0-36-h explicit convective fore-casts with the WRF-ARW model, Weather Forecast., 23, 407– 437, 2008.
Wiens, K. C., Rutledge, S. A., and Tessendorf, S. A.: The 29 June 2000 supercell observed during STEPS. Part II: Lightning and charge structure, J. Atmos. Sci., 62, 4151–4177, 2005.
Wu, D., Dong, X., Xi, B., Feng, Z., Kennedy, A., Mullendore, G., Gilmore, M., and Tao, W.-K.: Impacts of microphysical scheme on convective and stratiform characteristics in two high precipi-tation squall line events, J. Geophys. Res.-Atmos., 118, 11119– 11135, 2013.
Yair, Y., Shalev, S., Erlich, Z., Agrachov, A., Katz, E., Saaroni, H., Price, C., and Ziv, B.: Lightning flash multiplicity in east-ern Mediterranean thunderstorms, Nat. Hazards Earth Syst. Sci., 14, 165–173, doi:10.5194/nhess-14-165-2014, 2014.
Zikmunda, J. and Vali, G.: Fall patterns and fall velocities of rimed ice crystals, J. Atmos. Sci., 29, 1334–1347, 1972.