www.atmos-meas-tech.net/8/2449/2015/ doi:10.5194/amt-8-2449-2015
© Author(s) 2015. CC Attribution 3.0 License.
The micro-orifice uniform deposit impactor–droplet freezing
technique (MOUDI-DFT) for measuring concentrations of
ice nucleating particles as a function of size: improvements and
initial validation
R. H. Mason1, C. Chou1, C. S. McCluskey2, E. J. T. Levin2, C. L. Schiller3, T. C. J. Hill2, J. A. Huffman4, P. J. DeMott2, and A. K. Bertram1
1Department of Chemistry, University of British Columbia, Vancouver, BC V6T 1Z1, Canada 2Department of Atmospheric Sciences, Colorado State University, Fort Collins, CO 80523, USA 3Air Quality Science Unit, Environment Canada, Vancouver, BC V6C 3S5, Canada
4Department of Chemistry and Biochemistry, University of Denver, Denver, CO 80208, USA Correspondence to: A. K. Bertram ([email protected])
Received: 2 February 2015 – Published in Atmos. Meas. Tech. Discuss.: 27 February 2015 Revised: 12 May 2015 – Accepted: 18 May 2015 – Published: 15 June 2015
Abstract. The micro-orifice uniform deposit impactor– droplet freezing technique (MOUDI-DFT) combines parti-cle collection by inertial impaction (via the MOUDI) and a microscope-based immersion freezing apparatus (the DFT) to measure atmospheric concentrations of ice nucleating par-ticles (INPs) as a function of size and temperature. In the first part of this study we improved upon this recently intro-duced technique. Using optical microscopy, we investigated the non-uniformity of MOUDI aerosol deposits at spatial res-olutions of 1, 0.25 mm, and for some stages when neces-sary 0.10 mm. The results from these measurements show that at a spatial resolution of 1 mm and less, the concentra-tion of particles along the MOUDI aerosol deposits can vary by an order of magnitude or more. Since the total area of a MOUDI aerosol deposit ranges from 425 to 605 mm2and the area analyzed by the DFT is approximately 1.2 mm2, this non-uniformity needs to be taken into account when using the MOUDI-DFT to determine atmospheric concentrations of INPs. Measurements of the non-uniformity of the MOUDI aerosol deposits were used to select positions on the deposits that had relatively small variations in particle concentra-tion and to build substrate holders for the different MOUDI stages. These substrate holders improve reproducibility by holding the substrate in the same location for each measure-ment and ensure that DFT analysis is only performed on sub-strate regions with relatively small variations in particle
con-centration. In addition, the deposit non-uniformity was used to determine correction factors that take the non-uniformity into account when determining atmospheric concentrations of INPs. In the second part of this study, the MOUDI-DFT utilizing the new substrate holders was compared to the con-tinuous flow diffusion chamber (CFDC) technique of Col-orado State University. The intercomparison was done us-ing INP concentrations found by the two instruments durus-ing ambient measurements of continental aerosols. Results from two sampling periods were compared, and the INP concen-trations determined by the two techniques agreed within ex-perimental uncertainty. The agreement observed here is com-mensurate with the level of agreement found in other studies where CFDC results were compared to INP concentrations measured with other methods.
1 Introduction
Hetero-geneous ice nucleation can be divided into four categories (Pruppacher and Klett, 1997; Vali et al., 2014) that are briefly described as follows: deposition nucleation, where ice forms on the surface of the INP directly from the vapor phase without the occurrence of liquid water; condensation freez-ing, where ice forms as water vapor condenses onto the INP; contact freezing, whereby an INP collides with a su-percooled liquid droplet; and immersion freezing, whereby an INP within a supercooled liquid droplet initiates freezing. Possible atmospheric particles that can act as INPs in-clude mineral dust; black carbon; glassy aerosols; and bi-ological particles such as bacteria, lichen, fungal spores, pollen spores, and marine diatoms (for details see reviews by Szyrmer and Zawadzki, 1997; Després et al., 2012; Hoose and Möhler, 2012; Murray et al., 2012, and refer-ences therein). Information on the concentrations and activ-ity of INPs is needed to predict the frequency and properties of mixed-phase and ice clouds in the atmosphere and hence the effect of aerosol particles on climate and precipitation (Lohmann, 2002; Zeng et al., 2009; Storelvmo et al., 2011; Gettelman et al., 2012; Costa et al., 2014).
Over the past several decades there has been a significant effort to develop instrumentation for measuring INP concen-trations in the atmosphere (DeMott et al., 2011). While much of this research has focused on measuring the total concen-tration of INPs in the atmosphere in real time, determining their concentration as a function of size has also been a sub-ject of interest. Knowing the size of INPs may be useful in identifying their source or modeling their transport in the at-mosphere. In addition, size-resolved measurements would be useful to determine if some current techniques for measuring the total concentration of INPs are missing an important frac-tion of the INP populafrac-tion. For example, instruments based on the continuous flow diffusion chamber (CFDC) design of Rogers et al. (2001) limit the size of particles analyzed to those with an aerodynamic diameter≤0.75 µm in some cases (DeMott et al., 2003) and ≤2.4 µm in others (Garcia et al., 2012).
Most approaches to measuring the concentration of INPs as a function of particle size involve particle size selec-tion either by inertial separaselec-tion (Prodi et al., 1980; Rosin-ski et al., 1986, 1987, 1988; BerezinRosin-ski et al., 1988; San-tachiara et al., 2010) or by filtration (Vali, 1966; Langer and Rodgers, 1975), both followed by freezing measurements. These methods have all been limited to freezing temperatures of approximately−25◦C or greater, likely due to significant
background counts at lower temperatures. Furthermore, the separation of aerosol particles by filter pore size provides only limited size resolution. Another approach for determin-ing the size of INPs involves the analysis of ice crystal resid-uals as a function of size using single-particle mass spec-trometry or electron microscopy (Chen et al., 1998; Petzold et al., 1998; Cziczo, 2004; Targino et al., 2006; Richardson et al., 2007; Pratt et al., 2010).
In addition to the approaches mentioned above, Huffman et al. (2013) recently introduced the micro-orifice uniform deposit impactor–droplet freezing technique (MOUDI-DFT) for measuring the concentration of INPs as a function of size. This technique addresses some of the limitations of previous size-resolving instrumentation. A rotating MOUDI (MSP Corp., Shoreview, MN, USA) capable of obtaining 10 size-fractionated samples spanning 0.056–18 µm (Marple et al., 1991) is used for aerosol collection. The ice nucleating properties of collected particles are then determined in the laboratory by a microscope-based droplet freezing technique (the DFT) that is capable of measuring the concentrations of INPs in the immersion mode to a temperature of approx-imately−37◦C (Koop et al., 1998; Chernoff and Bertram, 2010; Haga et al., 2013, 2014; Wheeler et al., 2015), which is roughly the homogeneous freezing temperature of water droplets 100 µm in diameter (Pruppacher and Klett, 1997). The MOUDI-DFT permits measurements at a higher size res-olution and over a wider range of temperatures than most of the size-resolved instrumentation discussed above. As an of-fline technique, the MOUDI-DFT is also suitable for remote measurements where a dedicated operator may not be avail-able to continuously monitor a real-time instrument. Oth-ers have also used an inertial impactor in conjunction with a microscope-based technique to study ice nucleation by aerosol particles (e.g., Knopf et al., 2010, 2014; Wang et al., 2012a, 2012b).
When particles are collected with a rotating MOUDI, the concentration of particles on a collection substrate is not uniform; rather the concentration varies with distance from the center of the aerosol deposit. For example, Maenhaut et al. (1993) analyzed the uniformity of MOUDI samples us-ing particle-induced X-ray emission (PIXE) and showed that particle concentrations on the MOUDI aerosol deposits var-ied by at least 25 % at a spatial resolution of 2 mm. Since a MOUDI aerosol deposit covers an area of 425 to 605 mm2 (depending on the stage) while the area of the MOUDI aerosol deposit analyzed by the DFT and a 5× magnifica-tion objective lens is only 1.2 mm2, non-uniformity can lead to significant uncertainty in atmospheric concentrations of INPs. Huffman et al. (2013) used the non-uniformity results of Maenhaut et al. (1993) to estimate uncertainties in the INP concentrations determined with the MOUDI-DFT. How-ever, the uncertainty was poorly constrained since the non-uniformity was not known at a sufficient spatial resolution, e.g., 0.25–1 mm.
In addition to improving the MOUDI-DFT, for method validation we compare results from the MOUDI-DFT using the new substrate holders with results from a CFDC operated by Colorado State University (CSU) during a measurement campaign at CSU. The CFDC technique is a well-accepted approach for quantifying INP concentrations in the atmo-sphere. When comparing results from the two instruments, only particles collected onto MOUDI stages with an upper range≤2.4 µm are considered to ensure that the particle size ranges measured by the two instruments corresponded. As highlighted by DeMott et al. (2011), intercomparison studies of INP instrumentation are important for finding potential bi-ases or deficiencies present in the methods, relating indepen-dent data sets, and iindepen-dentifying where efforts for instrument improvement should be focused.
2 Experimental
2.1 Micro-orifice uniform deposit impactor (MOUDI) The MOUDI is a standard device for sampling aerosol par-ticles (Chow and Watson, 2007). The version used here (MOUDI II 120R) contains a sample inlet to remove parti-cles greater than 18 µm, 10 collection stages spanning a size range of 0.056–18 µm, and an after-filter to collect any re-maining particles. All reported sizes are the 50 % cutoff aero-dynamic diameter. Each stage contains a nozzle plate that consists of a series of nozzles that direct the sample and an impaction plate upon which substrates are located for col-lecting particles. A detailed description of MOUDI opera-tion can be found in Marple et al. (1991), with corresponding theoretical considerations in Marple and Willeke (1976). In this work, hydrophobic glass cover slips (HR3-215; Hamp-ton Research, Aliso Viejo, CA, USA) were used as the col-lection substrates.
To determine the aerosol deposit non-uniformity, the col-lection substrates were located roughly in the center of the impaction plates and held in place by a small piece of tape running along one edge of the hydrophobic glass cover slip. For the field measurements at CSU, substrate holders were used to position the sampling substrate at a location on the impaction plate where particle concentrations varied by a relatively small amount (see Sect. 2.5 for details on the de-sign of the substrate holders). As the hydrophobic glass cover slips are thicker than the aluminum foils with which the man-ufacturer calibrated the cut point of each stage, spacers were added between the stages to compensate for the reduced noz-zle plate-to-impaction plate distance.
2.2 Droplet freezing technique (DFT)
Particles collected by the MOUDI were analyzed for their ability to act as INPs in the immersion freezing mode. The DFT used here has been employed previously to study im-mersion freezing by biological particles and mineral dust
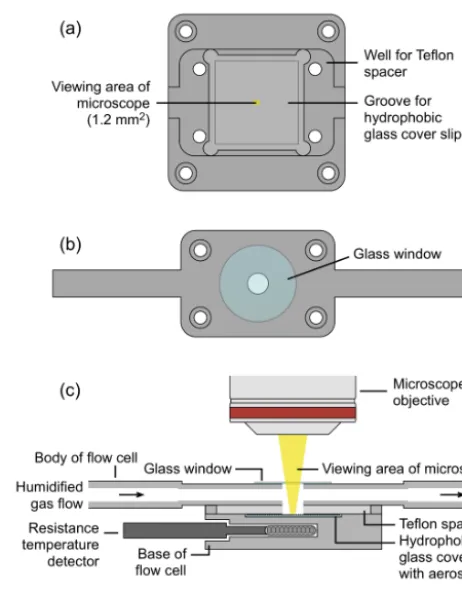
Figure 1. Schematic diagram of the droplet freezing apparatus used
in measurements of INPs: (a) the base of the flow cell with a groove to position the hydrophobic glass cover slip; (b) the body of the flow cell; and (c) the cross section of the flow cell aligned with the optical axis of the microscope.
(Chernoff and Bertram, 2010; Wheeler and Bertram, 2012; Haga et al., 2013, 2014; Wheeler et al., 2015). The technique is based in part on the earlier design of Koop et al. (2000). A flow cell with temperature and humidity control was cou-pled to an optical microscope equipped with a CCD camera as illustrated in Fig. 1.
and the measured offset from the expected 0◦C was used to
correct all freezing temperatures.
The optical microscope used in the experiments was an Axiolab (Zeiss, Oberkochen, Germany) with an EC Plan-Neofluar 5×objective (Zeiss). This resulted in a viewing area in the DFT of 1.2 mm2. Based on the accuracy of the sub-strate holders, the location of the groove in the base of the flow cell, and the alignment of the hydrophobic glass cover slip with the optical axis of the microscope, the center of the microscope viewing area in the DFT experiment was at the center of the hydrophobic glass cover slip±0.5 mm.
In the DFT, a hydrophobic glass cover slip that contained particles collected with the MOUDI was placed on the base of the flow cell, the rest of the components of the flow cell were then assembled, and a video recording of the particles was initiated (Fig. 2a). The center of the flow cell was then aligned with the optical axis of the microscope. Next, the temperature of the flow cell was decreased to 0◦C, and a
hu-midified gas flow with a dew point of approximately 3◦C was passed over the hydrophobic glass cover slip to con-dense water onto the collected particles and grow droplets (Fig. 2b). After reaching a size of approximately 140 µm, the relative humidity (RH) was lowered to partially evapo-rate the droplets and increase the spacing between adjacent droplets (Fig. 2c). The reason for increasing the spacing be-tween droplets is discussed in Sect. 2.3. Upon reaching the desired droplet size, the cell was isolated by closing valves upstream and downstream of the cell. The cell temperature was then lowered at a constant rate of −10◦C min−1 to a temperature of −40◦C. During the condensation, evapora-tion, and cooling processes, a digital video was continuously recorded. The freezing of each droplet was manually iden-tified by an increase in the droplet’s opacity in the digital video (Fig. 2d), and its corresponding freezing temperature was retrieved using the video time stamp.
As there is a stochastic component to immersion freezing (Vali and Stansbury, 1966), the cooling rate used may influ-ence the measured number of ice-active particles at a given temperature. In the DFT, the sample is cooled at a relatively fast rate of−10◦C min−1vs. the−1◦C min−1or slower rate often used in droplet freezing assays. An increase in the cool-ing rate by an order of magnitude can shift the median freez-ing temperature of a sample to colder temperatures by ap-proximately 0.5–2◦C (Murray et al., 2011; Welti et al., 2012; Wright and Petters, 2013; Wright et al., 2013; Wheeler et al., 2015). While this influence has not been explicitly consid-ered when interpreting the results, it is not expected to alter the conclusions of the intercomparison.
2.3 Calculating INP concentrations
The number of INPs active at a given temperature, #INPs(T ), in each freezing experiment was determined using the
fol-Figure 2. Images recorded during a freezing experiment: (a)
col-lected particles sitting on the hydrophobic glass cover slip at room temperature; (b) droplets after the condensation of water at 0◦C; (c) droplets after partial evaporation to reduce their size; and (d) frozen droplets after the cell temperature was reduced to−40◦C over a period of 4 min.
lowing equation based on the method of Vali (1971): #INPs(T )=
−ln
N
u(T ) No
Nofnu,0.25−0.10 mmfne, (1) whereNu(T )is the number of unfrozen droplets at temper-atureT,Nois the total number of droplets,fnu,0.25−0.10 mm is a non-uniformity factor which corrects for aerosol deposit inhomogeneity at a scale of 0.25–0.10 mm (see Sect. 3.4 for details), and fne is a correction factor to account for un-certainty associated with the number of nucleation events in each experiment where fewer frozen droplets result in a greater experimental uncertainty. Equation (1) takes into ac-count the possibility of multiple INPs being contained in a single droplet (Vali, 1971).
The atmospheric concentration of INPs, [INPs(T )], was then found using the following equation:
[INPs(T )]=
#INPs(T )
A
deposit ADFTV
fnu,1 mm, (2)
During an ice nucleation experiment, after a droplet froze it could grow by vapor diffusion at the expense of surround-ing liquid droplets because of the lower saturation vapor pressure over ice compared to liquid water. If given sufficient time, the growing ice crystal can come into contact with a neighboring liquid droplet, causing it to freeze. Alternatively, a neighboring liquid droplet may completely evaporate since it can lose water to the growing ice crystal. These two pro-cesses were accounted for during data analysis by (i) calcu-lating an upper limit to the concentration of INPs active in the immersion mode as a function of temperature by assum-ing that all droplets which underwent the processes discussed above froze by immersion freezing, and by (ii) calculating a lower limit to the INP concentration by assuming that all droplets which underwent the processes discussed above re-mained liquid until the homogeneous freezing temperature of approximately −37◦C (Wheeler et al., 2015). To minimize
the occurrence of these contact and evaporation events in the DFT, which can introduce large uncertainties to the INP con-centration, the spacing between droplets was increased by partial evaporation and a rapid cooling rate of−10◦C min−1 was used (Sect. 2.2).
2.4 Measurements of MOUDI aerosol deposit non-uniformity
For measurements of non-uniformity of the MOUDI aerosol deposits, particle collection was done at Amphitrite Point near Ucluelet, British Columbia, Canada (48.92◦N, 125.54◦W, approximately 20 m a.s.l.) during August of 2013 as part of the larger NETCARE (NETwork on Climate and Aerosols: Addressing key uncertainties in Remote Cana-dian Environments) project. Environment Canada, the British Columbia Ministry of Environment, and Metro Vancouver operate this site for the continuous monitoring of aerosols and trace gases. Four MOUDI samples were collected through a louvered TSP inlet (Mesa Labs Inc., Butler, NJ, USA) and mast extending 5.5 m a.g.l.
In the laboratory, the hydrophobic glass cover slips were mounted on an optical microscope with an XY translational stage (Zeiss LSM). Images were recorded with one of three objective lenses depending on the MOUDI stage: an EC Plan-Neofluar 20× for stages 2–4 (particle sizes of 10– 1.8 µm); an LD Plan-Neofluar 40×for stages 5–6 (particle sizes of 1.8–0.56 µm); and an EC Plan-Neofluar 63× for stages 7–8 (particle sizes of 0.56–0.18 µm). Aerosol deposit non-uniformity was not measured for the inlet or stages 1, 9, and 10 as the inlet and stage 1 contained insufficient parti-cles for quantitative analysis, and individual partiparti-cles could not be identified with the threshold method in stages 9 and 10.
Once the hydrophobic glass cover slips were mounted on the optical microscope, images were taken along a line pass-ing through the center of the MOUDI aerosol deposit. These images were recorded in steps, with the dimensions of the
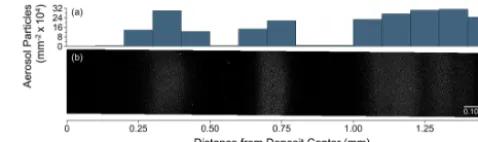
Figure 3. (a) The concentration of aerosol particles on MOUDI
stage 8 as a function of distance from the center of the aerosol de-posit, measured at a spatial resolution of 0.10 mm. (b) A subsection of the continuous cross section of the aerosol deposit of MOUDI stage 8. The images have been background-corrected by subtract-ing the sample image from a particle-free image. Background cor-rection was done to remove spots on the image from dust on the optics. When overlapping individual images to produce the contin-uous image, the individual images do not align perfectly in the ver-tical dimension because moving the hydrophobic glass cover slip in thexdirection using the XY translational stage of the microscope caused slight movement in theydirection
steps dependent on the magnification used to record the im-ages. The dimensions (x length byy length) of these steps were 520 µm×690 µm for stages 2–4, 260 µm×340 µm for stages 5–6, and 170 µm×230 µm for stages 7–8. Images were recorded in such a manner that they could be superim-posed to produce continuous images of the particle concen-tration across the MOUDI aerosol deposits. Shown in Fig. 3 is part of the aerosol deposit of stage 8 as an example of a subsection of a continuous image, where lighter regions show zones where more particle deposition occurred.
2.5 Substrate holders for individual MOUDI stages For each MOUDI stage a substrate holder was constructed to position the hydrophobic glass cover slip in a unique and re-producible position on the MOUDI impaction plate. The lo-cation of the hydrophobic glass cover slip was chosen based on the non-uniformity results such that the region analyzed in the droplet freezing experiment had minimal variation in the particle concentration at the 0.25 mm spatial resolution. Substrate holders were constructed out of 6061-T561, an alu-minum alloy, and had a thickness of 0.41 mm.
2.6 Comparison of MOUDI-DFT and CFDC measurements
For method validation we compared INP concentrations found using the MOUDI-DFT with INP concentrations found using the CFDC operated by CSU during a measure-ment campaign at CSU. Detailed descriptions of the CFDC design and operation can be found in Rogers (1988), Rogers et al. (2001), and Eidhammer et al. (2010). Briefly, air sam-pled by the instrument was first dried and passed through a two-stage impactor to remove large particles. For the exper-iments described here a two-stage impactor with a 50 % cut-off aerodynamic diameter of 2.4 µm (the same for each stage) was used. After the two-stage impactor the sampled air en-tered an annular chamber where the particles were exposed to a specific temperature and supersaturation with respect to water (SSw). Under the conditions used, any ice will quickly grow to sizes between 3 and 10 µm. The sample then entered a region of reduced relative humidity to evaporate any liq-uid droplets that formed but did not contain an INP. At the chamber outlet, ice was discriminated from other particles using an optical particle counter where particles exceeding 3 µm in size were classified as ice.
The measurements for intercomparison involved sampling ambient aerosols at the Department of Atmospheric Sci-ence’s Atmospheric Chemistry building of CSU in Fort Collins, Colorado, USA (40.59◦N, 105.14◦W) over 3 days in November 2013. The MOUDI was located directly out-side the building, while the CFDC was located in an adjacent laboratory (approximately 5 m away) with ambient air drawn through conductive rubber tubing (Simolex, Plymouth, MI, USA). The MOUDI and CFDC were operated simultane-ously to ensure any variations in INP concentrations would be captured by both techniques. The CFDC temperature and SSw were kept constant throughout the sampling period to obtain an average INP concentration for later comparison to the INP concentration obtained offline by the MOUDI-DFT. Two sampling periods from the CSU campaign were cho-sen for comparison purposes (Table 1). An additional sam-pling period was carried out during this campaign, but it was not included because of poor temperature overlap between the CFDC and the DFT. In sample CSU-1 the average CFDC temperature and SSwwith an uncertainty of 1 standard
devia-tion (SD) were−21.7±0.3◦C and 5.5±0.6 %, respectively,
while in CSU-2 the CFDC conditions were−26.6±0.2◦C
and 5.8±0.6 % SSw. MOUDI samples were collected for stages 2–8 (particle sizes of 10–0.18 µm), stored at 4◦C, and analyzed using the DFT within 2 weeks of collection. INP concentrations were not found for samples collected on the inlet and stages 1, 9, and 10 of the MOUDI as we were unable to measure aerosol deposit non-uniformity for these stages (see Sect. 2.4).
DeMott et al. (2015) found that CFDC measurements of natural mineral dust where particles were exposed to an SSw of approximately 5 %, as was used in this study, resulted in an under-prediction of INP concentrations by a factor of 3 when compared to the use of a higher SSw (approximately 9 %). It was therefore suggested that a correction factor of 3 be applied to INP concentrations of mineral dust samples determined by the CFDC when using an SSw of 5 %. More work is needed to determine if INP concentrations are simi-larly underestimated in general ambient aerosol samples such as those of this study, but the potential impact of this factor of 3 on the intercomparison results is discussed in Sect. 3.5.
As mentioned above, the CFDC used here measures INP concentrations for particle sizes ≤2.4 µm. When compar-ing the MOUDI-DFT and CFDC results, we included only MOUDI stages 4–8, covering a size range of 3.2–0.18 µm. In addition, the INP concentrations measured in stage 4 (parti-cle sizes of 1.8–3.2 µm) were multiplied by a factor of 3 / 7, the fraction of the particle size range of stage 4 which over-laps with the size range measured by the CFDC, to ensure the size range covered by the MOUDI-DFT was as close as possible to the size range covered by the CFDC. In all cases the CFDC measured smaller particles than the MOUDI-DFT, which could result in differences between the two instru-ments.
3 Results and discussion
analy-Table 1. CSU sampling conditions.
Sample Sample MOUDI MOUDI size Number of Mean CFDC Mean CFDC Temporal ID composition sampling (min) range (µm) CFDC measurements temperature (◦C) SS∗w(%) overlap (%)
CSU-1 Ambient aerosols 410 0.18–10 66 −21.7±0.3 5.5±0.6 90
CSU-2 Ambient aerosols 256 0.18–10 52 −26.6±0.2 5.8±0.6 98
∗SS
w: supersaturation with respect to water in the sample region of the CFDC.
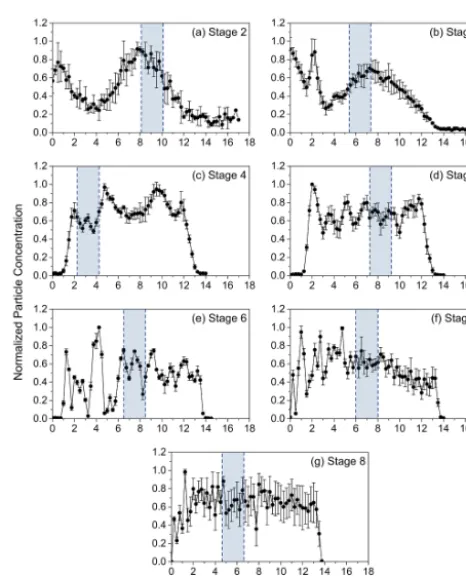
Figure 4. The deposit profiles for MOUDI stages 2–8 found at a
spatial resolution of 1 mm. The normalized particle concentration is the quotient of the particle concentration of a given step divided by the maximum particle concentration. The experimental uncertainty is the standard deviation, and the shaded area is the region of the aerosol deposit in the microscope viewing area of the DFT using the substrate offset given in Table 2 with an uncertainty of±0.5 mm.
sis of Maenhaut et al. (1993) varied by less than an order of magnitude.
To calculate atmospheric concentrations of INPs using Eq. (2), the total area of the MOUDI aerosol deposit is needed. In their instrument paper describing the MOUDI, Marple et al. (1991) state that a surface with a diameter of 27 mm is required for sample collection in stages 2–8, but no other details were provided and some deposits were found to be larger than 27 mm in this study. Aerosol deposit sizes were reported in Maenhaut et al. (1993), but the criteria used to define the deposit edge were not given. Here, the area of each aerosol deposit was determined using the normalized particle concentrations of Fig. 5, where the edge of the
de-Figure 5. The same as Fig. 4 but at a spatial resolution of 0.25 mm.
The shaded area is the region of the aerosol deposit in the micro-scope viewing area of the DFT using the substrate offset given in Table 2 with an uncertainty of±0.5 mm.
posit was defined as the point where the normalized particle concentration transitioned from above to below the detection limit of the technique (the average plus 3 SDs of the nor-malized particle concentration in non-deposit regions of the hydrophobic glass cover slip). Aerosol deposit diameters and areas are reported in Table 2.
3.2 Substrate holder design
im-Table 2. Deposit diameters and areas, hydrophobic glass cover slip offsets, and non-uniformity correction factors fnu,1 mm and fnu,0.25−0.10 mmfor MOUDI stages 2–8 when using substrate holders. The uncertainty infnu,1 mmis given as the standard deviation.
MOUDI Deposit Deposit Hydrophobic glass fnu,1 mmwith fnu,0.25−0.10 mm stage diameter (mm) area (mm2) cover slip offset (mm) uncertainty
2 23.25 424.6 9.13±0.50 0.74,+0.18,−0.12 0.1225 exp(−11.29µ)+1.065 exp(−0.06412µ) 3 26.25 541.2 6.38±0.50 0.72,+0.08,−0.08 0.04718 exp(−14.15µ)+1.023 exp(−0.02347µ) 4 26.25 541.2 3.25±0.50 1.18,+0.09,−0.14 0.04252 exp(−13.06µ)+1.024 exp(−0.02386µ) 5 26.25 541.2 8.25±0.50 0.97,+0.03,−0.10 0.03023 exp(−14.97µ)+1.015 exp(−0.01515µ) 6 27.75 604.8 7.50±0.50 0.75,+0.19,−0.02 0.5799 exp(−10.57µ)+1.148 exp(−0.1408µ) 7 27.25 583.2 7.00±0.50 0.84,+0.07,−0.11 0.1151 exp(−10.66µ)+1.072 exp(−0.07029µ) 8 27.25 583.2 5.63±0.50 1.01,+0.03,−0.12 1.03 exp(−12.79µ)+1.268 exp(−0.2422µ)
µ=Nu(T )/No.Nu(T )is the number of unfrozen droplets at temperatureTin the freezing experiment.Nois the total number of droplets in the freezing experiment.
paction plate of the MOUDI. In addition, each holder had a square piece of the material of the same dimensions as the hydrophobic glass cover slip removed. When the substrate holder was secured onto the impaction plate, this region of re-moved material created a square well where the hydrophobic glass cover slip could be precisely located (see Fig. 7c). The dimensions of the substrate holder were chosen such that the aerosol deposit at the center of the hydrophobic glass cover slip (once the cover slip was located in the substrate holder) had a relatively small variation in particle concentrations at the 0.25 and 0.10 mm spatial resolution. The distances from the center of the hydrophobic glass cover slip to the center of the substrate holder when the hydrophobic glass cover slip is located in the holder, termed the offset, are listed for MOUDI stages 2–8 in Table 2 and are also represented by the shaded regions in Figs. 4–6.
3.3 Correction for aerosol deposit non-uniformity at a spatial resolution of 1 mm
Figure 4 shows that the particle concentrations across the MOUDI aerosol deposits can vary by more than an order of magnitude at a spatial resolution of 1 mm. This variation in particle concentration at the 1 mm scale is taken into ac-count when calculating INP concentrations using the non-uniformity correction factorfnu,1 mm, which was determined using the following equation:
fnu,1 mm= (3)
average particle concentration over the entire aerosol deposit average particle concentration in the microscope viewing area.
Since the substrate holders position the hydrophobic glass cover slips in a known and repeatable position, and the re-gion of the sample analyzed by the DFT is always within 0.5 mm of the center of the hydrophobic glass cover slip due to the design of the flow cell shown in Fig. 1, the correc-tion factor in this case always remains the same for each MOUDI stage. Thefnu,1 mmcorrection factors that are appli-cable when using the substrate holders mentioned above are listed in Table 2. The stated uncertainty infnu,1 mmis due to the uncertainty in the location of the hydrophobic glass cover
Figure 6. The same as Fig. 4 but at a spatial resolution of 0.10 mm.
The shaded area is the region of the aerosol deposit in the micro-scope viewing area of the DFT using the substrate offset given in Table 2 with an uncertainty of±0.5 mm.
slip in both the DFT experiments and sample collection with the MOUDI, and the uncertainties in the normalized particle concentrations shown in Figs. 4 and 5.
3.4 Correction for aerosol deposit non-uniformity at a spatial resolution of 0.25 and 0.10 mm
Figure 7. General substrate holder design specifications for
posi-tioning the hydrophobic glass cover slips in the MOUDI: (a) top-down view of the substrate holder; (b) bottom view; (c) the substrate holder positioned onto the impaction plate of the MOUDI stage.
deposit non-uniformity at the 0.25 and 0.10 mm scale. Equa-tion (1) with fnu,0.25−0.10 mm=1 assumes that the particles are deposited uniformly in the area analyzed in the DFT ex-periments, and the distribution of INPs within the droplets can be described using Poisson statistics. Shown in Fig. 8 is the relationship between the #INPs(T ) and the fraction of droplets unfrozen in the DFT experiment (Nu(T )/No)if these conditions hold (i.e., particles are deposited uniformly in the area analyzed in the DFT experiments and INPs within the droplets can be described using Poisson statistics). The range in droplet number used in Fig. 8, 28 to 56, covers 1 SD from the average number of droplets in a DFT experiment.
Figure 8. The influence of aerosol deposit non-uniformity on the
calculated number of INPs in MOUDI stage 6. (a) and (b) are the #INPs(T )calculated for a non-uniform deposit (solid line) and as-suming a uniform aerosol deposit (dashed line). The calculations were carried out for (a) 28 uniformly distributed droplets and (b) 56 uniformly distributed droplets. (c) and (d) showfnu,0.25−0.10 mm,
calculated by taking the ratio of the solid line to the dashed line in
(a) and (b), respectively.
Figures 5 and 6 show that in experiments using MOUDI samples the particles are not always uniformly deposited in the viewing area of the DFT, even when substrate holders are used. For example, Fig. 6a illustrates that for stage 6 the particle concentration can vary by a factor of 3.4 in the mi-croscope viewing area of the DFT.
δi= (4) average particle concentration in the 0.25 mm wide sectioni average particle concentration in the microscope viewing area, withivarying from 1 to 4. To get the relationship between #INPs(T )andNu(T )/Nofor the entire microscope viewing area, we applied the following equation to each section of the slide to calculate the fraction of droplets unfrozen for each section:
Nu(T )
No
i
=exp
−#INPs δi No
, (5)
again with ivarying from 1 to 4. Equation (5) is based on Eq. (1) but withfnu,0.25−0.10 mmset to 1. (Nu(T )/No)i from each section was then used to calculateNu(T )/Nofor the en-tire microscope viewing area. To determine the relationship between #INPs(T )andNu(T )/Nofor stages 6–8, we applied a similar procedure as described above for stages 2–5, but the microscope viewing area was divided into 10 equal sec-tions with a width of 0.10 mm and the non-uniformity mea-surements shown in Fig. 6 were used to determine δi. The number of sections used to divide the microscope viewing area was selected for each MOUDI stage such that the sec-tion width was smaller than or equal to the spatial scale of uniformity. If fewer (i.e., wider) sections are used, non-uniformity is not sufficiently captured and fnu,0.25−0.10 mm is underestimated. However, using more (i.e., narrower) sec-tions does not changefnu,0.25−0.10 mm.
The results of these calculations for MOUDI stage 6 for different values of #INPs(T ) are shown Fig. 8a and b. Figure 8 shows that, if fnu,0.25−0.10 mm is not applied when calculating #INPs(T ), the #INPs(T ) will be under-predicted, and this under-prediction increases in magnitude asNu(T )/Nodecreases.
To calculate the correction factorfnu,0.25−0.10 mm for use in Eq. (1), the relationship between #INPs(T) andNu(T )/No determined for a non-uniform sample was divided by the re-lationship between #INPs(T )andNu(T )/Nodetermined un-der the assumption of a uniform aerosol deposit. For exam-ple, for stage 6 this involved dividing the solid lines of Fig. 8a and b by the dashed lines. These corrections for stage 6 are plotted in Fig. 8c and d for 28 and 56 droplets in the micro-scope viewing area, respectively. These panels illustrate that the correction factors are a function of Nu(T )/No but are independent of the number of droplets used in the calcula-tion. The above procedure together with the non-uniformity information shown in Figs. 5 and 6 were used to determine the correction factors for the different substrate holders. The fnu,0.25−0.10 mmcorrection factor for each substrate holder is given in Table 2.
3.5 MOUDI-DFT and CFDC intercomparison
INP concentrations found using the MOUDI-DFT were com-pared with those detected in real-time by the CFDC during the CSU measurement campaign. INP concentrations found by the two instruments are shown in Fig. 9. Also included in Fig. 9 are the INP concentrations determined using blank hydrophobic glass cover slips. In this case, new hydrophobic glass cover slips were processed the same way as samples collected during CSU measurements except they were not exposed to atmospheric particles. The blanks illustrate that heterogeneous ice nucleation by the hydrophobic glass cover slip was not observed above−33.7◦C and therefore did not contribute to the measured INP concentrations in CSU sam-ples.
Figure 9 shows that during CSU-1 the average value of the INP concentration obtained by the CFDC was a factor of approximately 3.8 larger than the median value determined with the MOUDI-DFT at a temperature of−21.7◦C. How-ever, the two values are not in disagreement if the uncertain-ties in the measurements are considered. During CSU-2, the median INP concentration of the MOUDI-DFT was a factor of approximately 1.1 larger than the average value from the CFDC at a temperature of−26.6◦C. Again, the two mea-surements are not in disagreement if the uncertainties in the measurements are considered. If we applied a correction fac-tor of 3 to the CFDC data due to this technique underestimat-ing the INP concentration (DeMott et al., 2015), a possibility noted in Sect. 2.6 although not established for our sampling conditions, then the average INP concentration found by the CFDC would be greater than that of the MOUDI-DFT by a factor of 11.5 in sample CSU-1 and 2.6 in sample CSU-2.
Figure 9. Comparison of INP concentrations found by the
MOUDI-DFT and the CFDC under concurrent sampling. The grey shaded region marks the upper and lower bounds to the INP concentra-tion in MOUDI-DFT measurements as defined by our experimen-tal uncertainty, with points showing median values. The uncertainty in temperature for MOUDI-DFT measurements is not shown but is ±0.3◦C. The blue shaded region shows the upper and lower bounds to the INP concentrations found in five blank DFT exper-iments (hydrophobic glass cover slips without atmospheric parti-cles), with points showing median values. Average CFDC values are in red, with uncertainties in the vertical dimension shown as the 95 % confidence interval and in the horizontal dimension as the temperature uncertainty of±1◦C.
INP concentrations could disagree by more than an order of magnitude.
4 Summary
The MOUDI-DFT is a recent approach to measuring concen-trations of INPs as a function of size in the atmosphere. Here we have improved on the technique as presented in Huff-man et al. (2013). First, the non-uniformity of the MOUDI aerosol deposits has been characterized for stages 2–8 using optical microscopy. The results show that the particle con-centrations can vary by more than 2 orders of magnitude across the aerosol deposit. In comparison, the particle
con-centrations measured in the PIXE analysis of Maenhaut et al. (1993) varied by less than an order of magnitude due to the lower spatial resolution used in their experiments. Second, using these non-uniformity measurements, we designed sub-strate holders to position the hydrophobic glass cover slips in a known and reproducible position in the MOUDI that has a relatively uniform concentration profile. Lastly, using the non-uniformity results, correction factors were calculated to improve the accuracy of INP concentrations found using the MOUDI-DFT.
An intercomparison between the MOUDI-DFT and the CFDC was conducted using samples from a campaign mea-suring ambient continental aerosols. Results from this study indicate a reasonable agreement between the two techniques for the limited conditions examined thus far, as INP con-centrations agreed within experimental uncertainty in both of the samples investigated. The agreement observed here is similar to or better than the agreement observed in other in-tercomparison studies of INP instrumentation. This reason-able agreement and consistency with a currently used method suggests that the MOUDI-DFT is a promising technique for measuring INP concentrations as a function of size in the atmosphere, although additional validation experiments are warranted. As different levels of agreement have been ob-served in past intercomparison studies depending on aerosol type (Hiranuma et al., 2015; Wex et al., 2015), additional intercomparison studies are needed with different aerosol types.
Acknowledgements. The authors thank U. Pöschl for support
during some of the initial MOUDI-DFT INP measurements, K. Bach for the construction of the MOUDI substrate holders, S. Kamal for guidance in optical microscopy, and C. Fandrey and F. Romay of MSP Corp. for helpful discussions regarding MOUDI operation and design. The sampling site at Amphitrite Point is jointly supported and maintained by Environment Canada, the British Columbia Ministry of Environment, and Metro Van-couver, and as it is located at a Coast Guard station we would like to thank the Department of Fisheries and Oceans and all the staff at the site for their help. The Natural Sciences and Engineering Research Council of Canada supported this research. CSU participation in these studies was funded by the US National Science Foundation under grants AGS-1036028 and AGS-1358495.
Edited by: J. Schneider
References
Berezinski, N. A., Stepanov, G. V., and Khorguani, V. G.: Ice-forming activity of atmospheric aerosol particles of different sizes, in: Lecture Notes in Physics, Vol. 309, edited by: Wag-ner, P. E. and Vali, G., 709–712, Springer, Heidelberg and Berlin, Germany, 1988.
in the upper troposphere and lower stratosphere, Geophys. Res. Lett., 25, 1391–1394, doi:10.1029/97GL03261, 1998.
Chernoff, D. I. and Bertram, A. K.: Effects of sulfate coatings on the ice nucleation properties of a biological ice nucleus and several types of minerals, J. Geophys. Res., 115, D20205, doi:10.1029/2010JD014254, 2010.
Chow, J. C. and Watson, J. G.: Review of measurement methods and compositions for ultrafine particles, Aerosol Air Qual. Res., 7, 121–173, doi:10.4209/aaqr.2007.05.0029, 2007.
Costa, T. S., Gonçalves, F. L. T., Yamasoe, M. A., Martins, J. A., and Morris, C. E.: Bacterial ice nuclei impact cloud life-time and radiative properties and reduce atmospheric heat loss in the BRAMS simulation model, Environ. Res. Lett., 9, 084020, doi:10.1088/1748-9326/9/8/084020, 2014.
Cziczo, D. J., Murphy, D. M., Hudson, P. K., and Thomson, D. S.: Single particle measurements of the chemical composition of cir-rus ice residue during CRYSTAL-FACE, J. Geophys. Res., 109, D04201, doi:10.1029/2003JD004032, 2004.
DeMott, P. J., Cziczo, D. J., Prenni, A. J., Murphy, D. M., Krei-denweis, S. M., Thomson, D. S., Borys, R., and Rogers, D. C.: Measurements of the concentration and composition of nuclei for cirrus formation, P. Natl. Acad. Sci. USA, 100, 14655–14660, doi:10.1073/pnas.2532677100, 2003.
DeMott, P. J., Möhler, O. P., Stetzer, O., Murakami, M., Bundke, U., Kanji, Z., Cotton, R., Jones, H., Leisner, T., Klein, H., Cz-iczo, D., Petters, M. D., Prenni, A. J., Abbatt, J. P. D., Saito, A., Ardon, K., Levin, Z., Heinz, B., Sierau, B., Nicolet, M., Bow-els, J., Gallavardin, S., Targino, A., Dorsey, J., Georgakopoulos, D., Rzesanke, D., Brinkmann, M., Schwartz, T., Benz, S., Wag-ner, R., Saathoff, H., Ebert, V., other AIDA team, and Vali, G.: The Fourth International Ice Nucleation Workshop (ICIS-2007): Objectives and Preliminary Results, Proceedings of 15th ICCP, Cancun, Mexico, 7–11 July, 2008.
DeMott, P. J., Möhler, O., Stetzer, O., Vali, G., Levin, Z., Pet-ters, M. D., Murakami, M., Leisner, T., Bundke, U., Klein, H., Kanji, Z. A., Cotton, R., Jones, H., Benz, S., Brinkmann, M., Rzesanke, D., Saathoff, H., Nicolet, M., Saito, A., Nil-lius, B., Bingemer, H., Abbatt, J., Ardon, K., Ganor, E., Geor-gakopoulos, D. G., and Saunders, C.: Resurgence in ice nuclei measurement research, B. Am. Meteorol. Soc., 92, 1623–1635, doi:10.1175/2011BAMS3119.1, 2011.
DeMott, P. J., Prenni, A. J., McMeeking, G. R., Sullivan, R. C., Petters, M. D., Tobo, Y., Niemand, M., Möhler, O., Snider, J. R., Wang, Z., and Kreidenweis, S. M.: Integrating laboratory and field data to quantify the immersion freezing ice nucleation activ-ity of mineral dust particles, Atmos. Chem. Phys., 15, 393–409, doi:10.5194/acp-15-393-2015, 2015.
Després, V. R., Huffman, J. A., Burrows, S. M., Hoose, C., Safa-tov, A. S., Buryak, G., Fröhlich-Nowoisky, J., Elbert, W., An-dreae, M. O., Pöschl, U., and Jaenicke, R.: Primary biological aerosol particles in the atmosphere: a review, Tellus B, 64, 15598, doi:10.3402/tellusb.v64i0.15598, 2012.
Eidhammer, T., DeMott, P. J., Prenni, A. J., Petters, M. D., Twohy, C. H., Rogers, D. C., Stith, J., Heymsfield, A., Wang, Z., Pratt, K. A., Prather, K. A., Murphy, S. M., Seinfeld, J. H., Subramanian, R., and Kreidenweis, S. M.: Ice Initiation by Aerosol Particles: Measured and Predicted Ice Nuclei Concentrations versus Mea-sured Ice Crystal Concentrations in an Orographic Wave Cloud,
J. Atmos. Sci., 67, 2417–2436, doi:10.1175/2010JAS3266.1, 2010.
Garcia, E., Hill, T. C. J., Prenni, A. J., DeMott, P. J., Franc, G. D., and Kreidenweis, S. M.: Biogenic ice nuclei in boundary layer air over two U.S. High Plains agricultural regions, J. Geophys. Res., 117, D18209, doi:10.1029/2012JD018343, 2012.
Gettelman, A., Liu, X., Barahona, D., Lohmann, U., and Chen, C.: Climate impacts of ice nucleation, J. Geophys. Res., 117, D20201, doi:10.1029/2012JD017950, 2012.
Haga, D. I., Iannone, R., Wheeler, M. J., Mason, R., Polishchuk, E. A., Fetch Jr., T., van der Kamp, B. J., McKendry, I. G., and Bertram, A. K.: Ice nucleation properties of rust and bunt fungal spores and their transport to high altitudes, where they can cause heterogeneous freezing, J. Geophys. Res.-Atmos., 118, 7260– 7272, doi:10.1002/jgrd.50556, 2013.
Haga, D. I., Burrows, S. M., Iannone, R., Wheeler, M. J., Mason, R. H., Chen, J., Polishchuk, E. A., Pöschl, U., and Bertram, A. K.: Ice nucleation by fungal spores from the classes Agaricomycetes,
Ustilaginomycetes, and Eurotiomycetes, and the effect on the
at-mospheric transport of these spores, Atmos. Chem. Phys., 14, 8611–8630, doi:10.5194/acp-14-8611-2014, 2014.
Hiranuma, N., Augustin-Bauditz, S., Bingemer, H., Budke, C., Cur-tius, J., Danielczok, A., Diehl, K., Dreischmeier, K., Ebert, M., Frank, F., Hoffmann, N., Kandler, K., Kiselev, A., Koop, T., Leis-ner, T., Möhler, O., Nillius, B., Peckhaus, A., Rose, D., Wein-bruch, S., Wex, H., Boose, Y., DeMott, P. J., Hader, J. D., Hill, T. C. J., Kanji, Z. A., Kulkarni, G., Levin, E. J. T., McCluskey, C. S., Murakami, M., Murray, B. J., Niedermeier, D., Petters, M. D., O’Sullivan, D., Saito, A., Schill, G. P., Tajiri, T., Tolbert, M. A., Welti, A., Whale, T. F., Wright, T. P., and Yamashita, K.: A comprehensive laboratory study on the immersion freezing be-havior of illite NX particles: a comparison of 17 ice nucleation measurement techniques, Atmos. Chem. Phys., 15, 2489–2518, doi:10.5194/acp-15-2489-2015, 2015.
Hoose, C. and Möhler, O.: Heterogeneous ice nucleation on atmo-spheric aerosols: a review of results from laboratory experiments, Atmos. Chem. Phys., 12, 9817–9854, doi:10.5194/acp-12-9817-2012, 2012.
Huffman, J. A., Prenni, A. J., DeMott, P. J., Pöhlker, C., Mason, R. H., Robinson, N. H., Fröhlich-Nowoisky, J., Tobo, Y., Després, V. R., Garcia, E., Gochis, D. J., Harris, E., Müller-Germann, I., Ruzene, C., Schmer, B., Sinha, B., Day, D. A., Andreae, M. O., Jimenez, J. L., Gallagher, M., Kreidenweis, S. M., Bertram, A. K., and Pöschl, U.: High concentrations of biological aerosol par-ticles and ice nuclei during and after rain, Atmos. Chem. Phys., 13, 6151–6164, doi:10.5194/acp-13-6151-2013, 2013.
Jones, H. M., Flynn, M. J., DeMott, P. J., and Möhler, O.: Manch-ester Ice Nucleus Counter (MINC) measurements from the 2007 International workshop on Comparing Ice nucleation Mea-suring Systems (ICIS-2007), Atmos. Chem. Phys., 11, 53–65, doi:10.5194/acp-11-53-2011, 2011.
Knopf, D. A., Wang, B., Laskin, A., Moffet, R. C., and Gilles, M. K.: Heterogeneous nucleation of ice on anthropogenic or-ganic particles collected in Mexico City, Geophys. Res. Lett., 37, L11803, doi:10.1029/2010GL043362, 2010.
nu-cleating particles from a case field study, J. Geophys. Res., 119, 10365–10381, doi:10.1002/2014JD021866, 2014.
Koop, T., Luo, B., Biermann, U. M., Crutzen, P. J., and Peter, T.: Freezing of HNO3/ H2SO4/ H2O solutions at stratospheric
tem-peratures: Nucleation statistics and experiments, J. Phys. Chem. A, 101, 1117–1133, doi:10.1021/jp9626531, 1997.
Koop, T., Ng, H. P., Molina, L. T., and Molina, M. J.: A New Optical Technique to Study Aerosol Phase Transitions: The Nucleation of Ice from H2SO4Aerosols, J. Phys. Chem. A, 102, 8924–8931,
doi:10.1021/jp9828078, 1998.
Koop, T., Kapilashrami, A., Molina, L. T., and Molina, M. J.: Phase transitions of sea-salt/water mixtures at low temperatures: Impli-cations for ozone chemistry in the polar marine boundary layer, J. Geophys. Res., 105, 26393–26402, doi:10.1029/2000JD900413, 2000.
Langer, G. and Rodgers, J.: An Experimental Study of the Detection of Ice Nuclei on Membrane Filters and Other Substrata, J. Appl. Meteorol., 14, 560–570, 1975.
Lohmann, U.: A glaciation indirect aerosol effect caused
by soot aerosols, Geophys. Res. Lett., 29, 1052,
doi:10.1029/2001GL014357, 2002.
Maenhaut, W., Ducastel, G., Hillamo, R. E., and Pakkanen, T. A.: Evaluation of the applicability of the MOUDI impactor for aerosol collections with subsequent multielement analysis by PIXE, Nucl. Instrum. Meth. B, 75, 249–256, doi:10.1016/0168-583X(93)95653-M, 1993.
Marple, V. A. and Willeke, K.: Impactor design, Atmos. Environ., 10, 891–896, doi:10.1016/0004-6981(76)90144-X, 1976. Marple, V. A., Rubow, K. L., and Behm, S. M.: A
Mi-croorifice Uniform Deposit Impactor (MOUDI): Descrip-tion, CalibraDescrip-tion, and Use, Aerosol Sci. Tech., 14, 434–446, doi:10.1080/02786829108959504, 1991.
Möhler, O., Field, P. R., Connolly, P., Benz, S., Saathoff, H., Schnaiter, M., Wagner, R., Cotton, R., Krämer, M., Mangold, A., and Heymsfield, A. J.: Efficiency of the deposition mode ice nu-cleation on mineral dust particles, Atmos. Chem. Phys., 6, 3007– 3021, doi:10.5194/acp-6-3007-2006, 2006.
Möhler, O., DeMott, P. J., Stetzer, O., and the ICIS-2007 team: The Fourth International Ice Nucleation Workshop ICIS-2007, Pro-ceedings of 15th ICCP, Cancun, Mexico, 7–11 July, 2008. Murray, B. J., Broadley, S. L., Wilson, T. W., Atkinson, J. D.,
and Wills, R. H.: Heterogeneous freezing of water droplets con-taining kaolinite particles, Atmos. Chem. Phys., 11, 4191–4207, doi:10.5194/acp-11-4191-2011, 2011.
Murray, B. J., O’Sullivan, D., Atkinson, J. D., and Webb, M. E.: Ice nucleation by particles immersed in supercooled cloud droplets, Chem. Soc. Rev., 41, 6519–6554, doi:10.1039/c2cs35200a, 2012.
Petzold, A., Ström, J., Ohlsson, S., and Schröder, F. P.: Elemen-tal composition and morphology of ice-crysElemen-tal residual parti-cles in cirrus clouds and contrails, Atmos. Res., 49, 21–34, doi:10.1016/S0169-8095(97)00083-5, 1998.
Pratt, K. A., Heymsfield, A. J., Twohy, C. H., Murphy, S. M., De-Mott, P. J., Hudson, J. G., Subramanian, R., Wang, Z., Seinfeld, J. H., and Prather, K. A.: In Situ Chemical Characterization of Aged Biomass-Burning Aerosols Impacting Cold Wave Clouds, J. Atmos. Sci., 67, 2451–2468, doi:10.1175/2010JAS3330.1, 2010.
Prodi, F., Santachiara, G., Prodi, V., and De Zaiacomo, T.: An Ex-perimental Technique to Study the Effect of Size on Ice Nucle-ation, J. Appl. Meteorol., 19, 1448–1450, 1980.
Pruppacher, H. R. and Klett, J. D.: Microphysics of Clouds and Pre-cipitation, Kluwer Academic Publishers, Dordrecht, the Nether-lands, 1997.
Rasband, W. S.: ImageJ, U. S. National Institutes of Health, Bethesda, Maryland, USA, available at: http://imagej.nih.gov/ij/, last access: 19 July 2014.
Richardson, M. S., DeMott, P. J., Kreidenweis, S. M., Cziczo, D. J., Dunlea, E. J., Jimenez, J. L., Thomson, D. S., Ashbaugh, L. L., Borys, R. D., Westphal, D. L., Casuccio, G. S., and Lersch, T. L.: Measurements of heterogeneous ice nuclei in the western United States in springtime and their relation to aerosol characteristics, J. Geophys. Res., 112, D02209, doi:10.1029/2006JD007500, 2007.
Rogers, D. C.: Development of a continuous flow thermal gradient diffusion chamber for ice nucleation studies, Atmos. Res., 22, 149–181, doi:10.1016/0169-8095(88)90005-1, 1988.
Rogers, D. C., DeMott, P. J., Kreidenweis, S. M., and Chen, Y.: A continuous-flow diffusion chamber for airborne measurements of ice nuclei, J. Atmos. Ocean. Tech., 18, 725–741, 2001.
Rosinski, J., Haagenson, P. L., Nagamoto, C. T., and Parungo, F.: Ice-forming nuclei of maritime origin, J. Aerosol Sci., 17, 23– 46, doi:10.1016/0021-8502(86)90004-2, 1986.
Rosinski, J., Haagenson, P. L., Nagamoto, C. T., and Parungo, F.: Nature of ice-forming nuclei in marine air masses, J. Aerosol Sci., 18, 291–309, doi:10.1016/0021-8502(87)90024-3, 1987. Rosinski, J., Haagenson, P. L., Nagamoto, C. T., Quintana,
B., Parungo, F., and Hoyt, S. D.: Ice-forming nuclei in air masses over the Gulf of Mexico, J. Aerosol Sci., 19, 539–551, doi:10.1016/0021-8502(88)90206-6, 1988.
Santachiara, G., Di Matteo, L., Prodi, F., and Belosi,
F.: Atmospheric particles acting as Ice Forming
Nu-clei in different size ranges, Atmos. Res., 96, 266–272, doi:10.1016/j.atmosres.2009.08.004, 2010.
Storelvmo, T., Hoose, C., and Eriksson, P.: Global modeling of mixed-phase clouds: The albedo and lifetime effects of aerosols, J. Geophys. Res., 116, D05207, doi:10.1029/2010JD014724, 2011.
Szyrmer, W. and Zawadzki, I.: Biogenic and anthropogenic sources of ice-forming nuclei: A review, B. Am. Meteorol. Soc., 78, 209– 228, 1997.
Targino, A. C., Krejci, R., Noone, K. J., and Glantz, P.: Single particle analysis of ice crystal residuals observed in orographic wave clouds over Scandinavia during INTACC experiment, At-mos. Chem. Phys., 6, 1977–1990, doi:10.5194/acp-6-1977-2006, 2006.
Vali, G.: Sizes of Atmospheric Ice Nuclei, Nature, 212, 384–385, doi:10.1038/212384a0, 1966.
Vali, G.: Quantitative Evaluation of Experimental Results on the Heterogeneous Freezing Nucleation of Supercooled Liquids, J. Atmos. Sci., 28, 402–409, 1971.
Vali, G. and Stansbury, E. J.: Time-dependent characteristics of the heterogeneous nucleation of ice, Can. J. Phys., 44, 477–502, doi:10.1139/p66-044, 1966.
Wang, B., Lambe, A. T., Massoli, P., Onasch, T. B., Davi-dovits, P., Worsnop, D. R., and Knopf, D. A.: The de-position ice nucleation and immersion freezing potential of amorphous secondary organic aerosol: Pathways for ice and mixed-phase cloud formation, J. Geophys. Res., 117, D16209, doi:10.1029/2012JD018063, 2012a.
Wang, B., Laskin, A., Roedel, T., Gilles, M. K. Moffet, R. C., Tivanski, A. V., and Knopf, D. A.: Heterogeneous ice nucleation and water uptake by field-collected atmospheric particles below 273 K, J. Geophys. Res., 117, D00V19, doi:10.1029/2012JD017446, 2012b.
Welti, A., Lüönd, F., Kanji, Z. A., Stetzer, O., and Lohmann, U.: Time dependence of immersion freezing: an experimental study on size selected kaolinite particles, Atmos. Chem. Phys., 12, 9893–9907, doi:10.5194/acp-12-9893-2012, 2012.
Wex, H., Augustin-Bauditz, S., Boose, Y., Budke, C., Curtius, J., Diehl, K., Dreyer, A., Frank, F., Hartmann, S., Hiranuma, N., Jantsch, E., Kanji, Z. A., Kiselev, A., Koop, T., Möhler, O., Niedermeier, D., Nillius, B., Rösch, M., Rose, D., Schmidt, C., Steinke, I., and Stratmann, F.: Intercomparing different de-vices for the investigation of ice nucleating particles using
Snomax® as test substance, Atmos. Chem. Phys., 15, 1463–
1485, doi:10.5194/acp-15-1463-2015, 2015.
Wheeler, M. J. and Bertram, A. K.: Deposition nucleation on min-eral dust particles: a case against classical nucleation theory with the assumption of a single contact angle, Atmos. Chem. Phys., 12, 1189–1201, doi:10.5194/acp-12-1189-2012, 2012.
Wheeler, M. J., Mason, R. H., Steunenberg, K., Wagstaff, M., Chou, C., and Bertram, A. K.: Immersion Freezing of Super-micron Mineral Dust Particles: Freezing Results, Testing Dif-ferent Schemes for Describing Ice Nucleation, and Ice Nucle-ation Active Site Densities, J. Phys. Chem. A, 119, 4358–4372, doi:10.1021/jp507875q, 2015.
Wright, T. P. and Petters, M. D.: The role of time in heterogeneous freezing nucleation, J. Geophys. Res.-Atmos., 118, 3731–3743, doi:10.1002/jgrd.50365, 2013.
Wright, T. P., Petters, M. D., Hader, J. D., Morton, T., and Holder, A. L.: Minimal cooling rate dependence of ice nuclei activity in the immersion mode, J. Geophys. Res.-Atmos., 118, 10535–10543, doi:10.1002/jgrd.50810, 2013.