www.soil-journal.net/3/83/2017/ doi:10.5194/soil-3-83-2017
© Author(s) 2017. CC Attribution 3.0 License.
SOIL
Process-oriented modelling to identify main drivers of
erosion-induced carbon fluxes
Florian Wilken1,2,3, Michael Sommer3,4, Kristof Van Oost5, Oliver Bens6, and Peter Fiener1
1Institute for Geography, Universität Augsburg, Augsburg, Germany
2Chair of Soil Protection and Recultivation, Brandenburg University of Technology Cottbus-Senftenberg,
Cottbus, Germany
3Institute of Soil Landscape Research, Leibniz Centre for Agricultural Landscape Research ZALF e.V.,
Müncheberg, Germany
4University of Potsdam, Institute of Earth and Environmental Sciences, Potsdam, Germany
5Earth & Life Institute, TECLIM, Université catholique de Louvain, Louvain-la-Neuve, Belgium
6Helmholtz Centre Potsdam GFZ German Research Centre for Geosciences, Potsdam, Germany
Correspondence to:Peter Fiener ([email protected])
Received: 24 October 2016 – Discussion started: 23 November 2016 Revised: 8 March 2017 – Accepted: 28 March 2017 – Published: 5 May 2017
Abstract. Coupled modelling of soil erosion, carbon redistribution, and turnover has received great attention
over the last decades due to large uncertainties regarding erosion-induced carbon fluxes. For a process-oriented representation of event dynamics, coupled soil–carbon erosion models have been developed. However, there are currently few models that represent tillage erosion, preferential water erosion, and transport of different carbon fractions (e.g. mineral bound carbon, carbon encapsulated by soil aggregates). We couple a process-oriented multi-class sediment transport model with a carbon turnover model (MCST-C) to identify relevant redistribution processes for carbon dynamics. The model is applied for two arable catchments (3.7 and 7.8 ha) located in the Tertiary Hills about 40 km north of Munich, Germany. Our findings indicate the following: (i) redistribution by tillage has a large effect on erosion-induced vertical carbon fluxes and has a large carbon sequestration potential; (ii) water erosion has a minor effect on vertical fluxes, but episodic soil organic carbon (SOC) delivery controls the long-term erosion-induced carbon balance; (iii) delivered sediments are highly enriched in SOC compared to the parent soil, and sediment delivery is driven by event size and catchment connectivity; and (iv) soil aggregation enhances SOC deposition due to the transformation of highly mobile carbon-rich fine primary particles into rather immobile soil aggregates.
1 Introduction
Soil organic carbon (SOC) is the largest terrestrial carbon (C) pool and has been identified as a cornerstone for the global C cycle. Globally, approx. 1400 Pg C is stored in the upper meter of soil, with approx. 700 Pg C in the upper 0.3 m (Hiederer and Köchy, 2011). As a result, exchange rates be-tween soil and the atmosphere are a major concern with re-gards to climate change (Polyakov and Lal, 2004a). Earth system model-based estimates for terrestrial C storage in the year 2100 vary widely, ranging from a sink of approx. 8 Pg C yr−1to a source of approx. 6 Pg C yr−1(Friedlingstein
im-84 F. Wilken et al.: Process-oriented modelling of erosion-induced carbon fluxes
portant processes, and differences in measuring approaches, e.g. extrapolating from arable plots (Hooke, 2000; Myers, 1993; Pimentel et al., 1995) vs. measuring continental de-livery in river systems (Berhe et al., 2007; Wilkinson and McElroy, 2007).
Most challenging in developing and especially testing models that couple process-oriented SOC redistribution with SOC dynamics are the different spatial and temporal scales of the processes at play (Doetterl et al., 2016). Process-oriented erosion models need event-based data to be val-idated, while SOC dynamics can hardly be observed on timescales smaller than several decades. Consequently, most existing models that couple soil erosion and SOC turnover processes are based on long-term, USLE-type erosion mod-els that ignore event dynamics. The most widespread of these is SPEROS-C, which was applied on scales ranging from micro- to mesoscale catchments (Fiener et al., 2015; Nadeu et al., 2015; Van Oost et al., 2005b).
The conventional approach to modelling coupled soil ero-sion and SOC turnover is to treat SOC as a stable part of the bulk parent soil and statistically model (long-term) erosion. However, this approach is likely to lead to biased estimates of both water-erosion-induced SOC redistribution and its effect on vertical C fluxes. Numerous studies have shown that the transport of SOC is selective (Schiettecatte et al., 2008), con-trolled by event characteristics (Sharpley, 1985; Van Hemel-ryck et al., 2010) and soil aggregation (Hu and Kuhn, 2014, 2016). The enrichment of SOC during transport has been ex-plicitly addressed by a few modelling studies, using different approaches (Fiener et al., 2015; Lacoste et al., 2015). The ef-fects of tillage erosion on vertical C fluxes have not yet been evaluated in detail, although a representation has been ac-counted for in some modelling studies (Lacoste et al., 2015; Van Oost et al., 2005a).
The aim of this study is to couple a spatially distributed, process-oriented and event-based water erosion model with a tillage erosion model and a SOC turnover model in or-der to analyse the importance of individual erosion processes in the erosion-induced C balance of agricultural catchments. The study intends to identify relevant processes that should be implemented in less data-demanding, more parsimonious models.
2 Materials and methods
2.1 Test site
The test site is located about 40 km north of Munich in the Tertiary Hills, an intensively used agricultural area in south-ern Germany. The site consists of two small arable catch-ments (48◦290N, 11◦260E; Fig. 1), catchments C1 and C2, covering an area of 3.7 and 7.8 ha, respectively. The rolling topography ranges from 454 to 496 m above sea level with a mean slope of 4.2◦ (±0.6◦) for catchment C1 and 5.3◦ (±1.7◦) for catchment C2. The soil landscape is
character-ized by Cambisols and Luvisols (partly redoximorphic), both developed from loess. Furthermore, Colluvic Regosols have developed in depressional areas due to long-term soil translo-cation processes. In both catchments, the dominant topsoil textures are loam and silty loam with a median grain size diameter between 12.5 and 16.0 µm (Sinowski and Auer-swald, 1999). The average SOC content of the Ap horizons is 3.7 kg m−2. The mean annual temperature and precipitation is 8.4◦C and 834 mm, respectively (measured 1994 to 2001). Agricultural management at the research farm is dedicated to soil conservation: the main cropping principle is to keep soil covered by vegetation or residues as long as possible (Auer-swald et al., 2000). The crop rotation during the project was winter wheat (Triticum aestivumL.) – maize (Zea maysL.) – winter wheat – potato (Solanum tuberosumL.). This crop ro-tation allowed for the cultivation of mustard (Sinapis albaL.) cover crops before each row crop (i.e. potato and maize). For implementation, potato ridges were formed before mustard sowing and, later, potato was directly sown into the ridges covered by winterkilled mustard. Maize, on the other hand, was directly sown into the winterkilled mulched mustard (Auerswald et al., 2000). For the established mulch tillage system, the main soil tillage operation was performed with a chisel cultivator (tillage depths approx. 0.2 m). To avoid soil compaction and depressions, which could potentially induce concentrated runoff, wide and low-pressure tires were used on all farming machines (e.g. Fiener and Auerswald, 2007b). Catchment C1 drains one large field with an approx. 2–3 m wide grass filter strip along its downslope border, whereas catchment C2 consists of two fields draining into an approx. 300 m long and 30–40 m wide grassed waterway (Fig. 1).
2.2 Model description
0 75 150 300 [m]
Germany
Arable GWW / VFS 1 m contour Outlet
Tillage dir.
C1
C2
Figure 1. Land use, topography, and tillage direction for
mod-elled catchments C1 and C2. In catchment C2, a grassed waterway (GWW) is located along the thalweg, while vegetated filter strips (VFS) are located along the upslope and downslope field borders.
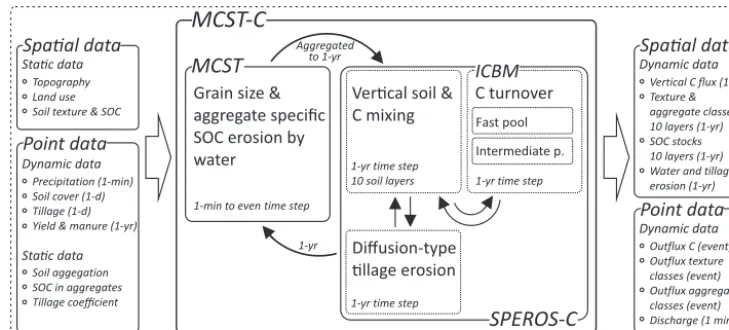
model (Multi-Class Sediment Transport and Carbon dynam-ics model) that had to be adapted in order to couple the mod-els or for the introduction of SOC-specific transport mecha-nisms. An overview of the main model concepts of MCST-C is given in Fig. 2. For more details regarding the three cou-pled models and processes modelled therein, we refer the reader to the original publications (see above).
2.3 Representation of grain-size-specific soil and associated SOC
The representation of soil texture and SOC in the model is three-dimensional. The horizontal distribution of grain-size-specific soil and SOC is grid-based, while the vertical dis-tribution is represented by ten 10 cm layers. The two upper-most layers are assumed to be homogeneously mixed due to tillage. The grain size distribution is represented in 14 pri-mary particle classes, described by class median particle di-ameter, particle density, and the class proportion relative to the bulk soil (kg kg−1). The median class diameter is cal-culated by a logarithmic function that takes grain diameter class boundaries into account (Scheinost et al., 1997). The standard procedure (e.g. sieve–pipette method; Casagrande, 1934; DIN, 2002) to determine grain size distributions de-stroys soil aggregates in a pre-processing step and there-fore only represents the primary particle distribution. How-ever, soil aggregation has a large effect on the fall veloc-ity distribution of soils and reduces the transport distance
of SOC-rich material (Hu and Kuhn, 2014, 2016). There-fore, to account for soil aggregation, two water-stable ag-gregate classes have been introduced following the hierar-chy model of Oades (1984), which describes microaggregate formation inside macroaggregates: silt-sized small microag-gregates (6.3–53 µm, median diameter (D50): 18 µm; Tisdall and Oades, 1982) and microaggregates (53–250 µm, D50: 115 µm; Six et al., 2002). In model parametrization, the small microaggregates are exclusively formed out of primary par-ticles with diameters less than 6.3 µm, whereas microaggre-gates are formed from those with diameters less than 53 µm (i.e. the lower diameter boundary of the aggregate class). As a result, aggregation causes a certain number of pri-mary particles to be moved into the aggregate classes. Hence, the absolute amount of soil aggregation is controlled by the availability of fine primary particles, i.e. sandy soils are less aggregated compared to clayey soils. Macroaggregates (250–2000 µm) are neglected since they are rather immobile during selective interrill erosion and are assumed to break into smaller aggregates during extreme events with high-precipitation kinetic energies (Legout et al., 2005; Oades and Waters, 1991; Tisdall and Oades, 1982). Furthermore, par-ticulate organic matter (POM) is not treated as an individual class, as POM is assumed to be predominantly encapsulated within soil aggregates (Beuselinck et al., 2000; Wang et al., 2013; Wilken et al., 2017).
SOC transport is associated with various primary parti-cle and aggregate classes. Based on the literature (Doetterl et al., 2012; Von Lützow et al., 2007), it is assumed that mineral bound SOC is primarily attached to fine particles (<6.3 µm) or included in soil aggregates. To keep the mass balance, SOC in water-stable aggregates is allocated based on the SOC content of the primary particles that form these aggregates. This leads to a conservative estimate of SOC in aggregates, as measurements show that aggregates tend to encapsulate more C than found attached to mineral primary particles (Doetterl et al., 2012). As small microaggregates in the model consist solely of primary particles with diameters less than 6.3 µm, their C content equals that of the fine pri-mary particles. Microaggregates show a somewhat smaller C content, since the larger primary particles from which they are also made tend to have less associated SOC.
2.4 Continuous tracking of catchment dynamics
asso-86 F. Wilken et al.: Process-oriented modelling of erosion-induced carbon fluxes
SPEROS-C
Grain size & aggregate specific SOC erosion by water
Ver cal soil & C mixing
C turnover
Fast pool
Intermediate p.
MCST
1-min to even time step
1-yr time step
10 soil layers 1-yr time step
Diffusion-type llage erosion
1-yr time step Spa al data
Topography Land use Soil texture & SOC
Sta c data
Point data Dynamic data
Precipitation (1-min) Soil cover (1-d) Tillage (1-d) Yield & manure (1-yr)
Soil aggegation SOC in aggregates Tillage coefficient
Sta c data
ICBM Vertical C flux (1-yr) Texture & aggregate classes 10 layers (1-yr) SOC stocks 10 layers (1-yr) Water and tillage erosion (1-yr)
Dynamic data
Point data Dynamic data
Outflux C (event) Outflux texture classes (event) Outflux aggregate classes (event) Discharge (1 min)
MCST-C
Spa al data Aggregated
to 1-yr
1-yr
Figure 2.Modelling scheme of the Multi-Class Sediment Transport and Carbon dynamics model (MCST-C).
ciated SOC content, changes which are caused by selective redistribution of water and non-selective tillage erosion. In the case of net deposition, new material with a different grain size distribution is added to the top of the plough horizon (layer 1 and 2). Subsequently, the grain size distribution of the plough layer is mixed and assumed to be homogeneous. Furthermore, deposition leads to an upward movement of the layer borders such that soil material from the plough layer becomes incorporated into the subsoil layers. Any C content moving below 1 m depth is summarized and assumed to be stable in time. In contrast, erosion lifts new material from the subsoil horizons upwards. Assuming that the deepest horizon represents the original loess, the properties of uplifted sub-soil remain constant, delivering infinite material of the same grain size distribution and C content.
2.5 Model validation
For a truly rigorous validation of MCST-C, there are numer-ous long-term data requirements: event-based data for sur-face runoff, sediment delivery and SOC delivery, long-term data regarding changes in spatially distributed SOC stocks, spatially distributed C loss and gain due to crop harvest-ing, and C input via plants and manure application. In addi-tion to these validaaddi-tion data requirements, model input data would also be required over decades for a long-term vali-dation. The research project (Auerswald et al., 2000) which is the basis of this study provided a very comprehensive database. However, continuous monitoring was “only” car-ried out for 8 years (1994 to 2001), and SOC inventories span roughly a decade (first inventory in 1990/91, second in 2001). Therefore, measured changes in SOC stocks are too small to be used for a long-term model validation (requires approx. 50 years; see implementation).
In consequence, we only use the measured continuous event-based surface runoff and sediment delivery from catch-ment C1 to validate the modelled erosion. The runoff was
collected at the lowest point of the catchment (Fig. 1), which was bordered by a small earthen dam. From the dam, the runoff was transmitted via an underground tile outlet (diame-ter 0.29 m) to a measuring system consisting of a Coshocton-type wheel runoff sampler (for details regarding the proce-dure and the precision of the measurements see Fiener and Auerswald, 2003). Corresponding precipitation was mea-sured using a tipping bucket rain gauge of 0.2 mm volume resolution. To determine single erosion events, the precipita-tion data are filtered in two steps: first, all events with cumu-lative precipitation>5 mm and without a 6 h gap in recorded precipitation are considered single erosion events. Second, we included all the largest events accounting for 90 % of to-tal observed runoff. The model is not able to predict erosion under soil frost; hence, winter events, indicated by air tem-peratures below zero, are removed.
As the original MCST model was previously tested in catchment C1 (Fiener et al., 2008), we did not explicitly cali-brate the surface runoff and erosion model. Instead, observed runoff and sediment delivery data was used to test whether our changes to the model still result in a reasonable model performance.
2.6 Model implementation
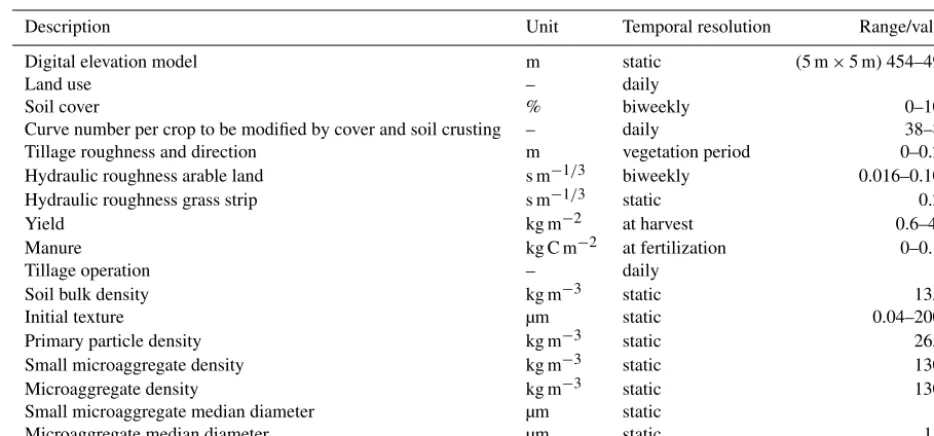
Table 1.Main input data and parameters used in the Multi-Class Sediment Transport and Carbon dynamics model (MCST-C).
Description Unit Temporal resolution Range/value
Digital elevation model m static (5 m×5 m) 454–496
Land use – daily –
Soil cover % biweekly 0–100
Curve number per crop to be modified by cover and soil crusting – daily 38–88
Tillage roughness and direction m vegetation period 0–0.25
Hydraulic roughness arable land s m−1/3 biweekly 0.016–0.101
Hydraulic roughness grass strip s m−1/3 static 0.20
Yield kg m−2 at harvest 0.6–4.3
Manure kg C m−2 at fertilization 0–0.13
Tillage operation – daily –
Soil bulk density kg m−3 static 1350
Initial texture µm static 0.04–2000
Primary particle density kg m−3 static 2650
Small microaggregate density kg m−3 static 1300
Microaggregate density kg m−3 static 1300
Small microaggregate median diameter µm static 18
Microaggregate median diameter µm static 115
and after each soil management operation (1993–1997). A tillage transport coefficient (ktil) of 169 kg m−1yr−1was uti-lized for contour tillage by a chisel, following Van Muysen et al. (2000). For SOC redistribution and modelling of ver-tical C fluxes, the most important model inputs were yields and manure application, a topsoil SOC map (12.5×12.5 m2; Sinowski et al., 1997), and assumptions regarding the alloca-tion of C to different texture classes and in different aggre-gates. As texture and aggregate C allocation was not mea-sured, we took measured data from Doetterl et al. (2012) and scaled these measurements according to the available bulk SOC (see Sect. 2.3: Representation of grain-size-specific soil and SOC). The parameters for the C turnover model are taken from Dlugoß et al. (2012), who worked under similar en-vironmental conditions with loess-derived soils in a small catchment in western Germany. The C turnover decline with depth was determined by an inverse modelling approach and found a mean turnover rate of 0.268 yr−1for the young pool and 0.002 yr−1for the old pool over the 1 m soil profile. Fur-ther details regarding the monitoring data are given in Fiener and Auerswald (2003, 2007b) and Fiener et al. (2008).
As indicated above, it is difficult, if not impossible, to identify erosion-induced changes in SOC and vertical C fluxes if measurements or modelling efforts do not cover decadal time spans. Therefore, a 50-year synthetic input data set and parameter set was created for MCST-C in order to analyse C dynamics. This data set is based on the 8 years of measured data used to validate the erosion component of the model. First, a time series of precipitation was established by randomly choosing the data of one of the eight measured years (see Sect. 2.5: Model validation) and applying it for the first 42 years of the time series. This was followed by the original 8 measured years to reach the total of 50 years.
Next, this precipitation time series was combined with syn-thetic land use and soil management data representing two full crop rotations (1994 to 2001), which were repeatedly used for all 50 years. This combination leads to a wide va-riety of precipitation events (time step 1 min) occurring for different daily soil covers by vegetation as a major driver of soil erosion. In contrast to the erosion dynamics, C inputs via plants and manure are repeated every 8 years, which ignores any potential change in management and yields within the modelling period. The synthetic input data were applied for both catchments for the purpose of comparability.
2.7 Analysis of process-specific, erosion-induced C fluxes
88 F. Wilken et al.: Process-oriented modelling of erosion-induced carbon fluxes
Table 2.Model parametrization to analyse the effects of different erosion processes upon C fluxes. Model runs are abbreviated as follows:
reference run (Ref), without tillage erosion (Tiloff), water erosion without grain size selectivity (GSoff), high threshold for rill initiation
(Rillo), low threshold for rill initiation (Rilhi), without soil aggregation (Aggoff), low soil aggregation (Agglo), high soil aggregation (Agghi),
without water erosion (Waoff), low tillage erosion (Tillo), and high tillage erosion (Tilhi).
Processes Parameter (unit) Ref Tiloff GSoff Rillo Rilhi Aggoff Agglo Agghi Waoff Tillo Tilhi
Water erosion
with vs. w/o tillage erosion (−) +a − + + + + + + + + +
with vs. w/o grain size selectivity (−) + + − + + + + + + + +
varying rill/interrill erosion τcritb(Pa) 0.9 0.9 0.9 1.35 0.45 0.9 0.9 0.9 0.9 0.9 0.9
varying small micro & microaggregates (%) 60 60 60 60 60 0 30 90 60 60 60
Tillage erosion
with vs. w/o water erosion (−) + + + + + + + + − + +
varying tillage intensity ktilc(kg m−1yr−1) 169 0 169 169 169 169 169 169 169 85 254
a+and−indicate whether a process is modelled or not;bcritical shear stress for rill initiation;ctillage erosion coefficient.
0.28 2.37 3.35 5.02 8.87 15.8 23.7 33.5 44.7 56.1 79.4 141 355 1122 18.0 115
0 0.2 0.4 0.6 0.8 1.0
Median class diameter [ m]
C
um
ul
at
iv
e
so
il
m
as
s
[k
g
kg
-1]
Aggoff Agglo Ref Agghi
Soil
aggregates
Primary particles
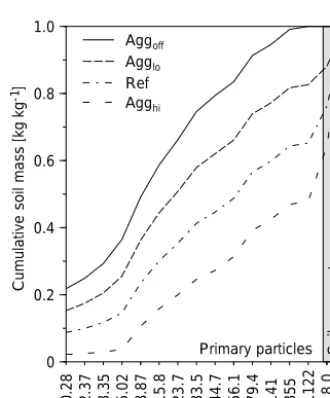
Figure 3.Median class diameter distribution (14 primary particle
and 2 aggregate classes) in the plough layer assuming different ag-gregation levels, as described in Table 2.
run, grain size selectivity was switched off in order to pro-duce a similar behaviour to more parsimonious models which only erode bulk soil (Table 2). To analyse the sensitivity of C fluxes to water and tillage erosion, we first compared model runs with pure water or pure tillage erosion. Secondly, we varied the reference run ktil coefficient of 169 kg m−1yr−1 by ±50 %. All model runs altered only a single parameter, with all other parameters retaining their reference run val-ues. Parameter variations and the abbreviations for each of the model runs are given in Table 2.
2.8 Analysis of erosion-induced C fluxes
To compare vertical C fluxes from erosional and depositional sites, the corresponding total and mean C flux was calcu-lated on an annual basis. To isolate the C fluxes that result
Table 3.Model performance, as described by the Nash–Sutcliffe
efficiency (NSE; Nash and Sutcliffe, 1970), root mean square error (RMSE), coefficient of determination (R2), and Spearman’s rank correlation coefficient (RHO).
NSE RMSE R2 RHO
Runoff 0.83 5.6 mm 0.94 0.89
Sediment delivery 0.92 165 kg ha−1 0.95 0.71
solely from erosion processes, we first calculate all verti-cal C fluxes excluding erosion processes and then subtract these from the vertical C fluxes including erosion processes. In the following results section, positive C fluxes indicate an erosion-induced C gain for the catchment (input to the soil), while negative fluxes indicate an erosion-induced loss (from soil to the atmosphere or SOC delivery from the catch-ment by runoff). Subsequently, erosional and depositional sites were spatially subdivided and an average vertical C flux in kg C m−2was calculated. Finally, the erosion-induced C balance of the catchment was calculated as the sum of the total vertical C flux and laterally delivered SOC.
3 Results
3.1 Validation
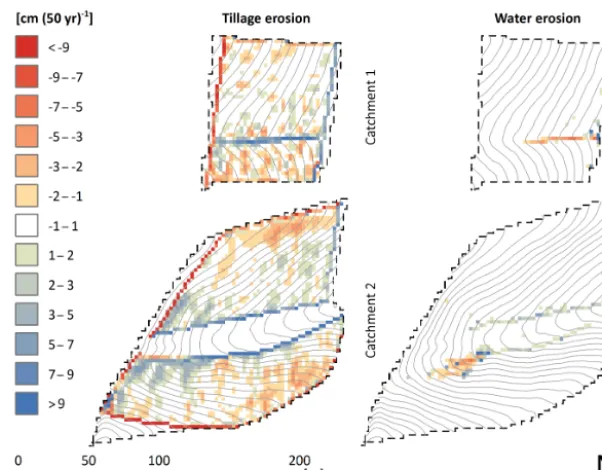
Figure 4.Spatial patterns of tillage and water erosion for the 50-year simulation period of the reference run.
3.2 Long-term erosion-induced C fluxes
The simulated tillage and water erosion shows distinct spa-tial patterns (Fig. 4). The highest rates of tillage erosion are found along the upslope boundaries of the arable field and on hilltops. The main areas for tillage-induced deposition are at the downslope arable field boundaries and in concav-ities (Fig. 4). Due to the well-established soil conservation system, water erosion takes place over a much smaller spa-tial extent and is limited to the main hydrological flow path, while deposition is dominantly found in the vegetated filter strips and grassed waterway (Fig. 4).
The reference run (validated against sediment delivery in catchment C1, 1994–2001) shows positive vertical C fluxes at erosional sites over the 50-year simulation period, with a cumulative flux of 40 g m−2 (50 yr)−1 in C1 and 59 g m−2 (50 yr)−1 in C2 (Fig. 5: Ero1, Ero2). The depositional C fluxes show a cumulative C loss of−27 g m−2(50 yr)−1and −30 g m−2 (50 yr)−1 for C1 and C2, respectively (Fig. 5: Dpo1, Dpo2). Lateral SOC delivery is mainly driven by three heavy erosion events causing 58 and 53 % of the total SOC delivery in C1 and C2, respectively. The total SOC deliv-ery in C1 is−15.6 g m−2(50 yr)−1and in C2 is−6.5 g m−2 (50 yr)−1(Fig. 5: Del1, Del2). In C1, the source function of lateral SOC delivery exceeds the sink function of vertical SOC sequestration and leads to a net C loss of−5.7 g m−2 (50 yr)−1(Fig. 5: Bal1, Bal2). In contrast, catchment C2 is a net C sink of 4.6 g m−2(50 yr)−1.
The event-based SOC enrichment in delivered sediments, compared to parent soil, ranges from 1.1 to 2.7 (2.4 mean) for C1 and from 2.5 to 2.7 (2.7 mean) for C2 over the 50-year time span (Fig. 6). Subdividing the events into tertiles (33 %
parts) according to sediment delivery, the mean enrichment in C1 is 2.5 (n=67) for the low tertile (i.e. smallest 33 % of all event-specific sediment delivery masses), 1.4 (n=6) for the middle tertile, and 1.2 (n=2) for the high tertile (Fig. 6). In contrast, more or less no variation in SOC enrichment was modelled for C2 (Fig. 6).
3.3 Importance of individual erosion processes for long-term erosion-induced C fluxes
Vertical C fluxes show a large response to changes in thektil coefficient but a negligible response to varying levels of wa-ter erosion (Fig. 5: Ero1, Ero2, Dpo1, Dpo2). Cumulative C flux at erosional and depositional sites is found to be lowest when no tillage (Tiloff) is simulated and highest for strong tillage (Tilhi). When pure tillage erosion is simulated (Waoff) in catchment C1, a C sequestration of 7 g m−2 (50 yr)−1 is simulated (Fig. 5: Bal1). The majority of processes in catch-ment C2 lead to an erosion-induced C gain for the catchcatch-ment. The highest C sequestration in catchment C2 is found for high tillage erosion (Tilhi: 10.3 g m−2(50 yr)−1). In contrast, catchment C2 acts as a source when there is no tillage (Tiloff: −4.8 g m−2(50 yr)−1), as well as when tillage erosion is low (Tillo:−0.4 g m−2(50 yr)−1; Fig. 5: Bal2).
90 F. Wilken et al.: Process-oriented modelling of erosion-induced carbon fluxes 0 20 40 60 80 100 C flux erosion [g m
-2] Ref
Tiloff GSoff Waoff Tillo Tilhi -100 -80 -60 -40 -20 0 C flux deposition [g m -2] Ref Wat-til Wat-er Til-wat Tilmid Tilhi Aggno Agglo Agghi Rillhi Rilllo -30 -25 -20 -15 -10 -5 0 SOC delivery [g m -2] Ref Wat-til Wat-er Til-wat Tilmid Tilhi Aggno Agglo Agghi Rillhi Rilllo
1950 1960 1970 1980 1990 2000 -20 -10 0 10 Simulation year C balance [g m -2] Ref Wat-til Wat-er Til-wat Tilmid Tilhi Aggno Agglo Agghi Rillhi Rilllo
1950 1960 1970 1980 1990 2000
Ref Wat-til Wat-er Til-wat Tilmid Tilhi Aggno Agglo Agghi Rillhi Rilllo Catchment 1 0 20 40 60 80 100 C flux erosion [g m -2] Aggoff Agglo Agghi Rilllo Rillhi -100 -80 -60 -40 -20 0 C flux deposition [g m -2] Ref Wat-til Wat-er Til-wat Tilmid Tilhi Aggno Agglo Agghi Rillhi Rilllo -30 -25 -20 -15 -10 -5 0 SOC delivery [g m -2] Ref Wat-til Wat-er Til-wat Tilmid Tilhi Aggno Agglo Agghi Rillhi Rilllo
1950 1960 1970 1980 1990 2000-20 -10 0 10 Simulation year C balance [g m -2] Ref Wat-til Wat-er Til-wat Tilmid Tilhi Aggno Agglo Agghi Rillhi Rilllo
1950 1960 1970 1980 1990 2000
Ref Wat-til Wat-er Til-wat Tilmid Tilhi Aggno Agglo Agghi Rillhi Rilllo Catchment 2 Ero1 Ero2 Dpo1 Dpo2 Del1 Del2 Bal1 Bal2
Figure 5.Simulated cumulative vertical C fluxes for erosional (Ero1, Ero2) and depositional (Dpo1, Dpo2) sites, lateral C delivery (Del1,
Del2), and catchment C balance (Bal1, Bal2) for catchment C1 and C2. For details regarding the model runs and corresponding abbreviations see Table 2.
−26.3 g m−2(50 yr)−1). In catchment C2, the highest lateral SOC delivery is achieved when there is assumed to be no soil aggregation (Aggoff: −13.0 g m−2 (50 yr)−1). If water ero-sion is taken into account, catchment C1 is a net C source ranging from 1.3 (GSoff) to 14.2 (Rilhi) g m−2(50 yr)−1. In contrast, the tillage-induced sequestration potential of catch-ment C2 exceeds SOC delivery in most water erosion model runs, leading to a positive erosion-induced C balance (sink) as long as soil aggregation is included (Aggoff: −1 g m2 (50 yr)−1; Fig. 5: Bal1–Bal2).
Variations in SOC enrichment of delivered sediments is generally rather small for all model runs (Fig. 6). The most pronounced effect on SOC enrichment results from different aggregation levels (Aggoff, Agglo, Agghi). However, differ-ences in SOC enrichment were much more pronounced be-tween the catchments. While C2 show high enrichment ratios (>2.5) for all events, the enrichment ratios strongly decline with increasing event size in C1 (Fig. 6b–c).
4 Discussion
4.1 Vertical C fluxes
Ref Rillo Rilhi
Agg
off
Agg
lo
Agg
hi
1 1.5 2 2.5 3
SOC
enrichment
[-]
Catchment 1 (n = 67) Catchment 2 (n = 48)
Low tertile (1/3)
Ref Rillo Rilhi
Agg
off
Agg
lo
Agg
hi
Catchment 1 (n = 6) Catchment 2 (n = 5)
Middle tertile (2/3)
Ref Rillo Rilhi
Agg
off
Agg
lo
Agg
hi
Catchment 1 (n = 2) Catchment 2 (n = 2)
High tertile (3/3)
(a) (b) (c)
Figure 6.Event-size-specific simulated mean SOC enrichment in delivered sediments of catchment C1 and C2. Error bars indicate one
standard deviation. Panels(a),(b), and(c)represent the smallest, middle, and largest 33.3 % of all event-specific sediment delivery masses. For details regarding different model runs and abbreviations see Table 2.
2006) as a result of the soil conservation system. However, independent from the soil tillage management, it is obvi-ous that tillage erosion needs to be taken into account for reasonable estimates of vertical erosion-induced C fluxes on arable land (see also Van Oost et al., 2005a). Moreover, it should be noted that modelling tillage erosion is associated with large uncertainties since it is controlled by a large num-ber of parameters (e.g. tool geometry and type, up-down or contour tillage, speed, depth, soil characteristics; Van Muy-sen et al., 2000; Van Oost and Govers, 2006). This uncer-tainty is illustrated by the large range of ktil coefficients which can be found in the literature (e.g. for chisel ktil: 70 to 657 kg m−1yr−1; Van Oost and Govers, 2006). Interest-ingly, different water erosion processes hardly affected the vertical erosion-induced C fluxes. This is even true for model parametrizations with very pronounced rill erosion (Rilhi) and large sediment fluxes, because rills only affect a small area. Deposition is also restricted to a small number of raster cells (Fig. 4), particularly in the grassed waterway of catch-ment C2. The model does not account for changes in C min-eralization at depositional sites that may occur as a result of aggregate breakdown shortly after deposition (Hu et al., 2016; Van Hemelryck et al., 2010, 2011). However, the po-tential underestimation of C mineralization at depositional sites is assumed to be small (<2 % at a loess site in Belgium; Van Hemelryck et al., 2011). In addition, various drivers of additional C mineralization at depositional sites have been discussed in literature (soil moisture, crusting and crust re-covery, deposition of large macroaggregates; Van Hemelryck et al., 2010, 2011) but there is still a substantial lack in pro-cess understanding. At this moment, this issue makes it dif-ficult to transfer the specific experimental results into a mod-elling framework addressing other environmental conditions. Overall, to achieve accurate estimates of vertical erosion-induced C fluxes, it seems to be more important to improve the representation of tillage erosion in the model, rather than
focusing on detailed process-oriented water erosion mod-elling, which is less important for vertical C fluxes.
4.2 Lateral C fluxes
In contrast to vertical C fluxes, lateral erosion-induced C fluxes are substantially affected by a number of event-specific processes. To assess these processes, a spatially dis-tributed process-oriented modelling approach is needed.
92 F. Wilken et al.: Process-oriented modelling of erosion-induced carbon fluxes
catchment C2. This large difference between catchment C1 and C2 suggests that the relevance of SOC enrichment in de-livered sediments is controlled not only by event size but also by the catchment connectivity to the outlet.
SOC enrichment in delivered sediments is mainly con-trolled by the physical properties (e.g. soil texture) of the parent soil (Foster et al., 1985). Soil aggregation transforms unconsolidated fine primary particles, a highly mobile SOC fraction, into soil aggregates, a fraction in which SOC is far less mobile. Hu and Kuhn (2016) showed that soil aggrega-tion reduces the transport distance and potentially enhances terrestrial SOC deposition up to 64 %. We found a similar trend: upon increasing the aggregation level of the model from non-aggregated (Aggoff) to heavily aggregated (Agghi) soil conditions, we found an increase in SOC deposition for both catchment C1 (47 %) and C2 (83 %). However, while soil texture clearly plays an important role, inter-field con-nectivity can be the dominant process driving lateral SOC de-livery on the landscape scale. This is demonstrated by catch-ment C2, which shows its largest SOC delivery when it is assumed that there is no soil aggregation. Unfortunately, rep-resenting soil aggregation in models is challenging due to a pronounced seasonality (Angers and Mehuys, 1988; Coote et al., 1988; Six et al., 2004; Wang et al., 2010) and complex spatial patterns related to soil nutrients, moisture, grain size distribution, management practices, erosion, and soil biota (Denef et al., 2002). Especially for landscape-scale applica-tions, this high degree of complexity needs to be substantially reduced in a conceptual way. In general, static soil param-eters might underestimate dynamic feedbacks, but they are a necessary simplification for landscape-scale modelling ap-proaches.
4.3 Erosion-induced C balance of different catchments
Under the same precipitation and field conditions, the sim-ulated erosion-induced C balance of catchment C1 and C2 show opposing results (Fig. 5: Bal1–Bal2). While catchment C1 acts as a C source for the majority of simulated processes (controlled primarily by SOC delivery), the presence of the grassed waterway for catchment C2 substantially reduces lat-eral SOC delivery and leads the catchment to function as a C sink for most simulated processes. For both catchments, the majority of simulation years show a positive erosion-induced C balance (sink). However, three heavy erosion events in catchment C1 exceeded the positive cumulative vertical flux. Therefore, we underline that any analysis of landscape-scale erosion-induced C balances must consider inter-field connec-tivity.
5 Conclusions
In this study, the effect of individual SOC redistribution pro-cesses on SOC dynamics is assessed by utilizing a coupled process-oriented erosion and C turnover model. The erosion
component of the model was successfully validated against a continuous 8-year data set of surface runoff and sediment delivery. The model was able to estimate the relevance of different processes in terms of their impact on vertical and lateral C fluxes for two catchments with distinct characteris-tics over an artificial time series of 50 years. We found that tillage erosion dominates on-field soil redistribution and ver-tical erosion-induced C fluxes on arable land, while water erosion processes have a much more limited effect. However, episodic lateral SOC delivery is critically important for the carbon balance. Ignoring SOC enrichment in delivered sed-iments leads to a pronounced underestimation of delivered SOC. Soil aggregates substantially reduce SOC delivery by turning highly mobile fine primary particles into less mobile soil aggregates. In general, the erosion-induced C balance is largely affected by inter-field deposition related to catchment connectivity.
Our results underline the importance of having an accu-rate and spatially distributed representation of tillage ero-sion. The episodic nature of water erosion calls for a suf-ficiently long simulation period and the inclusion of grain-size-selective transport in order to address the enrichment of delivered SOC. Furthermore, we stress the need for future investigations on seasonal and spatial variations in soil ag-gregation for a conceptual model implementation.
Data availability. The MCST-C model is still under development
and utilized in current studies. If someone is interested in coopera-tion, the authors would be happy to share the recent model version and the data used in this study.
Competing interests. The authors declare that they have no
con-flict of interest.
Acknowledgements. The study was supported by the Terrestrial
Environmental Observatory TERENO-Northeast of the Helmholtz Association. We would like to acknowledge the large number of scientists and technicians who collected the data used in this study, which was funded by the Bundesministerium für Bildung, Wissenschaft, Forschung und Technologie (BMBF No. 0339370) and the Bayerische Staatsministerium für Unterricht und Kultus, Wissenschaft und Kunst.
Edited by: N. J. Kuhn
Reviewed by: two anonymous referees
References
Angers, D. A. and Mehuys, G. R.: Effects of cropping on macro-aggregation of a marine clay soil, Can. J. Soil Sci., 68, 723–732, 1988.
Auerswald, K. and Weigand, S.: Eintrag und Freisetzung von P durch Erosionsmaterial in Oberflächengewässern, VDLUFA-Schriftenreihe, 50, 37–54, 1999.
Auerswald, K., Albrecht, H., Kainz, M., and Pfadenhauer, J.: Prin-ciples of sustainable land-use systems developed and evaluated by the Munich Research Alliance on agro-ecosystems (FAM), Petermanns Geographische Mitteilungen, 144, 16–25, 2000. Berhe, A. A., Harte, J., Harden, J. W., and Torn, M. S.: The
signifi-cance of the erosion-induced terrestrial carbon sink, Bioscience, 57, 337–346, 2007.
Beuselinck, L., Steegen, A., Govers, G., Nachtergaele, J., Takken, I., and Poesen, J.: Characteristics of sediment deposits formed by intense rainfall events in small catchments in the Belgian Loam Belt, Geomorphology, 32, 69–82, 2000.
Casagrande, A.: Die Aräometermethode zur Bestimmung der Korn-größenverteilung von Böden, Arthur Casagrande, Berlin, 1934. Coote, D. R., Malcolm-McGovern, C. A., Wall, G. J., Dickinson,
W. T., and Rudra, R. P.: Seasonal variation of erodibility indices based on shear strength and aggregate stability in some Ontario soils, Can. J. Soil Sci., 68, 405–416, 1988.
Denef, K., Six, J., Merckx, R., and Paustian, K.: Short-term effects of biological and physical forces on aggregate formation in soils with different clay mineralogy, Plant Soil, 246, 185–200, 2002. DIN: DIN ISO 11277: 2002-08 Bodenbeschaffenheit –
Bestim-mung der Partikelgrößenverteilung in Mineralböden – Verfahren mittels Siebung und Sedimentation, Beuth Verlag, Berlin, 2002. Dlugoß, V., Fiener, P., Van Oost, K., and Schneider, K.: Model based
analysis of lateral and vertical soil C fluxes induced by soil redis-tribution processes in a small agricultural watershed, Earth Surf. Proc. Land., 37, 193–208, 2012.
Doetterl, S., Six, J., Van Wesemael, B., and Van Oost, K.: Car-bon cycling in eroding landscapes: geomorphic controls on soil organic C pool composition and C stabilization, Glob. Change Biol., 18, 2218–2232, 2012.
Doetterl, S., Berhe, A. A., Nadeu, E., Wang, Z., Sommer, M., and Fiener, P.: Erosion, deposition and soil carbon: A review on process-level controls, experimental tools and models to address C cycling in dynamic landscapes, Earth-Sci. Rev., 154, 102–122, 2016.
Fiener, P. and Auerswald, K.: Effectiveness of grassed waterways in reducing runoff and sediment delivery from agricultural wa-tersheds, J. Environ. Qual., 32, 927–936, 2003.
Fiener, P. and Auerswald, K.: Möglichkeiten der Abfluss- und Stoff-transportkontrolle durch landwirtschaftliche Maßnahmen und ihre Kombination im Landschaftsmaßstab, in: DWA Sonder-druck zum Tag der Hydrologie 2007, Rostock, 23–36, 2007a. Fiener, P. and Auerswald, K.: Rotation effects of potato, maize and
winter wheat on soil erosion by water, Soil Sci. Soc. Am. J., 71, 1919–1925, 2007b.
Fiener, P., Govers, G., and Van Oost, K.: Evaluation of a dynamic multi-class sediment transport model in a catchment under soil-conservation agriculture, Earth Surf. Processes Landforms, 33, 1639-1660, 2008.
Fiener, P., Dlugoß, V., and Van Oost, K.: Erosion-induced carbon redistribution, burial and mineralisation – Is the episodic nature of erosion processes important?, Catena, 133, 282–292, 2015.
Foster, G. R., Young, R. A., and Neibling, W. H.: Sediment compo-sition for nonpoint source pollution analyses, Transactions of the American Society of Agricultural Engineers, 28, 133–139, 1985. Friedlingstein, P., Andrew, R. M., Rogelj, J., Peters, G. P., Canadell, J. G., Knutti, R., Luderer, G., Raupach, M. R., Schaeffer, M., van Vuuren, D. P., and Le Quere, C.: Persistent growth of CO2
emis-sions and implications for reaching climate targets, Nat. Geosci., 7, 709–715, 2014.
Giménez, R. and Govers, G.: Flow detachment by concentrated flow on smooth and irregular beds, Soil Sci. Soc. Am. J., 66, 1475– 1483, 2002.
Govers, G., Vandaele, K., Desmet, P., Poesen, J., and Bunte, K.: The role of tillage in soil redistribution on hillslopes, Eur. J. Soil Sci., 45, 469–478, 1994.
Hairsine, P. B. and Rose, C. W.: Rainfall detachment and deposition: Sediment transport in the absence of flow-driven processes, Soil Sci. Soc. Am. J., 55, 320–324, 1991.
Hairsine, P. B., Moran, C. J., and Rose, C. W.: Recent developments regarding the influence of soil surface characteristics on overland flow and erosion, Aust. J. Soil Res., 30, 249–264, 1992. Hiederer, R. and Köchy, M.: Global Soil Organic Carbon Estimates
and the Harmonized World Soil Database, Publications Office of the EU, Luxenbourg, 2011.
Hooke, R. L.: On the history of humans as geomorphic agents, Ge-ology, 28, 843–846, 2000.
Hu, Y. and Kuhn, N. J.: Aggregates reduce transport distance of soil organic carbon: are our balances correct?, Biogeosciences, 11, 6209–6219, doi:10.5194/bg-11-6209-2014, 2014.
Hu, Y. X. and Kuhn, N. J.: Erosion-induced exposure of SOC to mineralization in aggregated sediment, Catena, 137, 517–525, 2016.
Hu, Y. X., Berhe, A. A., Fogel, M. L., Heckrath, G. J., and Kuhn, N. J.: Transport-distance specific SOC distribution: Does it skew erosion induced C fluxes?, Biogeochemistry, 128, 339– 351, 2016.
Kätterer, T. and Andrén, O.: The ICBM family of analytically solved models of soil carbon, nitrogen and microbial biomass dynamics descriptions and application examples, Ecol. Model., 136, 191–207, 2001.
Kirkels, F. M. S. A., Cammeraat, L. H., and Kuhn, N. J.: The fate of soil organic carbon upon erosion, transport and deposition in agricultural landscapes – A review of different concepts, Geo-morphology, 226, 94–105, 2014.
Lacoste, M., Viaud, V., Michot, D., and Walter, C.: Landscape-scale modelling of erosion processes and soil carbon dynamics under land-use and climate change in agroecosystems, Eur. J. Soil Sci., 66, 780–791, 2015.
Legout, C., Leguédois, S., and Le Bissonnais, Y.: Aggregate break-down dynamics under rainfall compared with aggregate stability measurements, Eur. J. Soil Sci., 56, 225–237, 2005.
Menzel, R. G.: Enrichment ratios for water quality modeling, in: CREAMS, edited by: Knisel, W. G., USDA Cons. Res. Rep., 1980.
Myers, N.: Gaia: An atlas of planet management, Anchor Press, Garden City, 1993.
94 F. Wilken et al.: Process-oriented modelling of erosion-induced carbon fluxes
Nash, J. E. and Sutcliffe, J. V.: River flow forecasting through con-ceptual models: Part I. A discussion of principles, J. Hydrol., 10, 282-290, 1970.
Oades, J. M.: Soil organic matter and structural stability: mecha-nisms and implications for management, Plant Soil, 76, 319–337, 1984.
Oades, J. M. and Waters, A. G.: Aggregate hierachy in soils, Aust. J. Soil Res., 29, 815–828, 1991.
Pimentel, D., Harvey, C., Resosudarmo, P., Sinclair, K., Kurz, D., McNair, M., Crist, S., Shpritz, L., Fitton, L., Saffouri, R., and Blair, R.: Environmental and economic costs of soil erosion and conservation benefits, Science, 267, 1117–1123, 1995.
Polyakov, V. and Lal, R.: Modeling soil organic matter dynamics as affected by soil water erosion, Environ. Int., 30, 547–556, 2004a. Polyakov, V. O. and Lal, R.: Soil erosion and carbon dynamics
un-der simulated rainfall, Soil Sci., 169, 590–599, 2004b.
Prechtel, A., von Lützow, M., Schneider, B. U., Bens, O., Bannick, C. G., Kögel-Knabner, I., and Hüttl, R. F.: Organic carbon in soils of Germany: Status quo and the need for new data to evaluate potentials and trends of soil carbon sequestration, J. Plant Nutr. Soil Sci., 172, 601–614, 2009.
Renard, K. G., Foster, G. R., Weesies, G. A., McCool, D. K., and Yoder, D. C.: Predicting soil erosion by water: A guide to conser-vation planning with the Revised Universal Soil Loss Equation (RUSLE), USDA-ARS, Washington DC, 1996.
Scheinost, A. C., Sinowski, W., and Auerswald, K.: Regionalization of soil water retention curves in a highly variable soilscape, I. De-veloping a new pedotransfer function, Geoderma, 78, 129–143, 1997.
Schiettecatte, W., Gabriels, D., Cornelis, W. M., and Hofman, G.: Enrichment of organic carbon in sediment transport by interrill and rill erosion processes, Soil Sci. Soc. Am. J., 72, 50–55, 2008. Sharpley, A. N.: The selective erosion of plant nutrients in runoff,
Soil Sci. Soc. Am. J., 49, 1527–1534, 1985.
Sinowski, W. and Auerswald, K.: Using relief parameters in a dis-criminant analysis to stratify geological areas with different spa-tial variability of soil properties, Geoderma, 89, 113–128, 1999. Sinowski, W., Scheinost, A. C., and Auerswald, K.: Regionalization of soil water retention curves in a highly variable soilscape, II. Comparison of regionalization procedures using a pedotransfer function, Geoderma, 78, 145–159, 1997.
Six, J., Conant, R. T., Paul, E. A., and Paustian, K.: Stabilization mechanisms of soil organic matter: implications for C-saturation of soils, Plant Soil, 241, 155–176, 2002.
Six, J., Bossuyt, H., Degryze, S., and Denef, K.: A history of re-search on the link between (micro)aggregates, soil biota, and soil organic matter dynamics, Soil Till. Res., 79, 7–31, 2004. Tisdall, J. M. and Oades, J. M.: Organic matter and water-stable
aggregates in soils, J. Soil Sci., 33, 141–163, 1982.
Van Hemelryck, H., Fiener, P., Van Oost, K., Govers, G., and Merckx, R.: The effect of soil redistribution on soil organic carbon: an experimental study, Biogeosciences, 7, 3971–3986, doi:10.5194/bg-7-3971-2010, 2010.
Van Hemelryck, H., Govers, G., Van Oost, K., and Merckx, R.: Evaluating the impact of soil redistribution on the in situ min-eralization of soil organic carbon, Earth Surf. Proc. Land., 36, 427–438, 2011.
Van Muysen, W., Govers, G., Van Oost, K., and Van Rompaey, A.: The effect of tillage depth, tillage speed, and soil condition on chisel tillage erosivity, J. Soil Water Conserv., 55, 2–11, 2000. Van Oost, K. and Govers, G.: Tillage erosion, in: Soil erosion in
Eu-rope, edited by: Boardman, J. and Poesen, J., Wiley, Chichester, 2006.
Van Oost, K., Beuselinck, L., Hairsine, P. B., and Govers, G.: Spa-tial evaluation of a multi-class sediment transport and deposition model, Earth Surf. Proc. Land., 29, 1027–1044, 2004.
Van Oost, K., Govers, G., Quine, T., Heckarth, G., Olesen, J. E., De Gryze, S., and Merckx, R.: Landscape-scale modeling of carbon cycling under the impact of soil redistribution: The role of tillage erosion, Global Biogeochem. Cy., 19, GB4014, doi:10.1029/2005GB002471, 2005a.
Van Oost, K., Quine, T., Govers, G., and Heckrath, G.: Modeling soil erosion induced carbon fluxes between soil and atmosphere on agricultural land using SPEROS-C, in: Advances in soil sci-ence. Soil erosion and carbon dynamics, edited by: Roose, E. J., Lal, R., Feller, C., Barthes, B., and Stewart, B. A., CRC Press, Boca Raton, 2005b.
Van Oost, K., Govers, G., De Alba, S., and Quine, T. A.: Tillage erosion: a review of controlling factors and implications for soil quality, Prog. Phys. Geogr., 30, 443–466, 2006.
Von Lützow, M., Kögel-Knabner, I., Ekschmitt, K., Flessa, H., Guggenberger, G., Matzner, E., and Marschner, B.: SOM frac-tionation methods: Relevance to functional pools and to stabi-lization mechanisms, Soil Biol. Biochem., 39, 2183–2207, 2007. Wang, X., Cammeraat, L. H., Wang, Z., Zhou, J., Govers, G., and Kalbitz, K.: Stability of organic matter in soils of the belgian loess belt upon erosion and deposition, Eur. J. Soil Sci., 64, 219– 228, 2013.
Wang, Z., Govers, G., Steegen, A., Clymans, W., Van den Putte, A., Langhans, C., Merckx, R., and Van Oost, K.: Catchment-scale carbon redistribution and delivery by water erosion in an inten-sively cultivated area, Geomorphology, 124, 65–74, 2010. Wilken, F., Fiener, P., and Van Oost, K.: Modelling a century of soil
redistribution processes and carbon delivery from small water-sheds using a multi-class sediment transport model, Earth Surf. Dynam., 5, 113–124, 2017.