CORRELATION OF EDUCATION AND SCIENCE IN MASTER’S PROGRAMME STUDENTS’ LABORATORY WORKS
Aivars Erins, Artis Linarts, Igors Klemenoks, Maris Knite
Riga Technical University, Institute of Technical Physics, 3/7 Paula Valdena str., Riga, LV-1048, Latvia
Abstract
Mastering academic subject (Physics and Chemistry in particular) is inextricably linked to laboratory works. However, the nature of these works should change upon academic progression. This article justifies necessity of such changes and thoroughly describes laboratory works performed by Master’s degree students in the RTU. In the course of these works, students are given an opportunity to perform in parallel their first scientific research. All of this, firstly, helps to understand the academic subject better; secondly, it gives student a chance to participate in real scientific experiments. This article also thoroughly reviews theoretical part of these laboratories works, whether it’s based on well known facts or original scientific research performed by the article’s authors. It describes in details manufacturing polyisoprene-nanostructured carbon composite, as well as a feasibility of using it as a pressure sensor. It provides a description of an original experimental plant for piezoresistivity effect research.
Key words: laboratory works, polyisoprene, carbon, nanocomposite, piezoresistivity effect
1. INTRODUCTION
The process of studying the surrounding world is tied with mastering sciences. This process begins at school where children get acquainted with the basics of Maths, Physics, and Chemistry. Even at such an early stage studying these subjects is not limited to just reading academic books. New experience is received via solving logical problems where a student has to apply theoretical knowledge gained before. Besides, conducting laboratory works is also very important. These teach a student not only to use different measurement tools (like at Physics classes) or new substances (like at Chemistry). Students learn to anticipate the process of a laboratory work; to plan obtaining particular results; they make consequent conclusions when gaining these results (or maybe without them).
Upon school graduation and entering a university, students continue mastering the natural laws, again involving lab works. However, unlike at school lab works, a student has to justify the experiment process theoretically and to analyse the results. Proceeding to Masters, a student closely approaches scientific research. Thus the lab works themselves must change.
In the Riga Technical University (RTU) Technical Physics Institute, Master’s level students get an opportunity to use scientific creativity while studying subjects like Physics and Physical Producing Methods of Nanomaterials or Physics of New Materials. During the lab works they are offered to produce new materials’ samples by themselves, examining their features afterwards. For instance, they may research the change of electrical resistance of the samples upon applying mechanical and/or chemical coercion, and to justify their possible utilization as pressure deformation or tension sensors, or as chemical sensors for organic compounds (‘electronic nose’). It doesn’t simply help to study the certain subject, yet also boosts students’ interest in scientific research in general.
The following article provides an example of several such lab works, in particular, “Polyisoprene-nanostructured carbon composite production” and “Polyisoprene-“Polyisoprene-nanostructured carbon composite as a pressure deformation sensor material”.
2. THEORETICAL PART
Recently, scientific literature has frequently involved articles describing production and research of the electrically conductive polymer composites (ECPC) which could serve as cheap and efficient sensory materials for different external coercions: pressure, tension, temperature change, etc. (Zavickis et al. 2011; Wang et al. 2011; Linarts, Barons & Knite 2014). The working principle of such sensors may be described in the following way. Electrically conductive micro-particles (for example, metal particles) are inserted into polymer matrix (isolator), serving as matrix’ filling medium. With certain concentrations of this filler in a non-conductive matrix, electrically conductive channels appear, i.e. the isolator becomes an electrical conductor. In other words, a phase transition of the second type (or percolation transition) occurs. The filling medium and the matrix have different elasticity modules; hence deforming such a percolation system deforms or tears its electrically conductive channels. As a result, the specific electrical resistance of the composite increases. Because of the matrix’ super elastic features, upon removal of the pressure it returns to its original state; consequently it also restores the structures of electrically conductive channels (to bigger or lesser extent). Moreover, electrical resistance of this ECPC depends on degree and kind of its deformation. If this effect (change of electrical resistance) can be observed upon metal compression, it is traditionally called piezoresistivity; if it is caused by tension, then it is called tensoresistivity. Dependent on features of materials used, such composite materials can be produced with required mechanical features and sensitivity (in accordance with their utilization).
Lately, ECPC with positive piezoresistivity, which despite logical assumptions demonstrate reversible increase of composite’s electrical resistance (Knite et al. 2009; Luheng, Tianhuai & Peng 2009; Wang & Cheng 2014), gain massive attention. In the Riga Technical University Technical Physics Institute laboratory, it has been found that such sensitive composite materials can be obtained by inserting certain concentration of high structured carbon into poly-isoprene matrix (rubber) (Knite et al. 2007). Thus obtained super elastic polyisoprene high structure carbon black composite are characterized by higher sensitivity to external coercion. Besides that, they are relatively simple in manufacturing.
3. LABORATORY WORK № 1. “POLYISOPRENE-NANOSTRUCTURED CARBON
COMPOSITE PRODUCTION”
3.1. Theoretical basis
Composite materials (CM) are heterogeneous artificially obtained materials which consist of two or more components with a defined surface boundary between them. One component can usually be considered a matrix (or binding medium), the rest – as filling medium. CM gain prominence since they obtain physical qualities which are not present in any individual component. Within the last decade, CM with polymer matrixes and nano-particle filling materials are being intensively studied. Ions, atoms and molecules of solid bodies (crystal-like or amorphous) are tied with ion, metallic or covalent bonds with energy significantly higher than heat fluctuations energy (U >> kT). Interaction between adjacent molecules in the polymers is relatively weak (U ~ kT). Hence, polymers’ molecular structures are not very stable and can be easily changed by external coercion (for instance, a mechanic one). Henceforth, by adding certain filling medium to the polymer, a material with sensory features can be obtained. By adding a certain amount of electrically conductive material (for instance, metal or carbon nanoparticles) to a polymer matrix, electrically conductive composite (ECC) can be produced. Its conductivity is enabled by a huge number of electrically conductive channels. This channels form a cluster which could be isotropic or anisotropic dependent on ECC manufacturing methods. Gradually increasing concentration of one component (filling medium), features of the whole system (composite) become typical for the features of this component. This phenomenon is called dual-component system percolation (Fig. 1).
Fig. 1. Electrically conductive composite before (“a” and “b”) and after (“c” and “d”) reaching percolation threshold
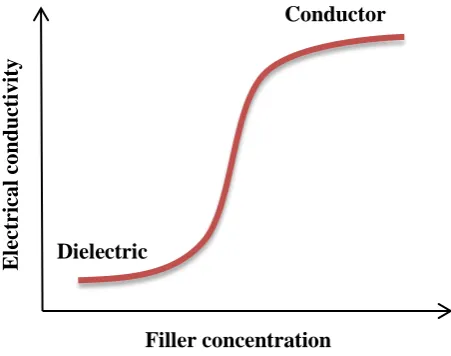
A most basic example of such a system would be a composite consisting of electrically conductive filling medium and non-conductive matrix. Electrical conductivity of such a component depends on filling medium concentration (Fig. 2).
Fig. 2. Dependence of composite’s electrical conductivity on filling medium concentration (electrically conductive filling medium, dielectric matrix)
Evidently, low concentration of component means composite’s electrical conductivity virtually equal to matrix’ conductivity, i.e. composite behaves as an isolator. Gradually increasing the concentration and reaching the certain value Vc, composite’s conductivity begins to increase. Further increase of concentration leads to conductivity growth (till the saturation stage), and the composite becomes a conductor. In scientific literature, filling medium concentration Vc is called critical (threshold) volumetric concentration of electric percolation (Staufer & Aharony 1992), and the respective condition of the composite – electric percolation transition. Size of Vc critical volumetric concentration is defined by shape and size of the filling medium particles, as well as the matrix itself. If filling medium volumetric concentration surpasses the critical (V > Vc), then specific electric current conductivity σ for ECC (within electric percolation transition area) will be function V
𝜎~(𝑉 − 𝑉𝑐)𝜏 , (1)
𝜏 – exponent value or electric percolation critical index. For a three-dimensional system the exponent is usually about 2 (𝜏≈ 2). However, a significant divergence between experiment and dependence (1) has been noticed. Especially if filling medium consists of carbon nanoparticles which might have several modifications: graphite, graphene, nanotubes (NT), fullerene (Fig. 3).
Filler concentration Dielectric
E
lect
ri
ca
l co
n
d
u
ct
iv
it
y
Conductor
Fig. 3. SEM images of hybrid PiCNT(4)CB(7) (left) and PiCNT(8)CB(3) (right) composites
There is no unified theory which could explain all the results of percolation transition experimental studies. Yet there are models providing relatively good compliance to some ECC models. Applying physical pressure to composite materials with filling medium concentration close to percolation transition concentration Vc, a sharp change of the electrical conductivity is registered. This enables using them as pressure sensors.
3.2. The experiment process
Sensor manufacturing technology and quantitative structure of all the utilized components had been acquired earlier during experiments carried out in the Riga Technical University Technical Physics Institute laboratory (Knite et al. 2011). For all the samples produced, correlation of electrical percolation curve and a type of electrically conductive filling agent and its dispersion was being established. For the nanocomposite composition and manufacturing method described below, a distinct piezo- and tensoresistive sensitivity was observed in the middle part of the percolation transition; as well as a positive piezoresistivity effect.
For nanocomposite manufacturing, polyisoprene rubber, whose consistence is shown in Table 1, is used. The filling agents shown in the table had been previously dispersed into polyisoprene rubber using cold rollers. Further, in addition to these components, nanostructured carbon is inserted into composite. The nanostructured carbon has especially high electrical conductivity (dependent on its concentration, obtained nanocomposite may have electrically insulating, electrically conductive or piezo-/ tensoresistive properties).
Table 1. Composite chemical composition
Component Composition, mass fraction
Natural polyisoprene rubber 100
sulphur 3,5
cyclohexyl-benzothiazole-sulfenamide 0,8
zinc oxide 5
stearic acid 1
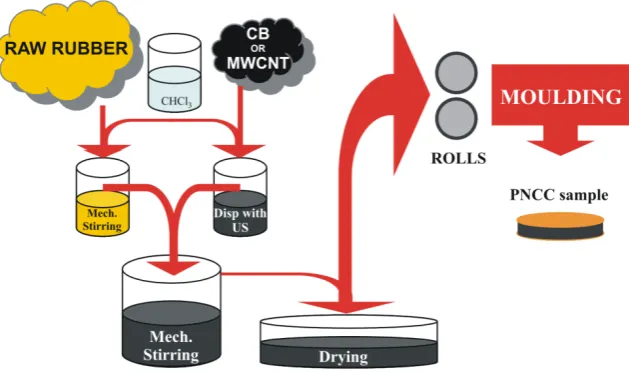
Manufacturing of polyisoprene-nanostructured carbon composite begins in dissolving polyisoprene rubber (mass 2,75 g) in chloroform (50 ml) (Fig. 4 (Knite & Linarts 2015)). Dissolving occurs in an enclosed conic bulb during constant mechanic stirring using magnetic mixer during 24 hours. 0,165 g of carbon nanoparticles previously dispersed in 25 ml of chloroform using ultra-sonic homogenizer (with a specific capacity of (1 W·5 min)/ml) are added into the bulb after the rubber is dissolved. The solution is being stirred for further 24 hours using magnetic mixer. Upon finish, the solution is poured into Petri dish and put into a drying over to evaporate chloroform entirely. Thus obtained nanocomposite film is additionally homogenized on mechanic rollers (without warming), using the smallest distance between rollers possible.
Fig. 4. The making schematics of the carbon filled rubber composite, using US dispersing in chloroform
Obtained polyisoprene composite is further used to produce piezoresistivity sensor of the given shape and size. Special injection mold is used for that. Nanocomposite is put there between two plates of copper foil. Mold is put into thermostatic hydraulic press. Optimal conditions of sample’s vulcanization: 15 min with 150 °С temperature and 30 atm pressure. Amount of nanocomposite necessary for sample manufacturing is defined according to sensor’s shape and size. In this project, a disc-shaped sample has been produced with 1 mm thickness and 18 mm diameter. So, the following formulas can be used:
𝑉 =𝜋𝐷4 2∙ 𝐻, (2)
where V – sample’s volume, D – sample’s diameter; Н – sample’s thickness and π – mathematical constant; and:
𝑚=𝑉 ∙ 𝜌, (3)
where m – sample’s mass, ρ – sample material density (𝜌= 1,10 𝑐𝑚𝑔3).
The obtained samples’ electrical resistance is further measured using Е6-13А teraommetr (or the МО-62 DC bridge or the В7-35 digital galvanometer in the universal mirror galvanometer mode can be used).
3.3. Project aims:
1. Producing polyisoprene-nanostructured carbon composite with carbon mass fraction of 10.
2. Producing samples with size D = 18 mm and H = 1 mm from this composite. 3. Checking electrical resistance of these samples.
4. LABORATORY WORK № 2. “POLYISOPRENE-NANOSTRUCTURED CARBON
COMPOSITE AS A PRESSURE DEFORMATION SENSOR MATERIAL”
4.1. Theoretical basis
As is well known, electrical resistance of sample R is a material ρ specific resistance and sample size function:
𝑅=𝜌𝑆𝑙 , (4)
where S – sample cross section; l – sample’s length (or height). Change of electrical resistance can cause sample’s physical dimensions’ change or material structure change (as a result, specific electrical resistance ρ changes). If these changes are caused by the sample compression, this effect is called piezoresistivity effect. It is a passive physical effect which must not be confused with piezoelectric effect, which is an active physical effect. In this case, upon material deformation by compression, uncompensated electrical discharge is induced within the material.
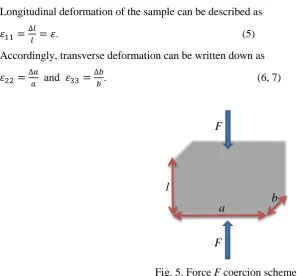
For isotropic material, mechanic deformation coercion effect on its electric features can be described the following way. E.g., this material is used to produce a sample with dimensions a; b and l. This sample is subjected to force F and elastic deformation ε (Fig. 5).
Longitudinal deformation of the sample can be described as
𝜀11=∆𝑙𝑙 =𝜀. (5)
Accordingly, transverse deformation can be written down as
𝜀22 =∆𝑎𝑎 and 𝜀33=∆𝑏𝑏. (6, 7)
Fig. 5. Force F coercion scheme
Considering that during such a deformation the material’s specific resistance is constant and equals ρ, the electrical resistance change can be described as
∆𝑅 =𝑎∙𝑏𝑙 ∆𝜌+𝑎∙𝑏𝑙 𝜌𝜀11−𝑎∙𝑏𝑙 𝜌𝜀22−𝑎∙𝑏𝑙 𝜌𝜀33=𝑎∙𝑏𝑙 ∆𝜌+𝑎∙𝑏𝜌 ∆𝑙 −𝑎𝜌∙𝑙2∙𝑏∆𝑎 −
𝜌∙𝑙
𝑎∙𝑏2∆𝑏 . (8) Dividing both sides of the expression by the formula (4), we get
∆𝑅
𝑅 =
∆𝜌
𝜌 +
∆𝑙
𝑙 −
∆𝑎
𝑎 −
∆𝑏
𝑏 . (9)
F
F
l
a
b
Considering that volume change can be expressed as
∆𝑉
𝑉 =𝜀11+𝜀22+𝜀33= ∆𝑙
𝑙 +
∆𝑎
𝑎 +
∆𝑏
𝑏, (10)
we obtain
∆𝑅
𝑅 =
∆𝜌
𝜌 + 2
∆𝑙 𝑙 − � ∆𝑙 𝑙 + ∆𝑎 𝑎 + ∆𝑏 𝑏�= ∆𝜌
𝜌 + 2𝜀 − ∆𝑉
𝑉 . (11)
According to Poisson’s ratio definition, within small deformations (Gonca & Shvabs 2011), sample’s volume change expresses dependence
∆𝑉
𝑉 = (1−2𝜗) ∆𝑙
𝑙 , (12)
where 𝜗 – Poisson’s ratio. Putting expression (12) into formula (11), we obtain
∆𝑅
𝑅 =
∆𝜌
𝜌 + (1 + 2𝜗)𝜀=�
∆𝜌
𝜌∙𝜀+ 1 + 2𝜗� 𝜀 =𝐾 ∙ 𝜀 , (13)
where К – Gauge factor (or strain factor) describes deformation sensor’s sensitivity. Evidently, К consists of two components. Component (1 + 2𝜗) describes sensor’s geometrical dimensions’ change, and component ∆𝜌
𝜌∙𝜀 – material’s specific resistance change. Most electrically conductive materials don’t
change their specific resistance upon deformation, so the second component can be neglected. In this case, with 𝜗 ≈ 0,5, Gauge factor equals 2.
Possibility of piezo- and tensoristive effect for this material can be checked experimentally. Considering force F coercion (Fig. 5), sample sizes after deformation (∗) can be expressed as
𝑙∗=𝑙 ∙(1 +𝜀) and 𝑆∗= 𝑆
(1+𝜀) , (14, 15)
where S – cross section square area, perpendicular to force F application direction. Putting (14) and (15) into formula (4), we obtain
𝑅∗=𝜌𝑙∗ 𝑆∗=𝜌
𝑙
𝑆(1 +𝜀)2 . (16)
Evidently, in this case electrical resistance has a characteristic squared relationship with relative deformation scale. If this condition is not addressed, then the piezo- or tensoresistivity effect takes place, and the specific electrical resistance will depend on a degree of deformation.
4.2. The experiment process
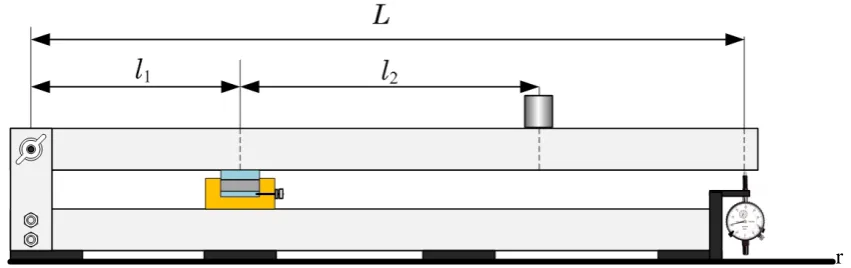
The experimental plant (Fig. 6) consists of mechanical part (for sample compression), pressure
r Fig. 6. Experimental plant for sample compression
micrometer (for relocation measurement), electrical parameters (voltage) measurement devices, and devices for registering and storing experimental data. Round or rectangular sample is placed into a special mould which is produced of dielectric and has sample’s shape and dimensions (Fig. 7).
Fig. 7. Sample compression mould
On the bottom of the mould, a metal plate is mounted and connected to an electric contact (in order to connect to the dc circuit. Degree of the mechanic coercion (compression) can be changed by shifting weight in the top part of the plant. Schematic force distribution upon sample compression is shown on Fig. 8.
Fig.8. Schematic force distribution upon sample compression
Using this scheme, it’s possible to register force momentum equilibrium condition relative to the plant rotation axis crossing point O:
𝐹𝑅∙ 𝑙1+𝐿𝑎𝑏𝑚𝑏∙ 𝑔𝑎2+𝐹𝑡∙ 𝐿=𝑚 ∙ 𝑔 ∙ 𝑙2+𝐿𝑏𝐿−𝑎𝑏 𝑚𝑏∙ 𝑔𝐿𝑏2−𝑎 , (17)
where 𝐿𝑏 – bar length; 𝑚𝑏 – bar mass; Ft – pressure micrometer resistance power; m – mass of the weight. Considering that FR = Fp (Fp – force to which the sample is subjected), we obtain
𝐹𝑝=𝑚𝑔𝑙2+
�𝐿𝑏−2𝑎�∙𝑚𝑏∙𝑔 2 −𝐹𝑡∙𝐿
𝑙1 . (18)
Change of sample’s thickness ∆h can be established by movement of the pressure micrometer ∆Н:
∆ℎ=𝑙1
𝐿∙ ∆𝐻 . (19)
To define the electrical resistance, a scheme shown on Fig. 9 is used.
Measuring sample’s tension and total tension (with ballast resistance), sample’s resistance can be calculated
𝑅𝑥 =𝑈0𝑈−𝑈𝑥𝑥∙ 𝑅𝑏 . (20)
Formula is true with Rv >> Rx, where Rv – voltmeter’s inner resistance (measurement uses voltmeter with Rv = 10 МΩ, which essentially exceeds the sample’s resistance).
Fig.9. Scheme for electrical parameters measurement (Rx – sample’s electrical resistance; Rb – ballast resistance in the bleeder)
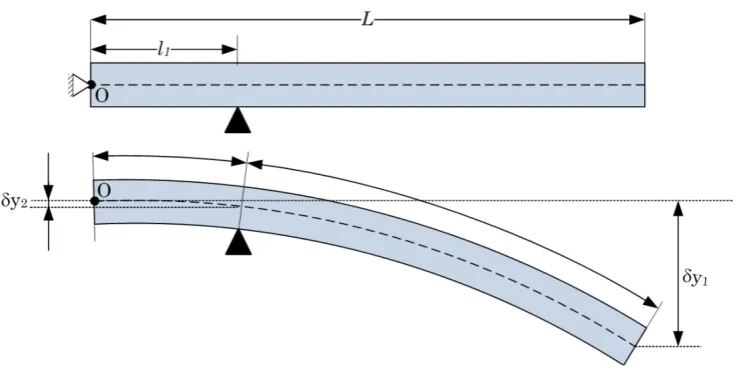
For the more precise sample deformation ∆h calculation, deformation of the bar has to be taken into account, i.e., ∆h value correction is necessary. Further, the necessary schemes, tables and formulas are provided.
Fig. 10. Correction taking into account bar deformation
Fig. 11. Bar deformation correction 𝛿𝑦1dependence on force 𝐹 =𝑚𝑔
Fig. 12. Bar deformation correction 𝛿𝑦2dependence on force 𝐹=𝑚𝑔
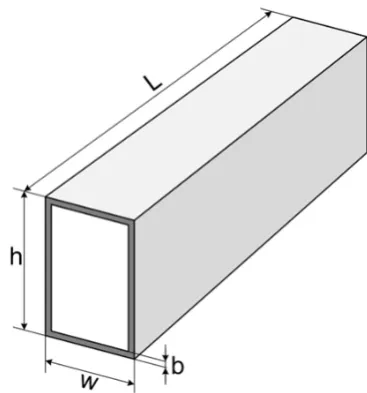
Fig. 13. Bar parameters (L = 86 cm; l1 = 12 cm; h = 60 mm; w = 30 mm; b = 2 mm and iron elasticity module E = 205 GPa)
Taking all these into account, sample’s deformation degree can be expressed as
∆ℎ=𝑙1
𝐿(∆𝐻 − 𝛿𝑦1) +𝛿𝑦2 . (21) 4.3. Project aims:
1. To show graphically the dependence of sample’s (ECC) electrical resistance on the load applied (on the mechanic stress in the sample; on the relative change of sample’s volume). Load should be gradually increased, and that gradually decreased.
2. To show the relaxation curves (relaxation lines) of the samples upon different physical loads. 3. To obtain approximation formulas for the registered graphic correlations.
5. CONCLUSIONS
The laboratory works described above are just a part of academic curriculum for the Master’s degree students in the Riga Technical University Technical Physics Institute These laboratory works can be easily diversified dependent on the specific aims. For instance, samples’ shapes can be changed; samples could be subjected to static or cyclic loads; their electrical resistance changes upon tension or compression deformation can be examined; samples could be put in vapours of different organic compounds. Aside from that, students are offered to define optimal concentration of filling medium experimentally. Rich opportunities for experiment diversity are also given by changing composite’s filling medium material change.
As experience demonstrates, such laboratory works don’t only help students to understand academic material better. They help students to get ready for further doctoral studies (where students will have to plan and perform such experiments by themselves); and, quite possibly, these will become the first steps in their own future scientific research.
ACKNOWLEDGMENTS
We'd like to express our gratitude to the Institute of Genaral Chemistry Engineering at RTU for the provided SEM photos (Fig. 3).
REFERENCES
Gonca, V & Shvabs, Y 2011, „Definition of Poisson’s ratio of elastomers”, Proc. of 10th Intern. Scientific Conf. „Engineerig for rural development”, Vol. 10, pp. 428 – 434.
Knite, M, Klemenoks, I, Sakale, G, Teteris, V & Zicans, J 2007, „Polyisoprene carbon nano composites for application in multifunctional sensors”, Journal of Alloys & Compounds, V434-435, pp. 850-853.
Knite, M, Ozols, K, Zavickis, J, Tupureina, V, Klemenoks, I & Orlovs, R 2009, „Elastomer – Carbon Nanotube Composites as Prospective Multifunctional Sensing Materials”, Journal of Nanoscience and Nanotechnology, V9, N6, pp. 3587-3592.
Knite, M, Zavickis, J, Teteris, V & Linarts, A 2011, „Polyisoprene-multi wall carbon nanotube composite structure for flexible pressure sensor application”, J.Nanosci.Nanotechnol., Nr. 11, pp. 8677-8681.
Knite, M & Linarts, A 2015, „Polymer/ Nanographite Composites for Mechanical Impact Sensing”, Chapter in book Graphene-Based Polymer Nanocomposites in Electronics, Springer, pp. 223-252, ISBN 978-3-319-13874-9.
Linarts, A, Barons, I & Knite, M 2014, „The Dependence of Piezoresistivity of Elastomer/Nanostructured carbon Composites on Dynamic Mechanical Load Frequency”, Proc. of
the 11th Intern. Conf. on Informatics in Control, Automation and Robotics (ICINCO 2014), pp. 416-420.
Luheng, W, Tianhuai, D & Peng, W 2009, „Influence of carbon black concentration on piezoresistivity for carbon-black-filled silicone rubber composite”, Carbon, Nr. 47, pp. 3151-3157.
Staufer, D & Aharony, A 1992, Introduction in to percolation theory, Taylor & Francis, Washington, DC.
Wang, L, Ma, F, Shi, Q, Liu, H & Wang, X 2011, „Study on compressive resistance creep and recovery of flexible pressure densitive material based on carbon black filled silicone rubber composite”,Sensors and Actuators, V165, Issue 2, pp. 38-42.
Wang, L & Cheng, L 2014, „Piezoresistive effect of carbon nanotube silicone-matrix composite”, Carbon, V71, pp.319-331.
Zavickis, J, Knite, M, Podins, G, Linarts, A & Orlovs, R 2011, „Polyisoprene – nanostructured carbon composite – a soft alternative for pressure sensor application”,Sensors and Actuators, A: Physical, V171, pp. 38-42.