Atmos. Meas. Tech., 6, 309–322, 2013 www.atmos-meas-tech.net/6/309/2013/ doi:10.5194/amt-6-309-2013
© Author(s) 2013. CC Attribution 3.0 License.
EGU Journal Logos (RGB)
Advances in
Geosciences
Open Access
Natural Hazards
and Earth System
Sciences
Open AccessAnnales
Geophysicae
Open AccessNonlinear Processes
in Geophysics
Open AccessAtmospheric
Chemistry
and Physics
Open AccessAtmospheric
Chemistry
and Physics
Open Access DiscussionsAtmospheric
Measurement
Techniques
Open AccessAtmospheric
Measurement
Techniques
Open Access DiscussionsBiogeosciences
Open Access Open Access
Biogeosciences
Discussions
Climate
of the Past
Open Access Open Access
Climate
of the Past
Discussions
Earth System
Dynamics
Open Access Open Access
Earth System
Dynamics
DiscussionsGeoscientific
Instrumentation
Methods and
Data Systems
Open Access
Geoscientific
Instrumentation
Methods and
Data Systems
Open Access DiscussionsGeoscientific
Model Development
Open Access Open Access
Geoscientific
Model Development
DiscussionsHydrology and
Earth System
Sciences
Open AccessHydrology and
Earth System
Sciences
Open Access DiscussionsOcean Science
Open Access Open Access
Ocean Science
Discussions
Solid Earth
Open Access Open Access
Solid Earth
DiscussionsThe Cryosphere
Open Access Open Access
The Cryosphere
Discussions
Natural Hazards
and Earth System
Sciences
Open Access
Discussions
An improved cirrus detection algorithm MeCiDA2 for SEVIRI
and its evaluation with MODIS
F. Ewald1,2, L. Bugliaro1, H. Mannstein1,*, and B. Mayer1,2
1Deutsches Zentrum f¨ur Luft- und Raumfahrt, Institut f¨ur Physik der Atmosph¨are, Oberpfaffenhofen, Germany 2Ludwig Maximilians Universit¨at, Institut f¨ur Meteorologie, Munich, Germany
*deceased
Correspondence to: F. Ewald ([email protected])
Received: 21 May 2012 – Published in Atmos. Meas. Tech. Discuss.: 1 August 2012 Revised: 31 December 2012 – Accepted: 3 January 2013 – Published: 11 February 2013
Abstract. In this study, a substantially improved version of
the Meteosat cirrus detection algorithm (MeCiDA2) will be presented, which now allows application to the full earth disc visible by the Meteosat satellite. As cirrus clouds have an influence on the radiation budget of the earth, their opti-cal properties and their global coverage has to be monitored at the global scale using instruments aboard geostationary satellites. Since MeCiDA was optimised for the area of Eu-rope only, various changes were necessary to handle the vari-able conditions found over the full Meteosat disc. Required changes include the consideration of the viewing angle de-pendency and of the sensitivity of the 9.7 µm channel to the ozone column. To this end, a correction is implemented that minimises the influence of the variability of the stratospheric ozone. The evaluation of the proposed improvements is car-ried out by using MeCiDA applied to MODIS (moderate res-olution imaging spectrometer) data to address viewing angle-dependent cirrus detection, and by additionally comparing it to the cloud optical properties MOD06 cirrus product. The new MeCiDA version detects less cirrus than the original one for latitudes larger than 40◦, but almost the same amount elsewhere. MeCiDA’s version for MODIS is more sensitive than that for SEVIRI (spinning enhanced visible and infrared imager) with cirrus occurrences higher by 10 %, and the new MeCiDA provides almost the same cirrus coverage (±0.1) as given by the cloud phase optical properties from MODIS for latitudes smaller than 50◦. Finally, the influence of sub-pixel clouds on the SEVIRI cirrus detection has been examined: more than 60 % of the undetected SEVIRI cirrus pixels have a cirrus coverage smaller than 0.5.
1 Introduction
Clouds, especially thin ice clouds, play an essential role in climate since they have have the ability to interact strongly with incoming and outgoing solar and terrestrial radiation. While thin ice clouds, so called cirrus clouds, reflect only a small portion of the incoming solar radiation, they are very effective at inhibiting the transmission of thermal radiation. Due to their location in the upper troposphere where low temperatures prevail, their emission of thermal radiation to space is small. Thus, the radiative forcing of cirrus clouds on the radiation balance at the top of atmosphere can be pos-itive and may lead to a warming of the earth–atmosphere system. Furthermore, cirrus clouds can be of anthropogenic origin. The warm and humid exhaust of aircraft in this part of the atmosphere can lead to the formation of condensation trails (contrails) (Schmidt, 1941; Appleman, 1953; Schu-mann, 1996) that can eventually evolve into extended cirrus clouds (Duda et al., 2004; Atlas et al., 2006; Minnis et al., 1998, 2004; Jensen et al., 1998; Unterstrasser and Gierens, 2010). Changes in cirrus cloud cover or optical and physical properties can thus contribute to climate change.
Table 1. Met-8/SEVIRI channel numbers and corresponding Terra/MODIS band numbers with effective channel central wavelengthsλc.
SEVIRI
Channel 1 2 3 4 5 6 7 8 9 10 11 12
λc/µm 0.64 0.81 1.64 3.92 6.25 7.35 8.70 9.66 10.8 12.0 13.4 0.75
MODIS
Channel 1 2 6 21–22 27 28 29 30 31 32 33
λc/µm 0.646 0.857 1.629 3.960 6.752 7.334 8.518 9.737 11.017 12.032 13.359
(Vaughan et al., 2004). Retrievals of cloud properties de-scribed by Schl¨ussel et al. (2005) also exist for the novel infrared atmospheric sounding interferometer (IASI), which have been reviewed by Lavanant et al. (2011) and Stuben-rauch et al. (2010b). However, sounders have the disad-vantage of a coarse spatial resolution, while lidars have a very limited spatial coverage due to their small footprint size. Moreover, polar orbiting platforms do not allow for the investigation of diurnal cycles of cirrus cloud cover-age and properties. In contrast, passive optical instruments aboard geostationary satellites offer the possibility to in-vestigate the diurnal cycles of clouds because of their high repeat cycle (usually between 5 and 30 min) and their al-most global spatial coverage. Because of this, the MeCiDA algorithm (Meteosat cirrus detection algorithm) was devel-oped in Krebs et al. (2007) for application to MSG/SEVIRI (Meteosat second generation/spinning enhanced visible and infrared imager) (Sect. 2.1). This dedicated cirrus detec-tion scheme uses exclusively the seven thermal channels of MSG/SEVIRI and employs morphological and multi-spectral threshold techniques to infer the presence of cirrus cloud inside MSG/SEVIRI pixels (Sect. 3.1). However, this algorithm has been developed and tuned for central Europe so that its global applicability is not guaranteed. In particu-lar, the scheme does not contain any explicit viewing angle dependency and it has shown to be too sensitive to ozone properties due to the use of the MSG/SEVIRI channel cen-tred at 9.7 µm (see Sect. 4.1). During studies of the difference in cirrus coverage between the Northern and Southern Hemi-sphere far too high values for the cirrus coverage over the South Atlantic have been observed. Since this artefact leads to unrealistic overcast situations over large areas, its cause needs to be investigated in-depth.
To overcome these deficiencies, we have derived the func-tion of the viewing angle dependency starting from an ex-haustive radiative transfer simulation dataset (Sect. 4.2), and we have estimated the impact of stratospheric ozone amount on brightness temperatures measured at a wavelength of 9.7 µm (Sect. 4.3). To test the impact of these changes we have made extensive use of MODIS (moderate reso-lution imaging spectrometer) data and products. First, we have adapted and applied MeCiDA to the MODIS instru-ment aboard the polar orbiting Terra satellite (Sect. 5.1). This
enables us to compare the outcome of the same algorithm when applied to different sensors with different viewing an-gle geometries. On the other hand, we have compared cirrus cover maps derived from MeCiDA before and after the mod-ifications to an independent cirrus cloud product on MODIS (the cloud phase optical properties) (Sect. 3.2). The results are illustrated in Sect. 6.
2 Instruments
The SEVIRI radiometer aboard the geostationary Meteosat second generation (MSG) satellite and the MODIS instru-ment aboard the polar orbiting Terra and Aqua space-craft provide complementary information about clouds and their optical and microphysical properties. In particular, MODIS has 36 spectral channels with high spatial resolu-tion (≤1000 m) and provides global coverage of the earth every one or two days with a repeat cycle of 16 days. In con-trast, SEVIRI has a high temporal resolution (≤15 min) but a coarser spatial resolution and fewer spectral channels. De-tailed characteristics of the two sensors are given in the next two subsections.
2.1 SEVIRI
2.2 MODIS
The moderate resolution imaging spectrometer MODIS pro-vides high radiometric sensitivity (12 bit) in 36 spectral bands ranging from 0.4 to 14.4 µm. Two solar bands (bands 1–2) are imaged at a nominal resolution of 250 m at nadir, five solar bands (bands 3–7) at 500 m, and the remaining 29 bands (bands 8–36) at 1 km. The MODIS bands corre-sponding to SEVIRI’s channels are shown in Table 1. A ±55-degree scanning pattern at the orbit height of 705 km achieves a 2330 km wide swath and provides global coverage every one to two days. MODIS is one of the key instruments aboard the polar orbiting sun-synchronous Earth observing system (EOS) spacecraft Terra and Aqua. Terra (EOS AM-1), launched December 1999, is the morning satellite with an equator descending node crossing time of 10:30 UTC, while Aqua (EOS PM-1), launched May 2002, is the after-noon satellite with an equator ascending node crossing time of 13:30 UTC. In the following study we used the MODIS calibrated L1B radiance data (MOD02) with a horizontal res-olution of 1 km.
3 Detection of cirrus clouds
Cirrus cloud detection by means of passive imagers is a del-icate task. The main reason is that cirrus often shows very low optical thickness and is hardly visible in solar channels over bright surfaces. At the same time, since its high trans-missivity (and low etrans-missivity) produces brightness tempera-tures that are a mixture of those from the surface and from the clouds, cirrus is difficult to detect in thermal channels as well. In contrast, optically thick water clouds are opaque and the surface albedo/temperature is irrelevant. Thus, advanced techniques must be employed to detect cirrus clouds. In this section we give an overview of two algorithms. The first one is the day- and nighttime Meteosat cirrus detection algorithm MeCiDA that has been developed by Krebs et al. (2007) to extract information about cirrus cloud contamination from thermal SEVIRI channels over central Europe. The second algorithm has been developed for application to MODIS by the NASA/MODIS team. Unlike the MeCiDA algorithm, the MODIS product cloud phase optical properties CPO is lim-ited to daytime use only.
3.1 SEVIRI: MeCiDA
The Meteosat cirrus detection algorithm MeCiDA (Krebs et al., 2007) was developed to analyse the influence of air traffic on the diurnal cycle of cirrus clouds over central Eu-rope. Please notice that in Krebs et al. (2007) and this paper, a cirrus cloud is any cloud whose topmost layer is composed of ice crystals. This means that not only thin cirrus clouds belong to this category but also cumuli and deep convec-tive clouds with iced tops. This is in contrast to the synoptic
definition of cirrus being only a thin ice cloud. As several studies have shown cirrus clouds are often closely connected with or even overlapping deep convection. However, passive remote sensing methods in the infrared from above the cloud struggle to separate cirrus clouds from iced tops of deep con-vection, just like deep convection leads to an underestima-tion of cirrus cover in ground-based observaunderestima-tions. Since mi-crowave measurements have shown that it remains hard to screen out deep convection in cirrus cloud coverage with ex-isting IR methods (Evans et al., 1998; Hong et al., 2005), we continued with the definition of Krebs et al. (2007). The algorithm consists of six independent tests whose results are merged into one single cirrus mask (see Table 2 for an overview). Each test is considered as a stand-alone cirrus de-tection algorithm and tries to identify both thin and thick cirrus, even in the presence of an underlying water cloud. MeCiDA decides whether a SEVIRI pixel is cirrus covered by means of several threshold and morphological tests based on thermal channels alone. Therefore it enables the contin-uous monitoring of cirrus coverage. There are two differ-ent test groups, the multi-spectral threshold tests and the morphological tests. Tests 1–3 and 6 belong to the first test group: they adopt brightness temperature differences (BTD) between various channel pairs to detect thin cirrus layers. Additional constraints on brightness temperatures (BT) or brightness temperature difference ensure that also very cold clouds and thick cirrus clouds are detected. Despite their ba-sic similarity, Tests 1–3 and Test 6 differ in two details (see Table 2):
– To enable a most general application, Tests 1–3 use
so-called corrected brightness temperature differences: to produce these corrected BTDs the brightness tempera-ture difference of the underlying featempera-ture (ground or wa-ter cloud) is subtracted from the measured brightness temperature difference. This difference is estimated us-ing the warmest pixel in the neighbourhood as described in Krebs et al. (2007). Test 6 is not equipped with such a mechanism;
– If the pixels pointed at by the BTD test represent clouds
whose tops are located in the upper troposphere they must be visible in one of the two SEVIRI water vapour channels; this additional constraint is implemented by means of a particular threshold test applied to a water vapour BT in Tests 1–3. Test 6 uses to this end a some-what simpler BT test on the CO2channel located around
13.4 µm.
These differences play an important role when analysing the performance of these tests.
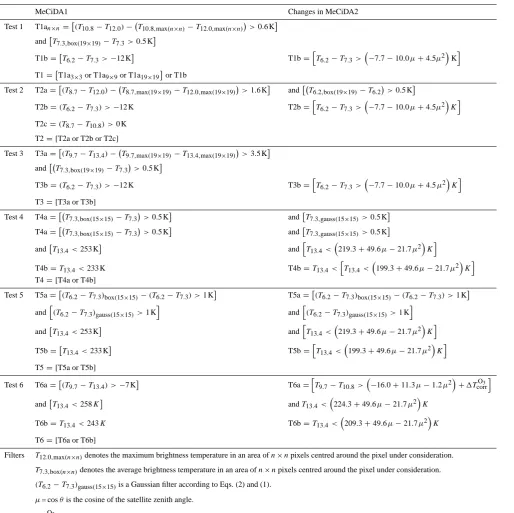
Table 2. Summary of the six cirrus tests and explanation of the filters used for the MeCiDA from Krebs et al. (2007) (called here MeCiDA1) and changes introduced in the revised cirrus tests that form the current version of the algorithm (called here MeCiDA2). Each individual cirrus test is contributing to the resulting cirrus mask.
MeCiDA1 Changes in MeCiDA2
Test 1 T1an×n=(T10.8−T12.0)− T10.8,max(n×n)−T12.0,max(n×n)>0.6 K
and
T7.3,box(19×19)−T7.3>0.5 K
T1b=
T6.2−T7.3>−12 K
T1b= h
T6.2−T7.3>
−7.7−10.0µ+4.5µ2
K i
T1=
T1a3×3or T1a9×9or T1a19×19
or T1b
Test 2 T2a=
(T8.7−T12.0)− T8.7,max(19×19)−T12.0,max(19×19)>1.6 K andT6.2,box(19×19)−T6.2>0.5 K
T2b=(T6.2−T7.3) >−12 K T2b=hT6.2−T7.3>−7.7−10.0µ+4.5µ2Ki
T2c=(T8.7−T10.8) >0 K
T2= [T2a or T2b or T2c]
Test 3 T3a=
(T9.7−T13.4)− T9.7,max(19×19)−T13.4,max(19×19) >3.5 K
and
T7.3,box(19×19)−T7.3 >0.5 K
T3b=(T6.2−T7.3) >−12 K T3b=hT6.2−T7.3>−7.7−10.0µ+4.5µ2Ki
T3= [T3a or T3b]
Test 4 T4a=
T7.3,box(15×15)−T7.3 >0.5 K
and
T7.3,gauss(15×15)>0.5 K
T4a=
T7.3,box(15×15)−T7.3 >0.5 K
and
T7.3,gauss(15×15)>0.5 K
and
T13.4<253 K
andhT13.4<219.3+49.6µ−21.7µ2Ki
T4b=T13.4<233 K T4b=T13.4< h
T13.4<
199.3+49.6µ−21.7µ2
K i
T4= [T4a or T4b]
Test 5 T5a=
(T6.2−T7.3)box(15×15)−(T6.2−T7.3) >1 K
T5a=
(T6.2−T7.3)box(15×15)−(T6.2−T7.3) >1 K
andh(T6.2−T7.3)gauss(15×15)>1 Ki andh(T6.2−T7.3)gauss(15×15)>1 Ki
and
T13.4<253 K
and h
T13.4<
219.3+49.6µ−21.7µ2
K i
T5b=
T13.4<233 K T5b= h
T13.4<
199.3+49.6µ−21.7µ2
K i
T5= [T5a or T5b]
Test 6 T6a=
(T9.7−T13.4) >−7 K
T6a= h
T9.7−T10.8>
−16.0+11.3µ−1.2µ2
+1TcorrO3 i
and
T13.4<258K andT13.4<
224.3+49.6µ−21.7µ2
K
T6b=T13.4<243K T6b=T13.4<
209.3+49.6µ−21.7µ2
K
T6= [T6a or T6b]
Filters T12.0,max(n×n)denotes the maximum brightness temperature in an area ofn×npixels centred around the pixel under consideration.
T7.3,box(n×n)denotes the average brightness temperature in an area ofn×npixels centred around the pixel under consideration.
(T6.2−T7.3)gauss(15×15)is a Gaussian filter according to Eqs. (2) and (1).
µ= cosθis the cosine of the satellite zenith angle.
1TcorrO3 is computed according to Sect. 4.3.
various high-pass filters are applied to extract information about the so-called “local standard deviation”. The corre-sponding local deviation filter operation reads as
gi,j = q
fi,j K−fi,j 2
K, (1)
Fig. 1. Sample cirrus products for 11 January 2009, 12:00 UTC, west of Spain/Portugal. (a) Cirrus mask from MoCiDA2 applied to the MSG/SEVIRI slot closest in time. (b) Difference between the MoCiDA2 and the CPO cirrus masks (both extracted from MODIS data): red and blue identify cirrus pixels that are detected by CPO or MoCiDA2 alone, white means cirrus pixels that are detected by both algorithms, while grey corresponds to cirrus free pixels.
K(x, y)= 1
N exp −
x2+y2
2· s 4
2 !
, (2)
whereN is a factor that normalizes the sum of all kernel values to unity,sis the kernel size (an odd number) which we set to 15 for our application, andxandyare in the range from−(s −1)/2 to +(s−1)/2.
Figure 1 shows an example of MeCiDA cirrus mask (panel a) for a MODIS granule acquired on 11 January 2009 at 12:00 UTC. A false colour composite using MODIS band 1, band 2 and the inverted band 31 (see Table 1) is depicted in Fig. 2, in MSG/SEVIRI projection. This chan-nel combination has been selected for the RGB because it allows a visual discrimination of clouds: low clouds exhibit a yellow colour, thick high clouds are white and thin ice clouds are violet. This is useful for testing the plausibility of the cirrus masks produced by the algorithms. In this case, MeCiDA produces an accurate cirrus distribution. All the cir-rus clouds in the northern part of the picture (Fig. 1) are also visible in the RGB (Fig. 2). However, in the lower right cor-ner MeCiDA detects a cirrus cloud that cannot be identified in the RGB.
3.2 MODIS: CPO
The cloud phase optical properties (CPO) is a scientific dataset contained in the operational MODIS cloud retrieval (product name MOD06 for MODIS Terra) which is derived from MODIS radiance data. This dataset combines informa-tion from visible and thermal MODIS bands to infer cloud phase. It is the basis for the derivation of cloud optical thick-ness and cloud effective radius and is described in Platnick et al. (2003). Its structure is quite elaborate: it combines cloud mask results (Ackerman et al., 1998) with a bispec-tral thermal algorithm and a shortwave infrared algorithm. The bispectral algorithm (Baum et al., 2000) exploits the stronger absorption of radiation by ice with respect to water at 11 µm when compared to 8.5 µm. The shortwave infrared algorithm consists of threshold tests applied to the ratio of
Fig. 2. MODIS false colour composite in MSG/SEVIRI projection. For 11 January 2009, 12:00 UTC, west of Spain/Portugal.
a near infrared channel (1.61 or 2.13 µm) to a shortwave in-frared channel (0.65, 0.86 or 1.24 µm, depending on surface type). At the near infrared wavelengths, absorption of radi-ation by water and ice particles takes place as a function of thermodynamic phase and particle radius while at the shorter wavelengths only scattering matters. The “bispectral thermal algorithm” provides an initial phase determination and serves as fallback for the “shortwave infrared algorithm”, which is available with a spatial resolution of 1 km×1 km. The cloud phase optical properties offers a sophisticated detection of cloud phase during daytime, though the phase discrimination for optically thin cirrus and supercooled water drops remains problematic (Platnick et al., 2003) as with other algorithms relying on passive instruments.
4 Improved cirrus detection with SEVIRI
4.1 Deficiencies of MeCiDA1
100 %. This unrealistic behaviour could be identified to be a failure of Test 6 in this region due to its dependency on the ozone channel located at 9.7 µm and the presence of the ozone hole and the following reduction of ozone at mid-latitudes, which is a typical phenomenon for Southern Hemi-sphere spring. This illustrates the fact that MeCiDA had been developed for central Europe and was not directly applicable to other regions. Another related issue is the lack of a view-ing angle dependency of the thresholds used in the tests. This was due again to the fact that the original algorithm had been tested and tuned for central Europe where the SEVIRI view-ing angle ranges approximately between 50 and 65◦.
4.2 Viewing angle dependency
The atmospheric path of radiation emitted by the earth– atmosphere system increases with satellite viewing angle, i.e. when regions closer to the horizon are observed. Because of the presence of (weak or strong) gas absorption bands in all the thermal channels, the measured BTs decrease with satellite viewing angle because the path length for radiation is longer. Absorption of radiation from warm layers of the at-mosphere is intensified along the line of sight as well as the emission of radiation from colder layers of the atmosphere (limb darkening). This effect mainly affects the BT tests of MeCiDA but has not been considered up to now. Tests 1– 3 use corrected BTDs and are less affected since the sub-traction of the BTD of the underlying or surrounding fea-ture from the measured BTDs partly accounts for this effect. Test 6 also belongs to the BTD test group (see Sect. 3.1) but will be analysed in more detail in Sect. 4.3 due to its ozone dependency (see Sect. 4.1).
In order to correctly take into account the viewing an-gle dependency, the extensive radiative transfer simulation dataset has been used, which was also employed during the development of MeCiDA (see also Krebs et al., 2007, Sect. 2.2). It comprises detailed radiative transfer calcula-tions based on random variation of all relevant input data to cover a wide range of possible conditions. The details of ra-diative transfer calculations performed with the libRadtran (library for radiative transfer) package (Mayer and Kylling, 2005) can be found in Krebs et al. (2007).
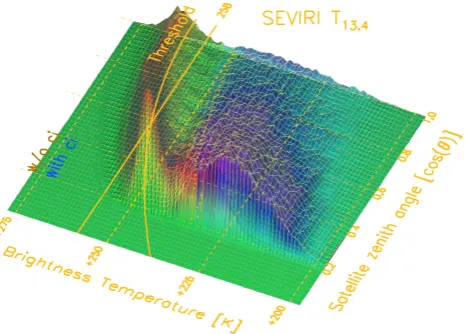
In order to determine viewing angle dependent thresholds, for the BT and BTDs used in the MeCiDA tests, we com-puted the two-dimensional histogram of the BTs of these channels or channel combinations as a function of the co-sine of the satellite zenith angleµ= cosθ. Figure 3 shows an example for the channel at 13.4 µm. The red “ridge” in this plot corresponds to situations without cirrus clouds, while the blue “ridge” corresponds to situations with cirrus clouds. Of course, the absence of cirrus is mirrored in high BTs but the decrease of these cloudless BTs with increasing satel-lite zenith angle is not negligible. The determination of new, angle-dependent thresholds was done for eachµseparately, as described in the following: for each µ contained in the
Fig. 3. 2D-histogram of simulated BT of the SEVIRI channel cen-tred at 13.4 µm as a function of the cosine of the satellite zenith angleµ= cosθ. In addition, the fixed threshold used in MeCiDA Test 6 of 258 K is plotted together with the newµdependent thresh-old function.
simulations, we approximated the red and blue “ridge” in Fig. 3 by means of two Gaussian fits. The mean values of these two Gaussian curves mark the “baseline” of both BT distributions. Their mean value lies always within the trough between the red and blue “ridge” and serves as a separa-tion between both distribusepara-tions. Finally, a quadratic funcsepara-tion T (µ)=a µ2+b µ+cwas fitted to these separating mean val-ues. This fitted functionT (µ)represents the desired satellite viewing angle dependent threshold function.
Since MeCiDA was originally tuned for central Europe (Krebs et al., 2007) where it proved to be accurate, our inten-tion was to keep its performance over this region unchanged. Thus, an offset value was calculated such that the value of the quadratic functionT (µ)determined above atµ≈0.5, corre-sponding to the approximate meanµvalue for this region, was shifted to the original value given in Krebs et al. (2007). For all other values ofµwe applied a scaling factor to this shift since the curvature ofT (µ)varies as a function ofµ. This scaling factor was calculated by taking the ratio of the spread between the red and blue “ridge” atµand the spread atµ= 0.5. This procedure guarantees the continuity between the old and the new algorithm over Europe with simultaneous consideration of a proper differentiation between scenes with and without cirrus for other regions.
This way, all “simple” threshold tests in MeCiDA that do not use corrected BTDs, but simple BTDs or BTs, could be modified to take into account the satellite viewing angle de-pendency. The results are displayed in Table 2 together with the original values of the thresholds.
4.3 Cirrus detection with the 9.7 µm SEVIRI channel
constant threshold employed in this test is not capable to distinguish between cirrus and cirrus free pixels during the course of the year. In fact, the threshold should take into ac-count the annual cycle of ozone since ozone concentrations (and vertical temperature profiles) affect the BT at 9.7 µm. This effect is exemplified by the consideration of this BTD over a region in the South Atlantic located between 45–55◦S, 45–10◦W, called SAR in the following, as shown in Fig. 4. To this end, MeCiDA Tests 1–5 were applied to all the avail-able time slots in the year 2007. While MeCiDA Test 6 turned out to be unreliable in this region, the remaining tests proved to yield low false alarm rates such that they could be used to roughly determine which pixels are cirrus covered and which ones are not. Using MeCiDA Tests 1–5 to separate between cloudy and cloudless pixels, we derivedT9.7−T13.4for
pix-els with and without cirrus and computed the spatial aver-ages for the SAR region. Both cirrus covered and cirrus free BTDs are plotted in Fig. 4. The two curves are separated by approximately 5 K and show a pronounced annual cycle of approximately 5 K. This effect is sufficient to produce mis-detections at the beginning and at the end of the year in this region (see threshold line in Fig. 4).
The observed annual cycle is produced by both the ozone and the CO2channels, i.e. the 9.7 µm and the 13.4 µm
chan-nels. The channel at 9.7 µm differs from all other thermal channels in that the main part of the absorber gas ozone af-fecting measurements in this spectral interval is located in the stratosphere, i.e. above the clouds, especially also above the cirrus clouds. Thus, while water vapour, for instance, be-comes almost irrelevant in the 10.8 µm channel when a high cloud is present in the atmosphere, the ozone concentration is still crucial for the interpretation of the ozone channel measurement.
During the distinct stratospheric warming over the SAR region, starting in southern spring at the onset of the ozone destruction by the exposure to sunlight, one can observe con-siderable spikes in 9.7 µm temperatures. High ozone concen-trations prevalent at that time lead to higher BTs in this chan-nel in the presence of a cirrus cloud since the ozone layer is located in a part of the stratosphere with higher tempera-tures than the cirrus cloud top temperature. In contrast, with the presence of low clouds or in the cloud free case, an in-creased ozone concentration leads to lower temperatures in this channel since stratospheric ozone layer temperatures are lower than near ground temperatures. Using again the set of radiative transfer simulations described in Sect. 4.2, we show that a variability of the ozone column by ±50 DU causes variability in brightness temperature of±5 K in the SEVIRI 9.7 µm channel. According to Kurzeja (1984), plan-etary waves at high latitudes are responsible for a variation of the ozone column of up to±60 DU. The mean annual cy-cle of ozone lies also in this range (Jiang et al., 2008a,b). The very low temperatures of the ozone layer in polar win-ter also have a cooling effect on the ozone channel. Finally, these effects are enhanced close to the SEVIRI horizon due
Fig. 4. Mean daily BTDT9.7−T13.4for those SEVIRI pixels that have been detected as cirrus covered (blue) or cirrus free (red) by MeCiDA Tests 1–5 over SAR as a function of time during the year 2007. Grey curves represent the same BTD but with the full tempo-ral resolution of 15 min.
to the slant view of the satellite. The 13.4 µm channel also presents an annual cycle, but to a lower extent than the ozone channel. The CO2gas is well-mixed in the troposphere such
that the 13.4 µm channel temperatures are less sensitive to air temperature changes in confined atmospheric layers like the stratosphere. The 13.4 µm BTs over optically-thick cir-rus clouds fluctuate between 240 K in summer and 225 K in winter, which can be assigned solely to changes in atmo-sphere temperatures as there is no significant fluctuation in CO2concentrations.
Since we wanted to keep the ozone channel at 9.7 µm in our detection algorithm in order to maintain a broad vari-ety of cirrus tests in MeCiDA, we decided to modify Test 6a in such a way as to produce a larger temperature difference between the cirrus covered and the cirrus free case that is in-dependent of time of the year. Moreover, the contribution of test 6 to the overall cirrus cloud coverage is quite significant (compare Krebs et al., 2007, Fig. 12). Since the continuity in detection performance over europe was one of the main ob-jectives of this study, Test 6 was also included in the new algorithm (MeCiDA2). To this end, the CO2 channel was
replaced with the 10.8 µm channel and the channel combi-nationT9.7−T10.8was selected. Although this BTD shows
a pronounced annual cycle for both cirrus free and cirrus covered pixels (see Fig. 5a), for cirrus contaminated obser-vations this is mainly produced by the ozone channel alone since cirrus measurements in the atmospheric window chan-nel centred at 10.8 µm have a moderate dependency on time of the year between 245 K in summer and 235 K in winter. The result of this substitution is plotted in Fig. 5a as a func-tion of day of the year averaged over the SAR region in 2007 for both cirrus and cirrus free pixels (again obtained from MeCiDA Tests 1–5).
Fig. 5. (a) Daily mean ofT9.7−T10.8for MeCiDA Tests 1–5 cir-rus clouds (blue) and circir-rus free pixels (red) averaged over the SAR region as a function of day of the year in 2007. (b) Daily mean of T9.7−T10.8after correction of the ozone annual cycle for MeCiDA Tests 1–5 cirrus clouds (blue) and cirrus free pixels (red) averaged over the SAR region as a function of day of the year in 2007. Grey curves represent the same BTDs but with the full temporal resolu-tion of 15 min.
cirrus clouds and making it easier to differentiate between cirrus covered and cirrus free pixels. Second, to mitigate the effect of varying ozone concentrations on this channel com-bination, a correction was added by considering very cold (thick) cirrus pixels with 10.8 µm brightness temperatures T10.8 smaller than 238 K. This value for an average
view-ing angle over central Europe (µ= 0.5) is adapted to other viewing angles in the same way like the other tests (Table 2, Test 6a). In the case of cold cirrus clouds, theT9.7−T10.8
is a proxy for the influence of stratospheric ozone on 9.7 µm channel measurements and can be used to reduce the effect of the annual cycle of ozone onT9.7measurements, i.e. to
pro-duce a correction term1TO3
corrto be added to theT9.7
bright-ness temperature.
We proceed like this: first, all pixels with T10.8<
(230.1 + 17.3µ−6.4µ2) K are marked. This threshold was determined using the same method as in Sect. 4.2 and corre-sponds toT10.8<238 K over Europe. Then, connected cloud
pixels are identified and theirT9.7−T10.8temperature
differ-ences are averaged into a single value. To obtain an upper
estimate for the ozone influence onT9.7only cloud clusters
(i.e. blobs of connected cloud pixels) with a difference value above the mean difference value of T9.7−T10.8 in the
cor-responding 10◦×10◦latitude/longitude region are incorpo-rated in this average. This average then represents the1TO3
corr
for the corresponding cloud patch. In order to guarantee tem-porally stable results and to reduce false corrections, too small cloud objects (with less than 450 pixels, which cor-responds to approx. 5000 km2on SEVIRI over Europe) are excluded. In addition, overshooting Cb tops are detected and filtered out using T6.2−T10.8>0 K (Tjemkes et al., 1997).
Overshooting Cb tops are not suitable for this technique due to their vertical extent into the lower stratosphere, which would partly mask the effect of ozone and cause a diurnal cycle.
Since in every satellite scene only few pixels, if any, will satisfy these conditions, the correction value that is avail-able only at single spots is then interpolated and extrapolated to the full area of observation. This is done by anisotropic kriging to take into account the zonal character of the ozone field. If no such cold cirrus are present, an empirical value of 1TO3
corr= 4 K is used. After application of this correction, the
BTD first shown in Fig. 5a then looks like in Fig. 5b. Finally, viewing angle dependency was analysed in anal-ogy to Sect. 4.2 to obtain the final revised version of Test 6a as in Table 2.
In the following, the original version of MeCiDA from Krebs et al. (2007) will be called MeCiDA1 while the new version described here will be referred to as MeCiDA2.
5 Evaluation
Our methodology to evaluate the changes introduced in the original MeCiDA algorithm (MeCiDA1) is twofold. On one side, the MODIS product CPO (see Sect. 3.2) is used as inde-pendent source of information. It is based on different physi-cal principles than MeCiDA (it relies on solar channels, etc.) and uses data from a sensor aboard a polar orbiting satellite that, thus, sees the earth under different viewing conditions. Thus, comparison of MeCiDA1 and MeCiDA2 cirrus masks with CPO will give insight into the performance of the old and new MeCiDA version. On the other side, to get a more detailed information about the effect produced by the con-sideration of the satellite viewing dependency we decided to adapt MeCiDA to MODIS. This way, the same algorithm could be applied to cloud fields that were observed under dif-ferent angles by the two sensors, the geostationary SEVIRI and the polar orbiting MODIS.
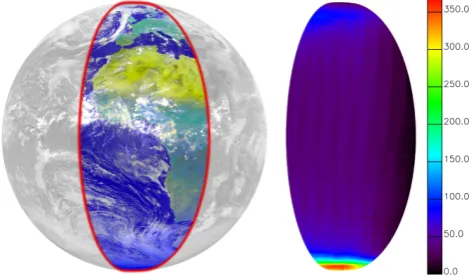
Fig. 6. Selected region for comparison between cirrus products (left panel). Numbers of synchronous observations from SEVIRI and MODIS in January 2008 (right panel).
latitudes where the ozone problem mentioned in Sect. 4.1 was encountered. For the comparisons between MeCiDA and the MODIS product CPO, we retrieved from the MODIS archive all Collection 5 MOD06 granules that intersect this region and time intervals. Since the CPO product makes use of solar channels, only day granules could be considered. In contrast, for the comparisons between MeCiDA on SEVIRI and MeCiDA on MODIS, all MOD02 granules could be uti-lized because only thermal channels were needed. In total, 1412 MODIS granules in January and 1416 MODIS granules in July were used for this comparison (MOD02 and MOD06 for each granule).
5.1 Adaption of MeCiDA to MODIS: MoCiDA
Since MODIS with its 36 spectral bands also covers the 11 SEVIRI channels it is possible in principle to apply MeCiDA to MODIS data. However, a closer look at the MODIS and SEVIRI spectral response functions reveals that MODIS bands are in general narrower and that the first SE-VIRI water vapour channel is shifted with respect to MODIS: the SEVIRI channel is centred at 6.25 µm while the corre-sponding MODIS channel is centred at 6.75 µm (see Fig. 7). This requires special care and a modification of the thresh-olds in those tests using this channel. In order to deter-mine the needed modifications of the threshold values, we have performed radiative transfer calculations for both sen-sors and selected atmospheric conditions. Identical to SE-VIRI (see the description of the radiative transfer calcula-tions in Sect. 4.2), MODIS bands are simulated using LOW-TRAN 7 with 15 sample points for each band. It was found thatT9.7,SEVIRI−T9.7,MODISis always negative. This is
par-ticularly true for clear sky conditions and large satellite view-ing angles, while in the presence of cirrus clouds this differ-ence becomes less negative. The CO2channel shows the
op-posite behaviour:T13.4,SEVIRI−T13.4,MODIS is always
posi-tive without clouds, but it tends to zero for cirrus covered pix-els. Furthermore, SEVIRI channel 5 (6.25 µm) temperatures
Table 3. SEVIRI (i.e. from Krebs et al., 2007) and MODIS thresh-old value for the MeCiDA1 tests including the BTDT6.2−T7.3.
Test no. Test SEVIRI MODIS
Test 1, 2, 3 T6.2−T7.3 >−12K >−9K
Fig. 7. Spectral response functionsψ of the thermal channels of SEVIRI and MODIS as a function of wavelengthλ.
are colder than MODIS band 27 temperatures (6.75 µm) by approximately 3 K in the presence of cirrus clouds such thatT6.2−T7.3>−12 K in Test 1, 2 and 3 are modified to T6.2−T7.3>−9 K (see also Table 3).
Dependencies of BT and BTDs on satellite viewing an-gles were inherited from MeCiDA2. Finally, this leaves us with two versions of MeCiDA for MODIS, called MoCiDA (MODIS Cirrus Detection Algorithm): MoCiDA1 refers to the first version of MeCiDA, as displayed in Krebs et al. (2007), while MoCiDA2 refers to the version presented in this paper including satellite viewing angle dependency and ozone correction.
Finally, we discuss here an example of comparison be-tween MoCiDA2 and CPO by looking at Fig. 1b. Here, the difference between these two cloud masks is plotted (the MeCiDA2 mask is found in the left panel in Fig. 1 and a RGB false colour composite in Fig. 2). Two main effects appear here: (1) Around those cirrus structures that are de-tected by both algorithms MoCiDA2 tends to detect some additional cloud pixels. According to the violet colours of many of these additional pixels in the RGB image, this seems to suggest a higher sensitivity of MoCiDA2 with respect to CPO. (2) There is an additional cloud structure that is iden-tified by CPO as cirrus while MoCiDA does not see it at all. Here, it seems that CPO is (correctly) detecting the iced tops of these cloud structures. Remember that the differences ob-served here are due only to algorithmic differences since the sensor utilised is the same for MoCiDA2 and CPO.
5.2 Collocation of SEVIRI and MODIS and averaging
we displace the cirrus clouds in such a way as to minimise these parallax effects. To reach this goal, we use the cloud top pressure (Menzel et al., 2008) contained in the MOD06 product (5 km×5 km) in combination with ECMWF ERA40 (European centre for medium-range weather forecasts, 40 yr re-analysis project) reanalysis (Uppala et al., 2005) pressure fields to determine the geometric top height of the detected cirrus clouds. In order to suppress possible MOD06 product deficiencies and to produce meaningful values for MoCiDA pixels at the mostly semi-transparent edges of cirrus clouds, we took the maximum height in an area of 9×9 pixels cen-tred around the pixel under consideration. When no pressure value could be found in the MOD06 product, a cirrus cloud top height of 10 km was assumed for this pixel.
After parallax correction, MODIS cirrus masks were pro-jected onto the SEVIRI grid: MODIS pixels belonging to one SEVIRI pixel were averaged thus providing cirrus cloud cover for every SEVIRI grid point. As a result, a mask of cirrus clouds derived from MODIS data is obtained for the SEVIRI grid.
For the comparison between MODIS and SEVIRI, we start with a MODIS granule and select the SEVIRI slot that lies closest to the given MODIS overpass. Thus, at most an ac-quisition time difference of 7.5 min is achieved. Neverthe-less, this can lead to different cloud masks because during this time clouds might have evolved. Once the MoCiDA and MeCiDA cirrus masks are obtained, the information about cirrus coverage is stored for every SEVIRI pixel contained in the region of interest (see Fig. 6). This procedure was re-peated for all MODIS granules in January and July 2008. Eventually the mean frequency of cirrus occurrence is com-puted for every SEVIRI pixel by taking the ratio of the num-ber of cirrus observations and the numnum-ber of overall observa-tions (temporal averaging). Finally, the region of interest is split into 5◦latitude boxes and the mean frequency of cirrus occurrence for a pixel inside these boxes is generated as the spatial average inside the box of all (temporal) mean pixel frequencies of cirrus occurrence.
6 Results
For a first illustration of the performance of MeCiDA1 and MoCiDA1 we start the following subsections with a short discussion of the sample scene displayed in Fig. 2. Then, to evaluate the effect of the changes described in Sects. 4.2 and 4.3, we discuss zonal means of cirrus cloud cover as derived from MeCiDA1 or MeCiDA2 against MoCiDA1 or MoCiDA2 or CPO as a function of latitude (◦N). Since the amount of MODIS observations is very high close to the up-per and lower SEVIRI disc and because at the same time the spatial resolution of SEVIRI is very poor, we perform the comparisons between−70 and +70◦N.
Fig. 8. Sample cirrus products for 11 January 2009, 12:00 UTC, west of Spain/Portugal. Difference between the MeCiDA2 and Mo-CiDA2 cirrus masks: red and blue identify cirrus pixels that are de-tected by MeCiDA2 or MoCiDA2 alone, white means cirrus pixels that are detected by both algorithms, while grey corresponds to cir-rus free pixels.
6.1 MeCiDA vs. MoCiDA: comparison
In Fig. 8 the difference in cloud cover between MeCiDA2 and MoCiDA2 are plotted for the scene shown in Fig. 2. Generally speaking, both algorithms detect the same cirrus structures. Nevertheless, differences are also present and are mainly located close to cloud edges. This might be partly due to the slight acquisition time difference between the SE-VIRI and the MODIS observation, during which clouds have evolved or moved. Also, the discrepancies come from the higher spatial resolution of the MODIS instrument that en-ables a more detailed definition of cloud contours. Finally, the different viewing geometry of the two sensors could be responsible for the disagreement. In fact, small cloud holes might disappear in the SEVIRI mask due to the slant viewing geometry of SEVIRI in this region west of Spain: this could be the case in the upper left corner of the observed granule. Furthermore, the slant optical thickness of a cirrus cloud is of course larger than the nadir optical thickness. This could result in a higher detection efficiency of SEVIRI with respect to the MODIS measurements: this could be the case for the small cirrus clouds detected by MeCiDA2 right west of the southern coast of Portugal that are not retrieved by MoCiDA2 (or only partially).
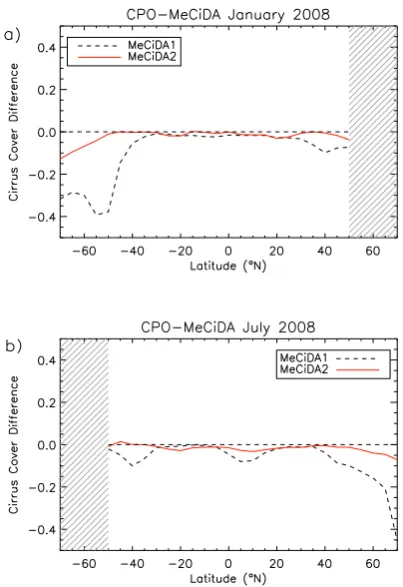
All zonal means of cirrus cover for MeCiDA1, MeCiDA2, MoCiDA1 and MoCiDA2 are shown in Fig. 9 for January (panel a) and July (panel b). In both months all curves clearly indicate the location of the Intertropical Convergence Zone (ITCZ) around the Equator where the high insolation leads to pronounced convection and to the formation of cirrus clouds. While the subtropical zones are almost cirrus free due to the general subsidence, cirrus coverage increases for latitudes higher than±30◦N.
Fig. 9. Mean cirrus cloud cover during January 2008 (a) and July 2008 (b) over the selected region derived from SE-VIRI (black/yellow) and MODIS (turquoise/red) using MeCiDA and MoCiDA, before (dashed lines) and after (solid lines) the enhancements.
systematically lower cirrus cover of up to 0.15. The rapid increase towards the poles starting at−40◦N is very strik-ing and is related to the uncorrected MeCiDA1 ozone depen-dency. Such a behaviour is not observed elsewhere and can therefore not be solely explained with the viewing angle dif-ferences between SEVIRI and MODIS. As far as MeCiDA2 and MoCiDA2 are concerned (the solid yellow and red lines in Fig. 9), we see that MoCiDA2 is still more sensitive to cirrus clouds than MeCiDA2, probably because of MODIS’ higher spatial resolution. However, the difference between the yellow and red line is now smaller than between the two dashed curves (MeCiDA1 and MoCiDA1). Furthermore, the MeCiDA2 and MoCiDA2 cirrus covers differ by an approx-imately constant amount over the entire latitude range. This confirms the expectation that the two algorithms now work similarly well at the global scale, although the underlying sensor characteristics and satellite platform orbits differ.
Comparing MeCiDA1 with MeCiDA2, they almost coin-cide for latitudes between±30◦, while MoCiDA’s changes are more pronounced already in this latitude band and are largest between +20 and +50◦N. Closer to the poles, dif-ferences between the two algorithm versions are larger.
Although a peak at around −55◦N is present in both ver-sions, in version 2 of the cirrus detection schemes it is shallower.
Figure 9b depicts a similar behaviour. In particular, the exceedingly high values close to +60◦N disappear and the overall difference between MeCiDA and MoCiDA is consid-erably smaller for version 2 than for version 1. As for Jan-uary, the winter hemisphere mid- to high-latitudes show high values of cirrus coverage, probably related to the enhanced occurrence of fronts with iced tops.
Fig. 10. Contribution of subpixel effects to the observed differences between MeCiDA2 and MoCiDA2.
the cirrus cover increase towards the poles observed with MeCiDA and MoCiDA in this study is an algorithmic arti-fact or a real issue. Apart from this latitude region, the cir-rus coverage obtained by MeCiDA2/MoCiDA2 is consistent with recent publications.
6.2 MeCiDA vs. MoCiDA: sub-pixel effects
In this section we study the impact of resolution on the detec-tion efficiency. Since MoCiDA is first applied to high resolu-tion data (MODIS) and the resulting 1×1 km2cirrus mask is then projected to the SEVIRI grid, we can investigate the dependency of cirrus detection using SEVIRI data as a func-tion of sub-scale cirrus coverage that can be extracted from MODIS. Generally speaking, we expect MeCiDA’s perfor-mance to increase with increasing sub-pixel cirrus cover. The result of this investigation is shown in Fig. 10. Here, we col-lected all the data from January and July 2008 to classify those SEVIRI pixels that were identified by MoCiDA2 as cir-rus covered but at the same time as circir-rus free by MeCiDA2. We built four classes according to SEVIRI sub-pixel cirrus coverage: 0.00–0.25, 0.25–0.50, 0.50–0.75 and 0.75–1.00.
The most populated class is of course the first one with sub-pixel cirrus cover between 0.00 and 0.25: in fact, 40 % of all undetected pixels are covered at most to one quarter by cirrus clouds. The percentage in Fig. 10 decreases then as a function of increasing cirrus coverage, as expected. However, it is surprising that the last three categories are very similar to each other and explain more or less 20 % each of the de-tection efficiency difference. This statistic further agrees with the observation described in Sect. 6.1, where MoCiDA2 de-tects a more or less constant higher amount of cirrus clouds over all latitude bins.
6.3 MeCiDA vs. CPO
As a comparison between MoCiDA and CPO has already been performed in Sect. 3.2 discussing Fig. 1, no additional sample scene with the differences between MeCiDA and
Fig. 11. Difference in mean cirrus cloud cover during Jan-uary 2008 (a) and July 2008 (b) over the selected region between MeCiDA on SEVIRI and CPO on MODIS before (dashed line) and after (solid line) the enhancements. This comparison was only car-ried out for daylight granules, due to the usage of solar channels by the CPO product (hatched area excluded).
CPO will be shown here. In fact, MeCiDA and MoCiDA per-form very similarly for this granule (see Fig. 8). Thus, we simply refer to Sect. 5.1 for a discussion of Fig. 1b and to Sect. 6.1 for a discussion of Fig. 8. These considerations are still valid here.
nevertheless does not imply that both algorithms MeCiDA2 and CPO are detecting exactly the same cirrus clouds. In fact, under some circumstances the higher cirrus detection capa-bilities of CPO due to the higher spatial resolution of MODIS and to the use of solar channels might be balanced by some MeCiDA2 false alarms.
7 Conclusions
Due to their special role for climate, it is important to moni-tor cirrus coverage at the global level. We presented the im-proved version of the day and night cirrus detection algo-rithm MeCiDA (Krebs et al., 2007) that uses seven thermal channels of the SEVIRI instrument aboard 8 and Met-9. The new algorithm, called MeCiDA2 in contrast to the original version MeCiDA1, can now be applied to the entire MSG/SEVIRI disc and takes into account the viewing angle dependency of the cirrus cloud detection and correctly deals with brightness temperatures in the ozone channel centred at 9.7 µm.
To evaluate the new algorithm and the impact of the pro-posed modifications we adapted MeCiDA to Terra/MODIS to exploit the different viewing geometry of this instrument. Furthermore, we compared to the MOD06 cloud phase op-tical properties (CPO) product in order to have an indepen-dent check of the algorithm performance. In both cases, the database consists of data from January and July 2008 to con-sider seasonal variation. The comparison was performed on a part of the SEVIRI disc between−10 and +20◦E to inves-tigate viewing angle dependence.
We conclude that the consideration of viewing angle de-pendency and ozone effect strongly reduces false alarm rates, mainly at higher latitudes beyond±50◦. Closer to the Equa-tor the performance of MeCiDA has only been slightly af-fected by the changes. Usually, MeCiDA now detects less cir-rus clouds than before. The comparison to CPO reveals that cirrus cloud cover difference between CPO and MeCiDA2 is smaller than 0.1 apart from latitudes higher than 50◦N. MeCiDA2 however only uses thermal information, and is thus a day and night algorithm that can be applied to produce diurnal cycles of cirrus cover.
Acknowledgements. This manuscript is dedicated to the memory
of our colleague Hermann Mannstein who died unexpectedly and much too early on 25 January 2013. He was the scientific pioneer in the field of cloud remote sensing at DLR during nearly three decades. Most of his recent work was related to the detection of ice clouds in satellite data and the interaction of man-made and natural ice clouds. He will be deeply missed as expert, adviser and friend.
We thank NASA for the provision of MODIS data through http://ladsweb.nascom.nasa.gov, EUMETSAT for the provision of SEVIRI data and ECMWF for the reanalysis dataset ERA40. We would also like to extend out exceptional gratitude to Kasper Graf for providing a continuous SEVIRI dataset over the examined
regions and Simon Unterstrasser and Richard Keane for the careful review.
The service charges for this open access publication have been covered by a Research Centre of the Helmholtz Association.
Edited by: A. Kokhanovsky
References
Ackerman, S., Strabala, K., Menzel, W., Frey, R., Moeller, C., and Gumley, L.: Discriminating clear sky from clouds with MODIS, J. Geophys. Res., 103, 32141–32157, 1998.
Appleman, H.: The formation of exhaust contrails by jet aircraft, B. Am. Meteorol. Soc., 34, 14–20, 1953.
Atlas, D., Wang, Z., and Duda, D.: Contrails to cirrus – morphology, microphysics, and radiative properties, J. Appl. Meteorol. Clim., 45, 5–19, 2006.
Aumann, H. H., Chahine, M., Gautier, C., Goldberg, M., Kalnay, E., McMillan, L., Revercomb, H., Rosenkranz, P., Smith, W., Staelin, D., Strow, L., and Susskind, J.: AIRS/AMSU/HSB on the Aqua mission: design, science objectives, data products, and pro-cessing systems, IEEE T. Geosci. Remote, 41, 253–264, 2003. Baum, B., Soulen, P., Strabala, K., King, M., Ackerman, S.,
Men-zel, W., and Yang, P.: Remote sensing of cloud properties using MODIS airborne simulator imagery during SUCCESS. 2. Cloud thermodynamic phase, J. Geophys. Res., 105, 11781–11792, 2000.
Duda, D., Minnis, P., Nguyen, L., and Palikonda, R.: A case study of the development of contrail clusters over the Great Lakes, J. Atmos. Sci., 61, 1132–1146, 2004.
Evans, K. F., Walter, S. J., Heymsfield, A. J., and Deeter, M.: Mod-eling of submillimeter passive remote sensing of cirrus clouds, J. Appl. Meteorol., 37, 184–205, 1998.
Hagihara, Y., Okamoto, H., and Yoshida, R.: Development of a combined CloudSat-CALIPSO cloud mask to show global cloud distribution, J. Geophys. Res., 115, D00H33, doi:10.1029/2009JD012344, 2010.
Hong, G., Heygster, G., and Kunzi, K.: Intercomparison of deep convective cloud fractions from passive infrared and microwave radiance measurements, Geosci. Remote Sens. Lett., 2, 18–22, 2005.
Jensen, E., Ackerman, A., Stevens, D., Toon, O., and Minnis, P.: Spreading and growth of contrails in a sheared environment, J. Geophys. Res., 103, 31557–31568, 1998.
Jiang, X., Pawson, S., and Camp, C.: Interannual variability and trends of extratropical ozone, Part I: Northern Hemisphere, J. At-mos. Sci., 65, 3013–3029, 2008a.
Jiang, X., Pawson, S., and Camp, C.: Interannual variability and trends of extratropical ozone, Part II: Southern Hemisphere, J. Atmos. Sci., 65, 3030–3041, 2008b.
Krebs, W., Mannstein, H., Bugliaro, L., and Mayer, B.: Technical note: A new day- and night-time Meteosat Second Generation Cirrus Detection Algorithm MeCiDA, Atmos. Chem. Phys., 7, 6145–6159, doi:10.5194/acp-7-6145-2007, 2007.
Kurzeja, R.: Spatial variability of total ozone at high latitudes in winter, J. Atmos. Sci., 41, 695–697, 1984.
Lavanant, L., Fourri´e, N., Gambacorta, A., Grieco, G., Heilliette, S., and Hilton, F. I., Kim, M. J., McNally, A. P., Nishihata, H., Pavelin, E. G., and Rabier, F.: Comparison of cloud products within IASI footprints for the assimilation of cloudy radiances, Q. J. Roy. Meteorol. Soc., 137, 1988–2003, doi:10.1002/qj.917, 2011.
Mayer, B. and Kylling, A.: Technical note: The libRadtran soft-ware package for radiative transfer calculations – description and examples of use, Atmos. Chem. Phys., 5, 1855–1877, doi:10.5194/acp-5-1855-2005, 2005.
Menzel, W. P., Frey, R. A., Zhang, H., Wylie, D. P., Moeller, C. C., Holz, R. E., Maddux, B., Baum, B. A., Strabala, K. I., and Gum-ley, L. E.: MODIS global cloud-top pressure and amount estima-tion: algorithm description and results, J. Appl. Meteorol. Clim., 47, 1175–1198, doi:10.1175/2007JAMC1705.1, 2008.
Minnis, P., Young, D., Garber, D., Nguyen, L., Smith Jr., W., and Pa-likonda, R.: Transformation of contrails into cirrus during SUC-CESS, Geophys. Res. Lett., 25, 1157–1160, 1998.
Minnis, P., Ayers, J. K., Palikonda, R., and Phan, D.: Contrails, cir-rus trends, and climate, J. Climate, 17, 1671–1685, 2004. Platnick, S., King, M., Ackerman, S., Menzel, W., Baum, B.,
Riedi, J., and Frey, R.: The MODIS cloud products: algorithms and examples from TERRA, IEEE T. Geosci. Remote, 41, 459– 473, 2003.
Schl¨ussel, P., Hultberg, T. H., Phillips, P. L., August, T. and Cal-bet, X.: The operational IASI Level 2 processor, Adv. Space Res., 5, 982–988, doi:10.1016/j.asr.2005.03.008, 2005.
Schmetz, J., Pili, P., Tjemkes, S., Just, D., Kerkmann, J., Rota, S., and Ratier, A.: An introduction to Meteosat Second Generation (MSG), B. Am. Meteorol. Soc., 83, 977–992, doi:10.1175/1520-0477(2002)083<0977:AITMSG>2.3.CO;2, 2002.
Schmidt, E.: Die Entstehung von Eisnebel aus den Auspuffgasen von Flugmotoren, Schrift. Deut. Akad. Luftfahrtf., 44, 1–15, 1941.
Schumann, U.: On conditions for contrail formation from aircraft exhausts, Meteorol. Z., 5, 4–23, 1996.
Stordal, F., Myhre, G., Stordal, E. J. G., Rossow, W. B., Lee, D. S., Arlander, D. W., and Svendby, T.: Is there a trend in cirrus cloud cover due to aircraft traffic?, Atmos. Chem. Phys., 5, 2155–2162, doi:10.5194/acp-5-2155-2005, 2005.
Stubenrauch, C., Ch´edin, A., R¨adel, G., Scott, N., and Serrar, S.: Cloud properties and their seasonal and diurnal variability from TOVS path-B, J. Atmos. Chem., 19, 5531–5553, 2006.
Stubenrauch, C. J., Cros, S., Guignard, A., and Lamquin, N.: A 6-year global cloud climatology from the Atmospheric In-fraRed Sounder AIRS and a statistical analysis in synergy with CALIPSO and CloudSat, Atmos. Chem. Phys., 10, 7197–7214, doi:10.5194/acp-10-7197-2010, 2010a.
Stubenrauch, C. J., Cros, S., Guignard, A., and Armante, R., Ch´edin, A., and Scott, N.: Global Cloud Climatologies from satellite-based InfraRed Sounders (TOVS, AIRS and IASI), B. Am. Meteorol. Soc., 93, 347–370, 2010b.
Tjemkes, S. A., van de Berg, L., and Schmetz, J.: Warm water vapour pixels over high clouds as observed by Meteosat, Beitr. Phys. Atmos., 70, 15–21, 1997.
Unterstrasser, S. and Gierens, K.: Numerical simulations of contrail-to-cirrus transition – Part 1: An extensive parametric study, Atmos. Chem. Phys., 10, 2017–2036, doi:10.5194/acp-10-2017-2010, 2010.
Uppala, S. M., K˚allberg, P. W., Simmons, A. J., Andrae, U., Bech-told, V. D. C., Fiorino, M., Gibson, J. K., Haseler, J., Hernan-dez, A., Kelly, G. A., Li, X., Onogi, K., Saarinen, S., Sokka, N., Allan, R. P., Andersson, E., Arpe, K., Balmaseda, M. A., Bel-jaars, A. C. M., Berg, L. V. D., Bidlot, J., Bormann, N., Caires, S., Chevallier, F., Dethof, A., Dragosavac, M., Fisher, M., Fuentes, M., Hagemann, S., H´olm, E., Hoskins, B. J., Isaksen, L., Janssen, P. A. E. M., Jenne, R., McNally, A. P., Mahfouf, J.-F., Morcrette, J.-J., Rayner, N. A., Saunders, R. W., Simon, P., Sterl, A., Trenberth, K. E., Untch, A., Vasiljevic, D., Viterbo, P., and Woollen, J.: The ERA-40 re-analysis, Q. J. Roy. Meteorol. Soc., 131, 2961–3012, doi:10.1256/qj.04.176, 2005.
Vaughan, M., Young, S., Winker, D., Powell, K., Omar, A., Liu, Z., Hu, Y., and Hostetler, C.: Fully automated analysis of spacebased lidar data: an overview of the CALIPSO retrieval algorithms and data products, in: Laser Radar Techniques for Atmospheric Sensing, edited by: Singh, U. N., Vol. 5575 of Proceedings of the Society of Photo-Optical Instrumentation Engineers (SPIE), Bellingham, 16–30, doi:10.1117/12.572024, 2004.
Winker, D. M., Pelon, J., Coakley, J. A., Ackerman, S. A., Charl-son, R. J., Colarco, P. R., Flamant, P., Fu, Q., Hoff, R. M., Kittaka, C., Kubar, T. L., Le Treut, H., McCormick, M. P., M´egie, G., Poole, L., Powell, K., Trepte, C., Vaughan, M. A., and Wielicki, B. A.: The CALIPSO mission: a global 3-D view of aerosols and clouds, B. Am. Meteorol. Soc., 91, 1211–1229, doi:10.1175/2010BAMS3009.1, 2010.