Atmos. Meas. Tech., 5, 3055–3067, 2012 www.atmos-meas-tech.net/5/3055/2012/ doi:10.5194/amt-5-3055-2012
© Author(s) 2012. CC Attribution 3.0 License.
Atmospheric
Measurement
Techniques
Effect of spectrally varying albedo of vegetation surfaces on
shortwave radiation fluxes and aerosol direct radiative forcing
L. Zhu1, J. V. Martins1, and H. Yu2,3
1University of Maryland, Baltimore County, Department of Physics and Joint Center for Earth Systems Technology,
1000 Hilltop Circle, Baltimore, MD, 21250, USA
2Earth System Science Interdisciplinary Center (ESSIC) University of Maryland, College Park, MD, 20740, USA 3Climate and Radiation Laboratory, NASA Goddard Space Flight Center, Greenbelt, MD, 20771, USA
Correspondence to: L. Zhu ([email protected]), J. V. Martins ([email protected]) and H. Yu ([email protected])
Received: 24 April 2012 – Published in Atmos. Meas. Tech. Discuss.: 7 June 2012
Revised: 1 November 2012 – Accepted: 2 November 2012 – Published: 12 December 2012
Abstract. This study develops an algorithm for represent-ing detailed spectral features of vegetation albedo based on Moderate Resolution Imaging Spectrometer (MODIS) obser-vations at 7 discrete channels, referred to as the MODIS En-hanced Vegetation Albedo (MEVA) algorithm. The MEVA algorithm empirically fills spectral gaps around the vegeta-tion red edge near 0.7 µm and vegetavegeta-tion water absorpvegeta-tion features at 1.48 and 1.92 µm which cannot be adequately cap-tured by the MODIS 7 channels. We then assess the effects of applying MEVA in comparison to four other traditional approaches to calculate solar fluxes and aerosol direct ra-diative forcing (DRF) at the top of atmosphere (TOA) based on the MODIS discrete reflectance bands. By comparing the DRF results obtained through the MEVA method with the re-sults obtained through the other four traditional approaches, we show that filling the spectral gap of the MODIS mea-surements around 0.7 µm based on the general spectral be-havior of healthy green vegetation leads to significant im-provement in the instantaneous aerosol DRF at TOA (up to 3.02 W m−2difference or 48 % fraction of the aerosol DRF, −6.28 W m−2, calculated for high spectral resolution surface reflectance from 0.3 to 2.5 µm for deciduous vegetation sur-face). The corrections of the spectral gaps in the vegetation spectrum in the near infrared, again missed by the MODIS reflectances, also contributes to improving TOA DRF calcu-lations but to a much lower extent (less than 0.27 W m−2, or about 4 % of the instantaneous DRF).
Compared to traditional approaches, MEVA also improves the accuracy of the outgoing solar flux between 0.3 to 2.5 µm at TOA by over 60 W m−2(for aspen 3 surface) and aerosol
DRF by over 10 W m−2 (for dry grass). Specifically, for Amazon vegetation types, MEVA can improve the accu-racy of daily averaged aerosol radiative forcing in the spec-tral range of 0.3 to 2.5 µm at equator at the equinox by 3.7 W m−2. These improvements indicate that MEVA can contribute to regional climate studies over vegetated areas and can help to improve remote sensing-based studies of cli-mate processes and clicli-mate change.
1 Introduction
3056 L. Zhu et al.: Effect of spectral albedo on aerosol direct forcing
36 738
739
740
Fig 1
741
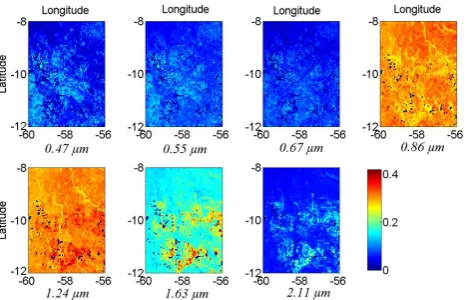
Fig. 1. Black sky albedo maps at MODIS bands 1–7 calculated from the MODIS file MCD43C1.A2006241.005.2008109074010.hdf with SZA equaling 32 degrees. The studied area is over Amazo-nian in Latitude = [−12 to−8] and Longitude = [−60 to−56] on Julian day 241 in 2006.
Adequate representation of these variations is important for estimating radiative flux and aerosol radiative forcing.
Much work has been done to capture vegetation surface reflectance and albedo. Directly, surface albedo can be ob-tained from field measurements (Gilgen et al., 1995; Sell-ers et al., 1992; Hall and SellSell-ers, 1995). Leaf samples have also been collected and their reflectance has been deter-mined by spectrophotometers in the laboratory (Hosgood et al., 1994; Clark et al., 2007). Additionally, remote sens-ing techniques have been widely used to determine sur-face albedo, for instance the Airborne Visible/Infrared Imag-ing Spectrometer (AVIRIS) (Staenz et al., 1996), and many satellite instruments including, but not limited to: Global Ozone Monitoring Experiment (GOME) (Koelemeijer et al., 2003), MEdium Resolution Imaging Spectrometer (MERIS) (Muller, 2006), Polarization and Directionality of the Earth’s Reflectances (POLDER) (Leroy et al., 1997), Multian-gle Imaging Spectroradiometer (MISR) (Diner, 2008), Ad-vanced Very High Resolution Radiometer (AVHRR) (Saun-ders, 1990), Visible Infrared Imager Radiometer Suite (VI-IRS) (Sei, 2011), and Moderate Resolution Imaging Spectro-radiometer (MODIS) (Liang et al., 1999; Lucht et al., 2000; Schaaf et al., 2002; Moody et al., 2005).
The MODIS sensor on board the NASA polar satellites TERRA (1999–present) and AQUA (2000–present) mea-sures the reflected solar radiation at the top of the atmosphere (TOA), which can be used to retrieve surface properties (Ver-mote et al., 1997). The MODIS land science team has used the MODIS measurements to develop a series of surface albedo data products, including MCD43C, among others. In detail, MCD43C provides three spectrally dependent param-eters fiso, fvol, fgeo for calculating black sky albedo and white sky albedo when combined with a BRDF model. These parameters are available at MODIS bands 1–7 (nominally centered at 0.47, 0.55, 0.67, 0.86, 1.24, 1.63, and 2.11 µm),
and in the spectral ranges of visible (0.3 to 0.7 µm), near in-frared (0.7 to 5 µm), and total broadband (0.3 to 5 µm).
Satellite remote sensing techniques have the advantages of having larger spatial and longer temporal coverage than in situ measurements. However, most satellite sensors can only measure reflectance at certain narrow bands and have the drawback of inadequately characterizing spectral varia-tions as the example shown in Fig. 2. Clearly MODIS spec-tral measurements don’t well capture the rapid increase of reflectance from 0.67 to 0.86 µm and the dips at 1.48 and 1.92 µm. For flux and aerosol forcing calculations, broadband albedo is generally used and narrow band albedo is usually ignored (Myhre et al., 2005; Zhou et al., 2005; Patadi et al., 2009). The limited spectral reflectance information and the simplified broad band albedos can be error prone in radiative forcing calculations (Wang et al., 2011).
This work presents a new algorithm – the MODIS en-hanced vegetation albedo (MEVA) – to provide an integrated vegetation reflectance spectrum, with the advantage of global and temporal coverage over the lifetime of MODIS. Given reflectance at MODIS bands 1–7, this project demonstrates that the vegetation reflectance spectrum determined by the MEVA algorithm improves the accuracy of the TOA flux and aerosol forcing calculations.
2 Methodology
2.1 Traditional approaches
Several methods have been traditionally used to integrate the surface albedo over the whole solar spectrum based on the MODIS bands 1–7. These methods are illustrated in Fig. 3, based on the reflectance spectrum of miconia guianensis adapted from Arai et al. (2010) and can be described as: (a) the narrowband reflectance is converted to reflectance in to-tal shortwave broadband (from 0.3 to 2.5 µm) (Liang et al., 1999); (b) narrowband reflectance at MODIS bands 1–7 is converted to reflectance in two broad bands: broadband “vis-ible” (from 0.3 to 0.7 µm) and “near infrared” (from 0.7 to 2.5 µm) according to Liang et al. (1999); (c) the wavelength between two adjacent MODIS channels are averaged (which leads to 0.51, 0.61, 0.77, 1.10, 1.44, and 1.87 µm) and seven reflectance values from MODIS centered in the native wave-lengths are assigned to the following bands: from 0.3 to 0.51 µm, from 0.51 to 0.61 µm, and so on (denoted “average band MODIS” in following discussions); (d) the reflectance at MODIS bands 1–7 is linearly interpolated. The approach in methods (a) and (b) is performed through polynomial regres-sions to convert albedos at MODIS narrow bands to broad-band albedos at visible, near infrared, and total shortwave as described in Liang et al. (1999).
L. Zhu et al.: Effect of spectral albedo on aerosol direct forcing 3057
37 742
Fig 2
743
744
Fig 3
745
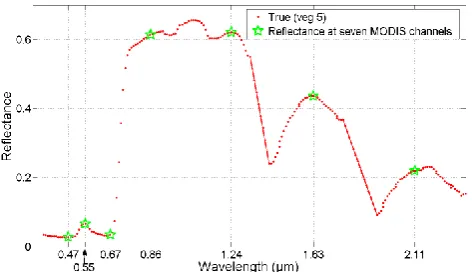
Fig. 2. The x-axis represents the wavelength from 0.3 to 2.35 µm la-beled by seven MODIS channels; the dotted red curve is the spectral reflectance for vegetation 5 (miconia guianensis) adapted from Arai et al. (2010); the green stars represent the corresponding reflectance at MODIS bands 1–7. In this figure, the spectral reflectance results between 1.35 to 1.45 µm and 1.85 to 1.95 µm were linearly inter-polated based on Arai et al. (2010) data. These solid red lines are shown as dots in Figs. 3, 5, 6, and 9.
here based on MODIS bands 1–7 (MEVA–MODIS enhanced vegetation albedo) will minimize these errors. TOA solar fluxes and aerosol direct radiative forcing will be calculated for all these methods (traditional and proposed) and will be compared with the results calculated from the high resolution spectral libraries.
Using the reflectance spectrum of vegetation miconia
guianensis adopted from Arai et al. (2010) as an example,
Fig. 3 illustrates results from the four traditional approaches described above. As shown by the solid blue line in Fig. 3d, it is possible to linearly connect reflectance at MODIS bands 1–7 in order to interpolate the reflectance data. However, in this method, there are three distinct features missing from the actual spectrum, which can be seen in the shadowed areas in Fig. 4b.
The first missing feature is associated with the vegetation red edge around 0.7 µm, which is the division between the low reflectance in the visible and high reflectance in the near infrared. The red edge in the vegetation surface reflectance spectra have been used to study chlorophyll, water content, pigment content properties, and more (Horler et al., 1983; Guyot et al., 1992; Gitelson et al., 1996; Sims and Gamon, 2002; Stimson et al., 2005). As shown in Fig. 4a, solar radia-tion arriving at the surface is relatively strong around 0.7 µm, which intensifies the errors in flux and aerosol forcing calcu-lations associated with the missing feature of the red edge. The other two important missing features in the interpolated spectrum are around 1.44 and 1.92 µm due to radiation ab-sorption by vegetation water. These two missing features are expected to lead to smaller errors, due to the weaker solar ra-diation arriving at the surface resulting from the strong atmo-spheric water vapor absorption in these two spectral ranges as shown in Fig. 4a. These errors are discussed in more
de-37 742
Fig 2
743
744
Fig 3
745 Fig. 3. Traditional approaches to estimate the continuous reflectance
spectra based on MODIS bands 1–7: Liang short wave, Liang vis-ible and near infrared, average band MODIS, and linear MODIS. In each subplot, the x-axis represents the wavelength from 0.3 to 2.35 µm; the dotted red curve is the spectral reflectance for miconia guianensis as shown in Fig. 2; the green stars represent the cor-responding reflectance at MODIS bands 1–7; the solid blue lines represent each traditional approach.
tail in the following section through flux and aerosol forcing calculation in different spectral ranges.
2.2 MODIS enhanced vegetation albedo (MEVA)
We now describe a new empirical method which will show how the seven MODIS narrowband albedos can be extended in a continuous reflectance spectrum to minimize errors in the calculation of fluxes at the TOA and lead to more accurate aerosol radiative forcing calculations.
3058 L. Zhu et al.: Effect of spectral albedo on aerosol direct forcing
38 746
Fig 4
747
748
Fig 5
749
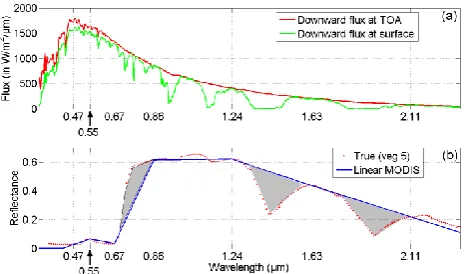
Fig. 4. (a) Downward fluxes at the TOA and surface. The x-axis is the wavelength (from 0.3 to 2.5 µm) labeled with MODIS bands 1– 7; the red curve represents the incoming solar radiation at the top of the atmosphere (TOA); the green curve represents the downward ra-diation reaching the surface. The simulation was done with the fol-lowing inputs: no boundary layer aerosols, SZA = 30 degrees, trop-ical atmospheric profile, and surface albedo being as the red curve in Fig. 2. (b) The three missing features by linearly connecting the reflectance at MODIS bands 1–7. The x-axis is the wavelength from 0.3 to 2.5 µm labeled with MODIS bands 1–7; the dotted red curve represents the reflectance as shown in Fig. 2; the solid blue line represents the linearly connected reflectance at MODIS bands 1–7; the shaded areas represent three distinct missing features: missing vegetation red edge feature at around 0.7 µm, and the missing water absorption features at around 1.44 and 1.92 µm.
of vegetation spectra including the vegetation red edge asso-ciated with chlorophyll absorption at 0.7 µm and vegetation water absorption features at about 1.5 and 1.9 µm (Hoffer, 1987). The final result is a reflectance spectrum based on the MODIS bands 1–7 that better resembles the most important features of a typical vegetation spectral reflectance. With
mi-conia guianensis (named “vegetation 5” in the discussion)
as an example, the MEVA spectrum is displayed as the solid blue line in Fig. 6.
3 Evaluation of the methodology
In order to evaluate the relative merits of the MEVA methodology versus traditional approaches to interpolate the MODIS bands 1–7, several high-resolution vegetation spec-tra from the literature were used as input to the Santa Bar-bara DISORT Atmospheric Radiative Transfer (SBDART) program (Ricchiazzi et al., 1998) to calculate examples of the outgoing flux at TOA and the direct aerosol forcing. Here the direct radiative forcing is defined as the difference of net (incoming minus outgoing) solar flux at TOA under clear sky with and without aerosols. A positive direct aerosol forcing value indicates that aerosols warm the earth–atmosphere sys-tem, and a negative value shows that aerosols cool the earth– atmosphere system.
38 746
Fig 4
747
748
Fig 5
749 Fig. 5. This figure illustrates four auxiliary channels and the ratios
used to determine the MODIS enhanced surface albedo (MEVA), where the x-axis represents wavelength (from 0.3 to 2.35 µm) la-beled with MODIS bands 1–7 on the bottom and four auxiliary channels (0.69, 0.72, 1.44, and 1.92 µm) at the top. Dotted red curve (“true”) represents the reflectance spectrum as shown in Fig. 2; the green stars present the corresponding reflectance at MODIS bands 1–7. The reflectance at the four auxiliary channels are determined as: at 0.69 µm, the reflectance is obtained by linearly extrapolating the reflectance at 0.55 and 0.67 µm; at 0.72 µm, the reflectance is the average of the reflectance at 0.69 and 0.86 µm; at 1.44 µm, the reflectance is 40 % of the reflectance at 1.24 µm; at 1.92 µm, the re-flectance is 20 % of the rere-flectance at 1.63 µm.
The SBDART is a radiative transfer model based on the discrete ordinate method which includes aerosols, gases, and surface properties (Ricchiazzi et al., 1998) and can run with different atmospheric input settings and customized spectral surface albedo. For this study, the main input parameters are the spectral surface albedo in a spectral range of 0.3 µm to 2.5 µm with a 0.01 µm resolution; the spectral aerosol single-scattering albedo (SSA), aerosol optical depth (AOD), and phase function in a spectral range of 0.3 µm to 2.5 µm with a resolution of 0.1 µm to 0.2 µm; and the standard tropical atmospheric profile. The phase function was represented by 128 terms of Legendre moments calculated with Mie the-ory based on the Amazonian aerosol model presented by Dubovik et al. (2002). The outputs are the flux at TOA in W m−2µm−1from 0.3 to 2.5 µm with a default resolution of 0.005 µm.
L. Zhu et al.: Effect of spectral albedo on aerosol direct forcing 3059
39 750
Fig 6
751
752
Fig 7
753
Fig. 6. Processes used to develop MEVA. The x-axis is wavelength (from 0.3 to 3 µm) labeled with MODIS bands 1–7 on the bottom and the auxiliary channels (0.69, 0.72, the variable channel end-ing the red edge, 1.44, 1.84, 1.92, and 3 µm) at the top. Four of these auxiliary channels were shown in Fig. 5. For the other three auxiliary channels, the variable channel ending the red edge is the crossing point between the linearly extrapolated line from 0.69 to 0.72 µm and the linearly extrapolated line from 1.24 to 0.86 µm; the auxiliary channel at 1.84 and 3 µm are determined by averaging the experimental results of several types of vegetation. The dotted red curve (“true”) represents reflectance spectra as shown in Fig. 2; the green stars present the corresponding reflectance at MODIS bands 1–7; the ovals represent the determined reflectance at aux-iliary channels; the solid blue line represents MEVA. The detailed procedures for MEVA are explained in Sect. 2.2.
One possible scenario for biomass burning aerosols over the Amazon region is studied here using the following in-put parameters: AOD (at 0.55 µm) = 0.32 and 0.64, SSA (at 0.55 µm) = 0.89, and solar zenith angle (SZA) = 30 degrees. Cases with different AODs, SSAs, and SZAs were also stud-ied, and will be discussed in the next section. The vegeta-tion reflectance spectra used in this study (denoted “true” in following discussions) were taken from the Johns Hopkins University (JHU) spectral library, the United States Geolog-ical Survey (USGS) Digital Spectral Library (Clark et al., 2007), and from the spectral signatures of leaves from Ama-zonian trees presented by Aria et al. (2010). The MODIS data has 500 m spatial resolution and might contain mixtures of different land and vegetation types. This is a limitation of this study which uses the laboratory measurement of the leaf spectral reflectance as the land surface albedo in radiative transfer simulations. Since one main application of MEVA in this study is the calculation of biomass burning aerosol forc-ing and TOA flux calculation over the Amazon where green vegetation dominates over the whole year, this assumption is appropriate.
39 750
Fig 6
751
752
Fig 7
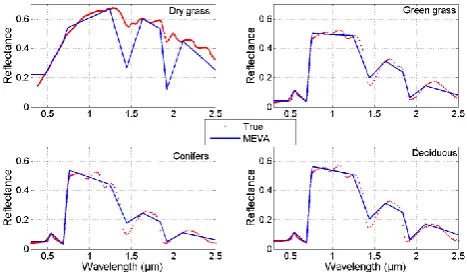
753 Fig. 7. The procedures for MEVA were applied to the reflectance
spectra from the JHU spectral library for dry grass, green grass, conifer, and deciduous. The x-axis represents the wavelength from 0.3 to 2.5 µm; the y-axis represents the reflectance; the dotted red curves represent the reflectance spectra from the JHU spectral li-brary; the solid blue lines represent the MEVA results.
3.1 Dry grass, green grass, conifer, and deciduous surfaces
In this section, the studied vegetation types are dry grass, green grass, conifer, and deciduous; their reflectance spectra are provided by the JHU spectral library. Given reflectance at MODIS bands 1–7, the reflectance spectra are reconstructed through the methods discussed in the last section. Figure 7 shows the reflectance spectrum provided by the spectral li-brary (“true”) and MEVA. Though the dry grass case shows large differences between MEVA and the “true” spectrum, it was kept in all our calculations as an example of the “worst case” scenario and to demonstrate that even in this situation the fluxes and forcing errors are reasonably under control.
3060 L. Zhu et al.: Effect of spectral albedo on aerosol direct forcing
40 754
Fig 8
755
756
Fig 9
757
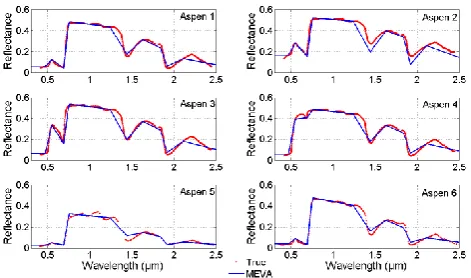
Fig. 8. In each subplot, the x-axis represents wavelength from 0.3 to 2.5 µm; the y-axis represents reflectance. The dotted red curves rep-resent reflectance spectra for aspens from the USGS digital spectral library; the solid blue lines represent the MEVA results.
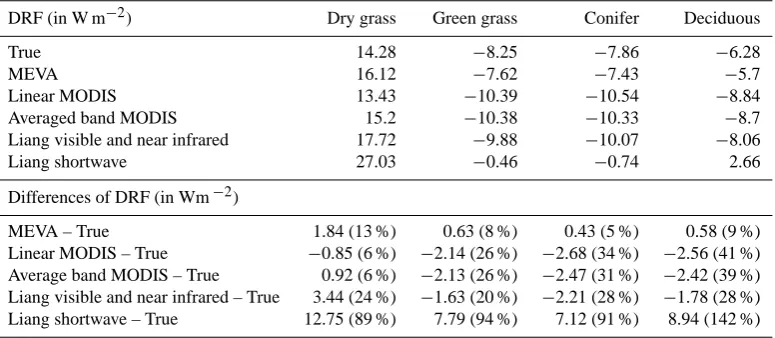
MEVA yields the aerosol forcing that is closest to the “true” case with regard to aerosol forcing magnitude (varying from 0.43 to 0.63 W m−2)and percentage (below 10 %). The ex-ception of dry grass is explained in the following sensitivity discussion.
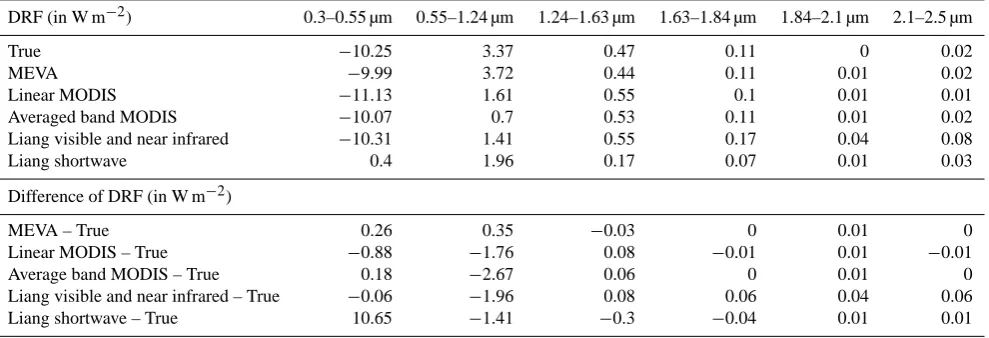
The sensitivity of aerosol DRF in different spectral ranges are investigated and shown in Table 3 for a deciduous vege-tation surface. For the aerosol forcing in the spectral range of 0.55 to 1.24 µm, MEVA provides a difference of 0.35 W m−2 from the “true”, as compared to differences between−1.41 to−2.67 W m−2 from traditional approaches. This demon-strates that MEVA surpasses traditional approaches in cal-culating aerosol forcing. It can also be observed from Ta-ble 3 that the spectral range from 0.55 to 1.24 µm presents the largest difference between each method and calculations with the “true” spectrum (except for the case of Liang short-wave). These results indicate the importance of filling the spectral gaps for the missing feature of the vegetation red edge around 0.7 µm, which is consistent with the discussion in Sect. 2.2. In the same fashion, gap filling through MEVA for the other missing features around 1.48 and 1.92 µm lead to the closest aerosol forcing to “true”, with differences of −0.03 and 0.01 W m−2, compared to the values from 0.01 to 0.08 W m−2estimated through traditional approaches.
According to Table 3, the aerosol forcing differences for the gap filling of the vegetation water absorption missing features (shown in the spectral range of 1.24 to 1.63 and 1.84 to 2.1 µm) are smaller than the aerosol forcing differ-ence obtained for the gap filling of the red edge missing fea-ture (shown in the spectral range of 0.55 to 1.24 µm), i.e. 0.03 and 0.01 being smaller than 0.35; 0.01 and 0.08 being smaller than 1.76, etc. This result indicates that gap filling for the vegetation water absorption missing features has a rela-tively small impact on aerosol forcing calculation as com-pared to the impact from the missing red edge. This conclu-sion is well explained by the relatively weaker solar radiation
40 754
Fig 8
755
756
Fig 9
757
Fig. 9. In each subplot, the x-axis represents wavelength from 0.3 to 2.5 µm; the y-axis represents reflectance. The solid blue lines rep-resent the MEVA results; the dotted red curves reprep-resent the “true” reflectance spectra (adopted from Arai et al., 2010) for the follow-ing six Amazonia vegetation types: veg 1: manilkara Hubert; veg 2: couratari guianensis; veg 3: lecythis lurida; veg 4: genipa Amer-icana; veg 5: miconia guianensis; and veg 6: litter.
and stronger atmospheric water absorption around 1.48 µm and 1.92 µm than those around 0.7 µm as shown in Fig. 4a. This suggests that the results are not sensitive to the percent-ages we proposed in Fig. 5. Very similar results were derived in the analysis of green grass, conifer, aspens, and Amazon vegetation. The spectral analysis for dry grass indicates that the aerosol forcing difference of 1.84 W m−2between MEVA and “true” (as in Table 2) is predominantly caused by the dif-ference in the spectral range of 0.3 to 0.55 µm, where the difference is 1.86 W m−2(compared to 0.17,−0.14,−0.01, −0.01, and−0.01 in the other five spectral ranges: 0.55 to 1.24, 1.24 to 1.63, 1.63 to 1.84, 1.84 to 2.1 and 2.1 to 2.5 µm). This might be related with the distinct spectral feature of dry grass in the range of the 0.3 to 0.55 µm (as shown in Fig. 7). In Fig. 7, the spectral reflectance for green grass, conifers, and deciduous is characterized with a reflectance peak start-ing from about 0.5 µm and ends at about 0.7 µm, which is absent from dry grass. This distinct spectral behavior by dry grass might be caused by its low chlorophyll and vegetation water content (Hoffer, 1978). In general, the results in Ta-ble 3 justify the gap-filling procedure by MEVA for the three missing features shown in Fig. 4.
3.2 Aspen surfaces
L. Zhu et al.: Effect of spectral albedo on aerosol direct forcing 3061
Table 1. The calculated outgoing solar flux (in W m−2; from 0.3 to 2.5 µm) at TOA over dry grass, green grass, conifer, and deciduous surfaces. Other parameters used include AOD (at 0.55 µm) of 0.32, SSA (at 0.55 µm) of 0.89, and SZA of 30 degrees. Bold numbers represent the difference in flux associated with different approaches to estimate the surface reflectance spectrum.
Flux (in W m−2) Dry grass Green grass Conifer Deciduous
True 362.17 237.18 234.99 251.21
MEVA 361.59 238.49 235.84 252.49
Linear MODIS 357.37 223.53 218.61 235.17 Averaged band MODIS 360.04 223.05 218.84 234.98 Liang visible and near infrared 352.63 221.03 218.42 235.96 Liang shortwave 363.12 213.79 212.33 229.96
Differences of flux (in W m−2)
MEVA – True −0.58 1.31 0.85 1.28
Linear MODIS – True −4.8 −13.65 −16.38 −16.04 Average band MODIS – True −2.13 −14.13 −16.15 −16.23 Liang visible and near infrared – True −9.54 −16.15 −16.57 −15.25 Liang shortwave – True 0.95 −23.39 −22.66 −21.25
Table 2. The calculated instantaneous aerosol direct radiative forcing (DRF, in W m−2; from 0.3 to 2.5 µm) in clear-sky condition over dry grass, green grass, conifer, and deciduous surfaces. Other parameters used include AOD (at 0.55 µm) of 0.32, SSA (at 0.55 µm) of 0.89, and SZA of 30 degrees. Bold numbers represent the difference in aerosol forcing associated with different approaches to estimate surface reflectance spectrum. The numbers in parentheses indicate the ratio of the absolute difference to the aerosol forcing calculated with “true”.
DRF (in W m−2) Dry grass Green grass Conifer Deciduous
True 14.28 −8.25 −7.86 −6.28
MEVA 16.12 −7.62 −7.43 −5.7
Linear MODIS 13.43 −10.39 −10.54 −8.84 Averaged band MODIS 15.2 −10.38 −10.33 −8.7 Liang visible and near infrared 17.72 −9.88 −10.07 −8.06
Liang shortwave 27.03 −0.46 −0.74 2.66
Differences of DRF (in Wm−2)
MEVA – True 1.84 (13 %) 0.63 (8 %) 0.43 (5 %) 0.58 (9 %) Linear MODIS – True −0.85 (6 %) −2.14 (26 %) −2.68 (34 %) −2.56 (41 %) Average band MODIS – True 0.92 (6 %) −2.13 (26 %) −2.47 (31 %) −2.42 (39 %) Liang visible and near infrared – True 3.44 (24 %) −1.63 (20 %) −2.21 (28 %) −1.78 (28 %) Liang shortwave – True 12.75 (89 %) 7.79 (94 %) 7.12 (91 %) 8.94 (142 %)
Denver, Colorado, USA, and its reflectance spectrum is the average of the three measured spectra. Figure 8 shows the reflectance spectra from “true” and MEVA for these six dif-ferent aspen surfaces.
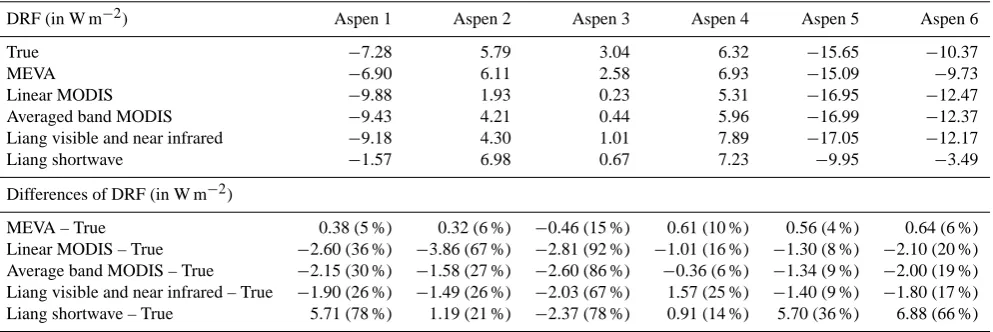
The outgoing flux at TOA and aerosol forcing were calcu-lated using these reflectance spectra as surface albedo, and the results are shown in Tables 4 and 5. With the exception of aspen 4, MEVA leads to the minimum difference to “true” for both flux and aerosol forcing compared to traditional ap-proaches. The aerosol forcing difference between MEVA and “true” is 0.61 W m−2for aspen 4, which is greater than the difference of−0.36 W m−2from the average band MODIS method. This might be related with the leaf color being “yel-low”, which implies strong reflectance in the range of 0.57 to 0.59 µm as seen in Fig. 8. Similar to the spectral behavior of
dry grass, the spectral behavior of aspen 4 might be caused by its low chlorophyll and water moisture content (Hoffer, 1978). This indicates that MEVA works best for green vege-tation types, but still produces reasonable results for yellow leaves. Overall, MEVA consistently improves the accuracy of the calculated outgoing flux at TOA and aerosol forcing.
3.3 Amazon vegetation
3062 L. Zhu et al.: Effect of spectral albedo on aerosol direct forcing
Table 3. The calculated instantaneous aerosol DRF (in W m−2)in different spectral ranges over deciduous surface. Other parameters used include: AOD (at 0.55 µm) = 0.32; SSA (at 0.55 µm) = 0.89; and SZA = 30 degrees. Bold numbers represent the differences in aerosol forcing between applying specific approaches and “true” in specified spectral ranges.
DRF (in W m−2) 0.3–0.55 µm 0.55–1.24 µm 1.24–1.63 µm 1.63–1.84 µm 1.84–2.1 µm 2.1–2.5 µm
True −10.25 3.37 0.47 0.11 0 0.02
MEVA −9.99 3.72 0.44 0.11 0.01 0.02
Linear MODIS −11.13 1.61 0.55 0.1 0.01 0.01
Averaged band MODIS −10.07 0.7 0.53 0.11 0.01 0.02
Liang visible and near infrared −10.31 1.41 0.55 0.17 0.04 0.08
Liang shortwave 0.4 1.96 0.17 0.07 0.01 0.03
Difference of DRF (in W m−2)
MEVA – True 0.26 0.35 −0.03 0 0.01 0
Linear MODIS – True −0.88 −1.76 0.08 −0.01 0.01 −0.01
Average band MODIS – True 0.18 −2.67 0.06 0 0.01 0
Liang visible and near infrared – True −0.06 −1.96 0.08 0.06 0.04 0.06 Liang shortwave – True 10.65 −1.41 −0.3 −0.04 0.01 0.01
Table 4. The calculated integration of the outgoing solar flux (in W m−2; from 0.3 to 2.5 µm) at TOA over aspen surface. Other parameters used in the calculation include AOD (at 0.55 µm) of 0.32; SSA (at 0.55 µm) of 0.89; and SZA of 30 degrees. Bold numbers represent the difference of the flux associated with applying different approaches to estimate the reflectance spectrum.
Flux (in W m−2) Aspen 1 Aspen 2 Aspen 3 Aspen 4 Aspen 5 Aspen 6
True 235.81 296.29 291.82 302.30 172.65 218.16 MEVA 234.74 292.37 284.38 300.04 174.18 219.67 Linear MODIS 219.98 277.69 273.17 296.36 164.42 204.73 Averaged band MODIS 220.86 282.53 273.93 298.44 163.87 204.91 Liang visible and near infrared 218.08 278.32 263.25 277.86 162.01 202.83 Liang shortwave 208.10 252.65 219.64 253.95 165.69 198.23
Differences of flux (in W m−2)
MEVA – True −1.07 −3.92 −7.44 −2.26 1.53 1.51 Linear MODIS – True −15.83 −18.60 −18.65 −5.94 −8.23 −13.43 Average band MODIS – True −14.95 −13.76 −17.89 −3.86 −8.78 −13.25 Liang visible and near infrared – True −17.73 −17.97 −28.57 −24.44 −10.64 −15.33 Liang shortwave – True −27.71 −43.64 −72.18 −48.35 −6.96 −19.93
Arai et al. (2010) were shown in Fig. 9, overlaid with their MEVA spectra. The spectra from Arai et al. did not show the reflectance value in the range of 1.35 to 1.45 µm and 1.85 to 1.95 µm, which were linearly connected in this study to represent “true”.
In a more detailed analysis, the outgoing flux at TOA and aerosol forcing were calculated with three biomass burn-ing aerosol models havburn-ing different absorption as shown in Fig. 10. In Fig. 10, the SSA curves are simulated from Mie code (Wiscombe, 1980) with 1.4589 as the real part of the refractive index and three cases of spectrally constant imag-inary refractive index equal to 0.0073, 0.0173, and 0.0273. According to aerosol optical properties studies (e.g. Dubovik et al., 2002; Eck et al., 2003), biomass burning aerosols have a relatively spectrally constant imaginary refractive in-dex. This simplification has also been applied to the biomass
burning aerosol study by Procopio et al. (2003). The size distribution was calculated through the Amazonian forest aerosol model by Dubovik et al. (2002).
L. Zhu et al.: Effect of spectral albedo on aerosol direct forcing 3063
Table 5. The calculated instantaneous aerosol DRF (in W m−2; from 0.3 to 2.5 µm) over aspen surfaces. Other parameters used in the calculation include AOD (at 0.55 µm) of 0.32; SSA (at 0.55 µm) of 0.89; and SZA of 30 degrees. Bold numbers represent the differences of aerosol forcing associated with applying different approaches and “true”; the numbers in parentheses represent the ratio of the absolute difference in aerosol forcing to the results calculated with “true”.
DRF (in W m−2) Aspen 1 Aspen 2 Aspen 3 Aspen 4 Aspen 5 Aspen 6
True −7.28 5.79 3.04 6.32 −15.65 −10.37
MEVA −6.90 6.11 2.58 6.93 −15.09 −9.73
Linear MODIS −9.88 1.93 0.23 5.31 −16.95 −12.47
Averaged band MODIS −9.43 4.21 0.44 5.96 −16.99 −12.37 Liang visible and near infrared −9.18 4.30 1.01 7.89 −17.05 −12.17
Liang shortwave −1.57 6.98 0.67 7.23 −9.95 −3.49
Differences of DRF (in W m−2)
MEVA – True 0.38 (5 %) 0.32 (6 %) −0.46 (15 %) 0.61 (10 %) 0.56 (4 %) 0.64 (6 %) Linear MODIS – True −2.60 (36 %) −3.86 (67 %) −2.81 (92 %) −1.01 (16 %) −1.30 (8 %) −2.10 (20 %) Average band MODIS – True −2.15 (30 %) −1.58 (27 %) −2.60 (86 %) −0.36 (6 %) −1.34 (9 %) −2.00 (19 %) Liang visible and near infrared – True −1.90 (26 %) −1.49 (26 %) −2.03 (67 %) 1.57 (25 %) −1.40 (9 %) −1.80 (17 %) Liang shortwave – True 5.71 (78 %) 1.19 (21 %) −2.37 (78 %) 0.91 (14 %) 5.70 (36 %) 6.88 (66 %)
Table 6. The calculated daily average aerosol DRF at equator and in equinox (in W m−2; from 0.3 to 2.35 µm) with different approaches to the surface reflectance spectrum. The last column presents the average aerosol forcing over the six vegetation types. Bold numbers indicate the differences in daily averaged aerosol forcing associated with different approaches; the numbers in parentheses represent the ratio of these differences to the results calculated with “true”. Other parameters used in the simulation include SSA (at 0.55 µm) of 0.89 and AOD (at 0.55 µm) of 0.32.
Average over the Daily average DRF (in W m−2) Veg 1 Veg 2 Veg 3 Veg 4 Veg 5 Veg 6 six vegetation
True −2.65 −8.68 −5.42 −4.80 −4.94 −5.25 −5.29 MEVA −2.56 −8.68 −5.51 −4.73 −4.94 −5.04 −5.24 Linear MODIS −3.91 −9.35 −6.54 −5.94 −6.09 −5.60 −6.24 Averaged band MODIS −4.03 −9.50 −6.63 −6.14 −6.34 −5.63 −6.38 Liang visible and near infrared −3.61 −9.57 −6.37 −5.91 −5.78 −4.85 −6.02 Liang shortwave 2.21 −7.32 −2.66 −1.14 0.02 −0.07 −1.49
Difference of daily average DRF (in W m−2)
MEVA – True 0.09 0.00 −0.09 0.07 0.00 0.21 0.05 (−0.9 %) Linear MODIS – True −1.26 −0.67 −1.12 −1.14 −1.15 −0.36 −0.95 (18.0 %) Average band MODIS – True −1.38 −0.81 −1.21 −1.34 −1.40 −0.38 −1.09 (20.6 %) Liang visible and near infrared – True −0.96 −0.89 −0.95 −1.11 −0.84 0.39 −0.73 (13.8 %) Liang shortwave – True 4.86 1.37 2.76 3.66 4.96 5.17 3.80 (−71.8 %)
approximation to the “true” surface albedo spectra, regard-ing the accuracy of the outgoregard-ing flux at TOA and the aerosol direct forcing.
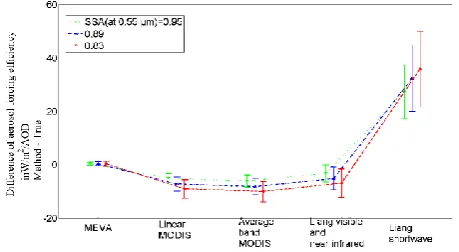
Moreover, the differences of the aerosol forcing efficiency associated with different methods to estimate reflectance spectrum are averaged over the six Amazonian vegetation types studied here. The results in Fig. 12 indicate that the aerosol forcing efficiency calculated through MEVA is the closest to that from “true” than the other traditional ap-proaches discussed here. The same conclusion is drawn from the studies with AODs equal to 0.64 and 1.28 (at 0.55 µm).
To assess the impacts of surface spectral albedo ap-proximations on the daily average aerosol forcing, we
3064 L. Zhu et al.: Effect of spectral albedo on aerosol direct forcing
41 758
Fig 10
759
760
Fig. 10. The plot on the left shows the wavelength dependence of AOD for the aerosol models used in the TOA flux and aerosol forc-ing calculations; the plots on the right display three different aerosol models used in the flux and aerosol forcing calculations: SSA (at 0.55 µm) = 0.95, 0.89, and 0.83.
42 761
Fig 11
762
763
Fig 12
764
Fig. 11. Difference of the aerosol forcing efficiency (in W m−2AOD−1)associated with different approaches to estimate reflectance spectra for vegetation types shown in Fig. 9. In each subplot, three groups indicate the results caused by using three dif-ferent aerosol models shown in Fig. 10: SSA (at 0.55 µm) = 0.95 (noted as “model 1”), 0.89 (noted as “model 2”), and 0.83 (noted as “model 3”). Other parameters used in the calculations include AOD (at 0.55 µm) = 0.32 and SZA = 30 degrees.
the “true” case using the high resolution surface reflectance spectrum. The magnitude of the average aerosol forcing dif-ference between MEVA and “true” is about 0.05 W m−2, much smaller than −0.95,−1.09,−0.73, and 3.80 W m−2 calculated using traditional approaches. The magnitude of the ratio of this difference to that from “true” is also the min-imum at−0.9 % compared to 18.0 %, 20.6 %, 13.8 %, and −71.8 % estimated through traditional approaches. A similar investigation was done with different aerosol models: SSA (at 0.55 µm) = 0.95 and 0.83; AOD (at 0.55 µm) = 0.64 and 1.28. Consistently, the results show that MEVA yields aver-age aerosol forcing closest to that from “true” compared with traditional approaches.
42 761
Fig 11
762
763
Fig 12
764 Fig. 12. The difference of aerosol forcing efficiency derived from averaging the results shown in Fig. 11 over the six Amazonian veg-etation types. Bars represent the standard deviation of the aerosol forcing efficiency differences among the six vegetation types. The labels on the x-axis denote different methods to estimate vegeta-tion reflectance spectrum used in the aerosol forcing calculavegeta-tion. The curves in green, blue, and red represent the results for differ-ent aerosol models: SSA (at 0.55 µm) = 0.95, 0.89, and 0.83. Other parameters used include AOD (at 0.55 µm) of 0.32 and SZA of 30 degrees.
43 765
Fig 13
766 Fig. 13. Aerosol forcing when SZA varies from 0 to 90 degrees
for vegetation types shown in Fig. 9. Curves in different symbols are associated with different approaches to estimate vegetation re-flectance spectrum used in the aerosol forcing calculation. Other parameters used in the calculations include AOD (at 0.55 µm) of 0.32 and SSA (at 0.55 µm) of 0.89.
4 Conclusions
L. Zhu et al.: Effect of spectral albedo on aerosol direct forcing 3065
and deciduous surfaces), the USGS digital spectral library (for aspen surface), and measurements of six Amazon vege-tation types. The gap filling for the missing red edge feature at 0.7 µm is the most significant due to the strong solar radi-ation input in this spectral range; the other two gap fillings for vegetation water absorption signatures are less impor-tant, due to the weaker solar radiation and strong atmospheric water absorption.
Flux and aerosol forcing calculation results indicate that MEVA has significant advantages over traditional ap-proaches in accurately calculating radiative fluxes and aerosol radiative forcing. For the studied cases with AOD (at 0.55 µm) = 0.32, MEVA improved the accuracy of the outgoing flux at TOA by up to 60 W m−2 (nearly 20 % of the flux value derived from “true”), aerosol forcing by up to 10 W m−2(about 70 % of the forcing value derived from “true”), daily averaged aerosol forcing at equator at equinox by up to 3.7 W m−2 (about 70 % of the forcing value de-rived from “true”). A similar conclusion was drawn from parallel studies applying AOD (at 0.55 µm) = 0.64 and 1.28. For aerosol forcing, MEVA led to errors less than 1 W m−2 with the exception of dry grass, which produced an error of 1.84 W m−2. This greater error might be associated with lower chlorophyll and water content of dry grass compared with the other discussed vegetation types. The combination of MEVA results with our retrievals of SSA for biomass burning aerosols (Zhu et al., 2011) will improve the estimate of radiative forcing and their impacts on climate by providing more accurate flux and aerosol forcing calculations.
Our exercise in this study shows that MEVA can be em-ployed to improve the accuracy of flux and aerosol forcing calculations for vegetated surfaces. Particularly with the pub-licly available global surface albedo data at MODIS seven channels, MEVA can be integrated into radiative transfer cal-culations and contribute to regional climate studies over veg-etated areas. In this study, the MEVA algorithm validation used laboratory measurements of leaf reflectance as land sur-face albedo in radiative transfer simulations. This work can be further improved with the analysis of real remote sensing data where individual pixels might be composed of mixed different land and vegetation types including yellow leaves.
Acknowledgements. We would like to thank NASA for funding this project under the grant NNX08AJ78G and IDS project, managed by H. Maring. We also would like to thank the MODIS team for their excellent work on the instrument development, maintenance, and calibration. We thank their effort on data quality control and providing data to the public as well. Thanks also go to Elisa Thome Sena for her constructive comments and suggestions.
Edited by: P. Stammes
References
Arai, E., Pereira, G., Coura, S. M. C., Cardozo, F. S., Silva, F. B., Shimabukuro, Y. E., Moraes, E. C., Freitsa, R. M., and Espirito-Santo, F. D. B.: Spectral signature of leaves of Amazon rainfor-est tree species, IGARSS, 2011 IEEE International, 4788–4791, 2010.
Asner, G. P., Wessman, C. A., Bateson, C. A., and Privette, J. L.: Impact of tissue, canopy, and landscape factors on the hyper-spectral reflectance variability of arid ecosystems, Remote Sens. Environ., 74, 69–84, 2000.
Betts, R. A.: Offset of the potential carbon sink from boreal foresta-tion by decreases in surface albedo, Nature, 408, 187–190, 2000. Ceccato, P., Flasse, S., Tarantola, S., Jacquemoud, S., and Gregoire, J. M.: Detecting vegetation leaf water content using reflectance in the optical domain, Remote Sens. Environ., 77, 22–33, 2001. Cess, R. D.: Biosphere-albedo feedback and climate modeling, J.
Atmos. Sci., 35, 1765–1767, 1978.
Clark, R. N., Swayze, G. A., Wise, R., Livo, E., Hoefen, T., Kokaly, R., and Sutley, S. J.: USGS digital spectral library splib06a: US Geological Survey, Digital Data Series 231, http://speclab. cr.usgs.gov/spectral.lib06 (last access: November 2012), 2007. Collins, W.: Remote sensing of crop type and maturity, Engineering,
44, 43–55, 1978.
Dickinson, R. E.: Land surface processes and climate-Surface albe-dos and energy balance. Advances in Geophysics, 25, 305–353, Theory of Climate, Academic Press Inc. Published by Elsevier Ltd, 1983.
Dickinson, R. E.: Land processes in climate models, Remote Sens. Environ., 51, 27–38, 1995.
Diner, D.: Level 2 surface retrieval algorithm theoretical basis, JPL 11401, Revision E, 2008.
Dirmeyer, P. A. and Shukla, J.: The response of the general circula-tion to deforestacircula-tion in the tropics, American Meteorology Soci-ety, Proc., 5th Symposium on Global Change, 131–134, 1994. Dubovik, O., Holben, B. N., Eck, T. F., Smirnov, A., Kaufman, Y. J.,
King, M. D., Tanr´e, D., and Slutsker, I.: Variability of absorption and optical properties of key aerosol types observed in world-wide locations, J. Atmos. Sci., 59, 590–608, 2002.
Eck, T. F., Holben, B. N., Ward, D. E., Mukelabai, M. M., Dubovik, O., Smirnov, A., Schafer, J. S., Hsu, N. C., Piketh, S. J., Queface, A., Le Roux, J., Swap, R. J., and Slutsker, I.: Variability of biomass burning aerosol optical characteristics in southern Africa during the SAFARI 2000 dry season cam-paign and a comparison of single scattering albedo estimates from radiometric measurements, J. Geophys. Res., 108, 8477, doi:10.1029/2002JD002321, 2003.
Gilgen, H., Whitlock, C., Koch, F., M¨uller, G., Ohmura, A., Steiger, D., and Wheeler, R.: Technical Plan for BSRN (Baseline Sur-face Radiation Network) Data Management, Version 2.1 (final), MO/TD-No. 443, WCRP/WMO, 1995.
Gitelson, A. A., Merzlyak, M. N., and Lichtenthaler, H. K.: Detec-tion of red edge posiDetec-tion and Chlorophyll content by reflectance measurements near 700 nm, J. Plant Physiol., 148, 501–508, 1996.
3066 L. Zhu et al.: Effect of spectral albedo on aerosol direct forcing
Hall, F. G. and Sellers, P. J.: First International Satellite Land Surface Climatology Project (ISLSCP) Field Experi-ment (FIFE) in 1995, J. Geophys. Res., 100, 25383–25395, doi:10.1029/95JD03300, 1995.
Hoffer, R. M.: Biological and physical considerations in applying computer-aided analysis techniques to remote sensing data, in: Remote Sensing: The Quantitative Approach, edited by: Swain, P. H. and Davis, S. M., McGraw-Hill, 227–289, 1978.
Horler, D. N. H., Dockray, M., and Barber, J.: The red edge of plant leaf reflectance, Int. J. Remote Sens., 1, 121–136, 1983. Hosgood, B., Jacquemoud, S., Andreoli, G., Verdebout, J., Pedrini,
A., and Schmuck, G.: Leaf Optical Properties EXperiment 93 (LOPEX93), Report EUR 16095 EN, 1994.
Kim, M. S., Daughtry, C. S., Chappelle, E. W., Mcmurtrey, J. E., and Walthall, C. L.: The use of high spectral resolution bands for es-timating absorbed photonsynthetically active radiation (A PAR), in: Proceedings of the 6th Symposium on Physical Measure-ments and Signatures in Remote Sensing, Val D’Isere, France, 17–21 January, 299–306, 1994.
Koelemeijer, R. B. A., de Haan, J. F., and Stammes, P.: A database of spectral surface reflectivity in the range 335–772 nm derived from 5.5 years of GOME observations, J. Geophys. Res., 108, 4070, doi:10.1029/2002JD002429, 2003.
Leroy, M., Deuze, J. L., Breon, F. M., Hautecoeur, O., Herman, M., Buriez, J. C., Tanre, D., Bouffies, S., Chazette, P., and Roujean, J. L.: Retrieval of atmospheric properties and surface bidirectional reflectances over land from POLDER/ADEOS, J. Geophys. Res., 102, 17023–17037, 1997.
Liang, S., Strahler, A. H., and Walthall, C.: Retrieval of land surface albedo from satellite observations: a simulation study, J. Appl. Meteorol., 38, 712–725, 1999.
Lofgren, B. M.: Surface albedo-climate feedback simulated using two-way coupling, J. Climate, 8, 2543–2562, 1995.
Lucht, W., Schaaf, C. B., and Strahler, A. H.: An algorithm for the retrieval of albedo from space using semiempirical BRDF mod-els, IEEE Geosci. Remote S., 38, 977–998, 2000.
Lucht, W., Prentice, I. C., Myneni, R. B., Sitch, S., Friedling-stein, P., Cramer, W., Bousquet, P., Buermann, W., and Smith, B.: Climatic control of the high-latitude vegetation green-ing trend and pinatubo effect, Science, 296, 1687–1689, doi:10.1126/science.1071828, 2002.
Lyapustin, A. I.: Atmospheric and geometrical effects on land surface albedo, J. Geophys. Res., 104, 4127–4143, doi:10.1029/1998JD200064, 1999.
McComiskey, A., Schwartz, S. E., Schmid, B., Guan, H., Lewis, E. R., Ricchiazzi, P., and Ogren, J. A.: Direct aerosol forcing: Cal-culation from observables and sensitivities to inputs, J. Geophys. Res., 113, D09202, doi:10.1029/2007JD009170, 2008.
Moody, E. G., King, M. D., Platnick, S., Schaaf, C. B., and Gao, F.: Spatially complete global spectral surface albedos: value-added datasets derived from Terra MODIS land products, IEEE Geosci. Remote S., 43, 144–158, 2005.
Muller, J.-P.: MERIS GLOBAL LAND SURFACE ALBEDO MAPS: Algorithm Theoretical Basis Docu-ment ATBD 1.4 BRDF/ALBEDO RETRIEVAL, avail-able at: http://www.brockmann-consult.de/albedomap/pdf/ MERIS-AlbedoMap-ATBD BRDF Albedo-1.0.pdf (last access: May 2012), 2006.
Myhre, G., Kvalev˚ag, M. M., and Schaaf, C. B.: Radiative frocing due to anthropogenic vegetation change based on MODIS surface albedo data, Geophys. Res. Lett., 32, L21410, doi:10.1029/2005GL024004, 2005.
Nobre, C. A., Sellers, P. S., and Shukla, J.: Amazonian deforestation and regional climate change, J. Climate, 4, 957–988, 1991. Patadi, F., Yang, E.-S., and Christopher, S. A.: Does dust change
the clear sky top of atmosphere shortwave flux over high sur-face reflectance regions? Geophys. Res. Lett., 36, L15825, doi:10.1029/2009GL039092, 2009.
Popp, C., Wang, P., Brunner, D., Stammes, P., Zhou, Y., and Grzegorski, M.: MERIS albedo climatology for FRESCO + O2 A-band cloud retrieval, Atmos. Meas. Tech., 4, 463–483, doi:10.5194/amt-4-463-2011, 2011.
Procopio, A. S., Remer, L. A., Artaxo, P., Kaufman, Y. J., and Holben, B. N.: Modeled spectral optical properties for smoke aerosols in Amazonia, Geophys. Res. Lett., 30, 2265, doi:10.1029/2003GL018063, 2003.
Ricchiazzi, P., Yang, S., Gautier, C., and Sowle, D.: SBDART: A research and teaching software tool for plane-parallel radiative transfer in the Earth’s atmosphere, B. Am. Meteorol. Soc., 79, 2101–2114, 1998.
Roberts, D. A., Nelson, B. W., Adams, J. B., and Palmer, F.: Spectral changes with leaf aging in Amazon caatinga, Trees – Structure and Function, 12, 315–325, doi:10.1007/s004680050157, 1990. Saunders, R. W.: The determination of broad band surface albedo
from AVHRR visible and near-infrared radiances, Int. J. Remote Sens., 11, 49–67, 1990.
Schaaf, C. B., Gao, F., Strahler, A. H., Lucht, W., Li, X., and Tsnag, T.: First operational BRDF, albedo nadir reflectance products from MODIS, Remote Sens. Environ., 83, 135–148, 2002. Sei, A: Joint Polar Satellite System (JPSS) VIIRS
sur-face albedo algorithm theoretical basis document (ATBD), GSFC JPSS CMO 474-00040, available at: http: //npp.gsfc.nasa.gov/science/sciencedocuments/ATBD 122011/ 474-00040 VIIRS Surface Albedo ATBD Rev- 20110422.pdf (last access: November 2012), 2011.
Sellers, P. J., Hall, F. G., Asrar, G., Strebel, D. E., and Murphy, R. E.: An overview of the First International Satellite Land Surface Climatology Project (ISLSCP) Field Experiment (FIFE), J. Geo-phys. Res., 97, 18355–18371, 1992.
Shukla, J., Nobre, C., and Sellers, P.: Amazon Defor-estation and climate change, Science, 247, 1322–1325, doi:10.1126/science.247.4948.1322, 1990.
Sims, D. A. and Gamon, J. A.: Relationship between leaf pigment content and spectral reflectance across a wide range of species, leaf structures and developmental stages, Remote Sens. Environ., 81, 337–354, 2002.
Staenz, K., Williams, D. J., and Walker, B.: Surface reflectance re-trieval from AVIRIS data using a six dimensional look up table, in: Summaries of the Sixth Annual JPL Earth Science Workshop, Jet Propulsion Laboratory, Pasadena, CA, 223–230, 1996. Stimson, H. C., Breshears, D. D., Ustin, S. L., and Kefauver, S. C.:
Spectral sensing of folier water conditions in two co-occuring conifer species: Pinus edulis and Juniperus monosperma, Remote Sens. Environ., 96, 108–118, 2005.
L. Zhu et al.: Effect of spectral albedo on aerosol direct forcing 3067
Background, operational algorithm and validation, J. Geophys. Res., 102, 17131–17141, doi:10.1029/97JD00201, 1997. Wang, P., Knap, W. H., and Stammes, P.: Cloudy sky shortwave
ra-diative closure for a Baseline Surface Radiation Network site, J. Geophys. Res., 116, D08202, doi:10.1029/2010JD015141, 2011. Wiscombe, W. J.: Improved Mie scattering algorithm, Appl. Optics,
19, 1505–1509, 1980.
Yu, H., Dickinson, R. E., Chin, M., Kaufman, Y. J., Zhou, M., Zhou, L., Tian, Y., Dubovik, O., and Holben, B. N.: The direct ra-diative effect of aerosols as determined from a combination of MODIS retrievals and GOCART simulations, J. Geophys. Res., 109, D03206, doi:10.1029/2003JD003914, 2004.
Yu, H., Kaufman, Y. J., Chin, M., Feingold, G., Remer, L. A., An-derson, T. L., Balkanski, Y., Bellouin, N., Boucher, O., Christo-pher, S., DeCola, P., Kahn, R., Koch, D., Loeb, N., Reddy, M. S., Schulz, M., Takemura, T., and Zhou, M.: A review of measurement-based assessments of the aerosol direct ra-diative effect and forcing, Atmos. Chem. Phys., 6, 613–666, doi:10.5194/acp-6-613-2006, 2006.
Zhou, M., Yu, H., Dickinson, R. E., Dubovik, O., and Hol-ben, B. N.: A normalized description of the direct effect of key aerosol types on solar radiation as estimated from aerosol robotic network aerosols and Moderate Resolution Imaging Spectroradiometer albedos, J. Geophys. Res., 110, D19202, doi:10.1029/2005JD005909, 2005.