Drink. Water Eng. Sci., 2, 1–14, 2009 www.drink-water-eng-sci.net/2/1/2009/
©Author(s) 2009. This work is distributed under the Creative Commons Attribution 3.0 License.
Drinking Water
Engineering and Science
The Dutch secret: how to provide safe drinking water
without chlorine in the Netherlands
P. W. M. H. Smeets1,2, G. J. Medema1, and J. C. van Dijk2
1Kiwa Water Research, Groningenhaven 7, 3433 PE Nieuwegein, The Netherlands 2Technical University Delft, P.O. Box 5048, 2600 GA Delft, The Netherlands
Received: 26 August 2008 – Published in Drink. Water Eng. Sci. Discuss.: 27 October 2008 Revised: 11 March 2009 – Accepted: 11 March 2009 – Published: 16 March 2009
Abstract. The Netherlands is one of the few countries where chlorine is not used at all, neither for primary disinfection nor to maintain a residual disinfectant in the distribution network. The Dutch approach that allows production and distribution of drinking water without the use of chlorine while not compromising microbial safety at the tap, can be summarized as follows:
1. Use the best source available, in order of preference:
– microbiologically safe groundwater,
– surface water with soil passage such as artificial recharge or bank filtration,
– direct treatment of surface water in a multiple barrier treatment;
2. Use a preferred physical process treatment such as sedimentation, filtration and UV-disinfection. If abso-lutely necessary, also oxidation by means of ozone or peroxide can be used, but chlorine is avoided; 3. Prevent ingress of contamination during distribution;
4. Prevent microbial growth in the distribution system by production and distribution of biologically stable (biostable) water and the use of biostable materials;
5. Monitor for timely detection of any failure of the system to prevent significant health consequences. New developments in safe drinking water in the Netherlands include the adaptation of the Dutch drinking water decree, implementation of quantitative microbial risk assessment (QMRA) by water companies and research into source water quality, drinking water treatment efficacy, safe distribution and biostability of drinking water during distribution and Legionella. This paper summarizes how the Dutch water companies warrant the safety of the drinking water without chlorine.
1 Introduction
The Netherlands is one of the few countries where chlorine is not used at all, neither for primary disinfection nor to main-tain a residual disinfectant in the distribution network. Al-though it is generally believed that a chemical disinfection in-creases drinking water safety, the Dutch feel that it provides more problems than benefits. Therefore, the Dutch have
Correspondence to: J. C. van Dijk (j.c.vandijk@tudelft.nl)
2 P. W. M. H. Smeets et al.: The Dutch secret 1. Use the best source available, in order of preference:
– microbiologically safe groundwater,
– surface water with soil passage such as artificial
recharge or bank filtration,
– direct treatment of surface water in a multiple
bar-rier treatment;
2. Use a preferred physical process treatment such as sedi-mentation, filtration and UV-disinfection. If it cannot be avoided, also oxidation by means of ozone or peroxide can be used but chlorine is not used;
3. Prevent ingress of contamination during distribution; 4. Prevent microbial growth in the distribution system
by production and distribution of biologically stable (biostable) water and the use of biostable materials; 5. Monitor for timely detection of any failure of the system
to prevent significant health consequences.
New developments in safe drinking water in the Nether-lands include the adaptation of the Dutch drinking water de-cree, implementation of quantitative microbial risk assess-ment (QMRA) by water companies and research into source water quality, drinking water treatment efficacy, safe distri-bution, biostability of drinking water during distribution and Legionella. This paper summarizes the previous publications by van der Kooij et al. (1995, 1999, 2003a) and provides an update of how the Dutch water companies warrant the safety of the drinking water without chlorine.
2 Legal requirements
Member states of the European Union have to implement the European drinking water directive (European Commission, 1998) in their national drinking water legislation. The Dutch drinking water decree (Staatsblad, 2001) generally applies stricter requirements for drinking water quality. Although the European directive allows exceptions for small supplies (less than 10 m3water per day or 50 persons), the Dutch reg-ulations do not include this. It was stated that drinking wa-ter should fulfill the same requirements regardless of system size. Moreover, the exception would only apply to a low number of systems. Monitoring requirements are related to the size of the system and will be discussed below. Dutch leg-islation includes no requirements for primary or secondary disinfection. A direct health-based target was included in the revision of the decree in 2001, and microbial requirements now include:
1. A QMRA for sites at risk (surface water) must show that the estimated risk of infection is below 1 infec-tion per 10 000 persons per year for enteric viruses, Cryptosporidium and Giardia and any other relevant pathogen.
(WHO) promotes a water safety plan (WSP) as a way to manage the safety of drinking water (WHO 2004). Many water companies have implemented or are implementing a WSP for their systems. The WSP framework, shown in Figure 1, provides a systematic approach to safe drinking water. This framework is used here to describe the Dutch approach to safe drinking water on a national level.
Assemble team
Describe water supply
Conduct hazard analysis
Identify control measures
Define operational limits
Establish monitoring
Establish corrective actions and incidence response
Establish record keeping
Validation and verification System
Assessment
Operational Monitoring
Management& Communication
Figure 1 Water Safety Plan scheme (WHO 2004)
3
.
System assessment3.1.Description of the Dutch water supply
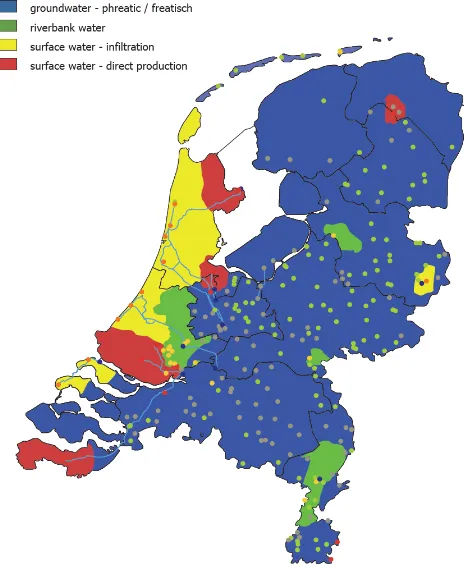
In the Netherlands the highest quality water source is selected for drinking water production. Since the start of drinking water supply in the Netherlands, the preferred source has therefore always been microbiologically safe groundwater (in the Netherlands this source can be found in confined sandy aquifers in most parts of the country, except the western provinces where the groundwater is brackish; see Figure 2). The water is distributed through a pressurized distribution system that prevents the ingress of water. Furthermore, the groundwater is usually biologically stable and, therefore, chlorination of the water to prevent bacterial growth is not needed. As a result, chlorine has never been used in the northern, eastern and southern parts of the country.
In the western part (city of Amsterdam, The Hague and surrounding urban area) fresh water was originally abstracted from the dunes. After World War II the natural replenishment became insufficient due to increasing urbanization and drinking water use. Now, surface water from the rivers Meuse and Rhine is pretreated, transported to the dunes and infiltrated. The infiltration of pretreated surface water enables more than a 10-fold capacity increase in the same abstraction area compared to natural groundwater. The rivers Rhine and Meuse provide sufficient quantities of water, however they are polluted by untreated and treated wastewater discharges, industrial activities and agricultural land use upstream. Infiltration provides a natural filter for pathogenic parasites, bacteria and viruses, a constant water
4 Figure 1.Water Safety Plan framework (WHO 2004).
2. E. coli and enterococci 0 CFU/100 ml
3. Aeromonas<1000 CFU/100 ml (operational parameter) 4. Colony count at 22◦C<100 CFU/ml
(operational parameter)
5. Coliforms and Clostridium perfringens 0 CFU/100 ml (operational parameter)
Implementation of the statutory QMRA has put the fo-cus on microbial drinking water safety again. It has led to the intensified monitoring of full-scale drinking water sys-tems and to research into treatment efficacy and distribution safety. The World Health Organization (WHO) promotes a water safety plan (WSP) as a way to manage the safety of drinking water (WHO, 2004). Many water companies have implemented or are implementing a WSP for their systems. The WSP framework, shown in Fig. 1, provides a system-atic approach to safe drinking water. This framework is used here to describe the Dutch approach to safe drinking water on a national level.
P. W. M. H. Smeets et al.: The Dutch secret 3
Figure 2.Source water types in the Netherlands.
3 System assessment
3.1 Description of the Dutch water supply
In the Netherlands the highest quality water source is se-lected for drinking water production. Since the start of drink-ing water supply in the Netherlands, the preferred source has therefore always been microbiologically safe groundwa-ter (in the Netherlands this source can be found in confined sandy aquifers in most parts of the country, except the west-ern provinces where the groundwater is brackish; see Fig. 2). The water is distributed through a pressurized distribution system that prevents the ingress of water. Furthermore, the groundwater is usually biologically stable and, therefore, chlorination of the water to prevent bacterial growth is not needed. As a result, chlorine has never been used in the northern, eastern and southern parts of the country.
In the western part (city of Amsterdam, The Hague and surrounding urban area) fresh water was originally abstracted from the dunes. After World War II the natural replenishment became insufficient due to increasing urbanization and drink-ing water use. Now, surface water from the rivers Meuse and Rhine is pretreated, transported to the dunes and infiltrated. The infiltration of pretreated surface water enables more than a 10-fold capacity increase in the same abstraction area com-pared to natural groundwater. The rivers Rhine and Meuse provide sufficient quantities of water, however they are
pol-luted by untreated and treated wastewater discharges, indus-trial activities and agricultural land use upstream. Infiltration provides a natural filter for pathogenic parasites, bacteria and viruses, a constant water quality and temperature, and a large storage reservoir to overcome pollution waves in the river. Infiltrated surface water is treated in a multiple barrier sys-tem to provide high quality drinking water. To a smaller ex-tent, artificial groundwater along rivers (river bank filtration) is used to provide a soil passage of surface water.
In some locations, including the Rotterdam and Amster-dam areas, direct treatment of surface water was also needed to satisfy the water demand. To improve source water qual-ity, off-stream reservoirs were constructed. On the one hand, this created a storage capacity which allowed the selective in-take of water during periods of poor river water quality. On the other hand, the water quality significantly improved dur-ing storage due to natural processes. Until 1973 the stored surface water was treated directly by coagulation, sedimen-tation, filtration and disinfection by chlorine. This water was distributed with a chlorine residual, which sometimes led to customer complaints about taste and odor. When the chemist from the Rotterdam water supply, Joop Rook, discovered that chlorine disinfection was responsible for the production of disinfectant by-products such as trihalomethanes (THM) (Rook, 1976), it led to a revolution in the philosophy regard-ing drinkregard-ing water treatment in the Netherlands.
4 P. W. M. H. Smeets et al.: The Dutch secret
Table 1.Typical numbers of pathogens in river water.
Minimum Maximum Reference
Enteric viruseses (PFU/l) 0.04 13 Theunissen et al. (1998)
Campylobacter (MPN/l) 10 10 000 Smeets et al. (2008b)
Giardia (cysts/l) 0.1 10 Schets et al. (2008)
Cryptosporidium (oocysts/l) 1.2 128 Medema et al. (2003)
for micro-pollutants as well as for microbes (Kruithof et al., 2007).
The groundwater supplies continued to distribute unchlo-rinated water. To further improve the water quality of sur-face water treatment plants (prevention of disinfection by-products and improved taste and odor), the focus of drinking water treatment shifted to producing biostable water. The philosophy was and still is to prevent growth in the distri-bution network by starvation rather than by the curative ap-proach of (apparently) suppressing regrowth with a disinfec-tant residual. Thus, there was no more need for a disinfecdisinfec-tant residual during distribution to prevent regrowth. The level of post-disinfection at surface water treatment plants was low-ered to such an extent that, in 2008, no chlorine is being ap-plied at all, and the few locations where chemical disinfec-tion is applied (chlorine dioxide) no residual disinfectant can be measured in the distributed water.
3.2 Hazard analysis
3.2.1 Hazards
Surface water supplies are facing numerous hazards, both microbial and chemical. The catchments of the rivers Rhine and Meuse are very large and cover several countries and pass through a great number of major cities. Thus, the wa-ter is contaminated by all sorts of human, animal and in-dustrial wastes. The water suppliers intensively monitor the river water at several stations and at the intake points for drinking water. Microbial hazards such as pathogenic pro-tozoa (Cryptosoridium and Giardia), bacteria (Campylobac-ter and E. coli O157) and viruses (en(Campylobac-teroviruses, Norovirus, Rotavirus, Hepatitis A and E viruses and adenovirus) are reg-ularly detected. Table 1 provides an overview of the numbers of pathogens detected in river water in the Netherlands.
Most of these organisms lead to mild symptoms such as gastroenteritis, but some can lead to severe illness or even death (see for details WHO guidelines 3rd edition, WHO 2004). Health consequences can also be more severe for specific groups (children, elderly, pregnant women, immuno-compromised persons).
Microorganisms with opportunistic pathogenic properties and the ability to multiply in drinking water networks, such
as Legionella, Aeromonas, Pseudomonas and mycobacteria, can constitute a risk during treatment or distribution. Since an outbreak of legionellosis following a flower show in 2000 (den Boer et al., 1999) , the prevention of Legionella growth has received much attention (van der Kooij et al., 2005).
Chemical hazards in the source water are not discussed in this paper. However, disinfection by-products (DBP) will be discussed since they can be formed during drink-ing water production and distribution. The DBPs of concern are trihalomethanes formed during chlorination and bromate formed during ozonation. These compounds can have muta-genetic or carcinomuta-genetic effects (Rook, 1976; Orlandini et al., 1997).
Taste, odor, color and turbidity are also considered hazards (Table 4). Although these parameters have no health effect, they need to be acceptable to the consumer. These hazards can be present in the source water but can also be created by treatment or distribution, e.g., temporary chlorination after maintenance leads to customer complaints.
3.2.2 Hazardous events
Hazardous events in source water are spills in the source wa-ter leading to peak concentrations of microbial or chemical hazards. Severe rain can lead to “spills” through runofffrom agricultural land, combined sewer overflows and failure/ by-pass of waste-water treatment plants. Drought can also form a hazard since river water is more concentrated and a higher percentage of it consists of wastewater. Since the Meuse and Rhine rivers are continuously polluted with wastewater, the concentrations of pathogens constantly vary. One would only refer to events in case of extreme levels of contamination. A hazard that is related to the groundwater supply is contami-nation at or close to the well-head. Although this has led to the detection of fecal indicators in the water, an outbreak of disease has not occurred.
Hazardous events during treatment can include equipment failure, operational error or improper protection of the water, e.g., rainwater leakage into the process water. These events have not been systematically analyzed at a national level. However, many potential hazards have been identified in the process of developing water safety plans. Important poten-tial hazards were ventilation openings at different stages of
P. W. M. H. Smeets et al.: The Dutch secret 5 treatment, temporary adaptations to the system for startup
or maintenance that were not removed (e.g., connection be-tween raw- and treated water) and unhygienic cleaning prac-tices. However, the major hazard appears to be human error. Therefore, adequate training of personnel is the most impor-tant measure for risk reduction during treatment.
All three outbreaks that occurred in the Netherlands since 1945 were caused by cross-connections during distribution: one to a sewer (Gemeentewaterleidingen Amsterdam, 1962), a second to wastewater from a navy vessel through a drinking water supply connection (Huisman and Nobel, 1981), and the third to a household water supply system in 2001 (Raad voor de Transportveiligheid, 2003). Other hazardous events have led to the contamination of drinking water with E. coli but did not lead to the outbreak of disease. These events were:
– leakage of a drinking water reservoir
(esp. in combination with heavy rainfall);
– mains breaks;
– maintenance and repair;
– pressure loss.
Outbreaks and hazardous events have been analyzed in in-ternational studies (Hrudey and Hrudey, 2004; Westrell et al., 2003; Risebro et al., 2007; Nilsson et al., 2007). These have shown that hazards in source water, treatment and dis-tribution can all lead to outbreaks and that outbreaks are of-ten a consequence of simultaneous events in these parts of the drinking water system. The Techneau Hazard Database (Beuken, 2007) provides an overview of hazardous events that were identified by an international research team. It can be used as a checklist for risk assessment and management.
3.3 Identify control measures
3.3.1 Protection of groundwater
Groundwater is the preferred source for the production of drinking water in the Netherlands. Groundwater in the Netherlands is abstracted within restricted areas, where land use is regulated. Land in the immediate neighborhood of the abstraction wells is owned by the water companies. Wa-ter from outside the restricted areas will take at least 25–50 years to arrive at the abstraction wells. These large areas (in total some 1500 km2, 4.4% of the land area in the Nether-lands) allow adequate protection and a very long response time in case of a groundwater contamination. Groundwater protection zones prevent contamination around the drinking water wells. In general a 60-day zone with the highest level of protection prevents fecal contamination. Confined sandy aquifers are covered by impermeable clay layers which pro-tect the groundwater from surface contamination. The 60-day zone allows sufficient time and distance for highly ef-fective filtration and the die-offof microorganisms (Schijven
area in the Netherlands) allow adequate protection and a very long response time in case of a groundwater contamination. Groundwater protection zones prevent contamination around the drinking water wells. In general a 60-day zone with the highest level of protection prevents fecal contamination. Confined sandy aquifers are covered by impermeable clay layers which protect the groundwater from surface contamination. The 60-day zone allows sufficient time and distance for highly effective filtration and the die-off of microorganisms (Schijven 2002, van der Wielen 2008). A few shallow anoxic aquifers require more than 60 days residence time. This high quality water requires no additional disinfection and is only treated for physical parameters such as oxygen, iron, ammonium and manganese by aeration and filtration. Risks of recontamination through poorly constructed wells or insufficient hygiene during construction and maintenance are mitigated by training personnel and by using strict hygienic protocols (Leunk 2007).
3.3.2.Selective intake and storage of surface water
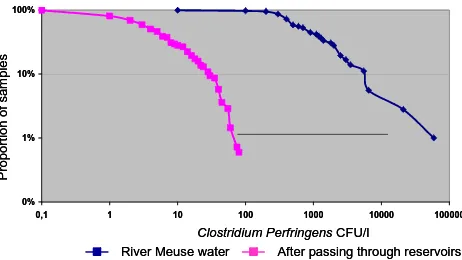
Surface water systems have several built-in control measures. In most cases the intake point can be changed to a different source during contamination events or water shortage. The available storage allows stoppage of the intake for days to months. Storage in reservoirs reduces the microbial hazards due to natural processes like die-off, sedimentation, UV inactivation and predation. Figure 3 shows the reduction of Clostridium Perfringens by retention in open reservoirs (van der Veer 2008). Pretreatment before storage and infiltration in the dunes also reduce microbial and chemical hazards.
0% 1% 10% 100%
0,1 1 10 100 1000 10000 100000
Clostridium PerfringensCFU/l
Pr
opor
tion of
sa
m
p
les
River Meuse water After passing through reservoirs 0%
1% 10% 100%
0,1 1 10 100 1000 10000 100000
Clostridium PerfringensCFU/l
Pr
opor
tion of
sa
m
p
les
River Meuse water After passing through reservoirs Figure 3 Clostridium Perfringens in river water and after raw water storage in open reservoirs for 5 months (van der Veer 2008)
3.3.3.Drinking water treatment to control microbial hazards
Since 2001 the microbial safety of drinking water has been regulated in the Netherlands by a health-based target of 10-4 risk of infection per person per year. A quantitative microbial risk
assessment (QMRA) is required to verify compliance of these targets for surface water treatment plants and other plants at risk. Drinking water treatment needs to be tailored to the hazards in the source water to provide safe water leaving the plant. This requires the assessment of source water quality and treatment efficacy. Instead of using log-credits (as applied in the USEPA LT2ESWTR 2006), the companies need to verify by monitoring (where possible) that their systems are indeed effective under both nominal and event conditions. By 2008 QMRA’s have been performed on the surface water systems in the Netherlands, providing insight into the actual efficacy of full-scale drinking water treatment. Table 2 provides an overview of the log reduction that is required to comply to the health-based target at Dutch surface water treatment plants.
8 Figure 3.Clostridium Perfringens in river water and after raw wa-ter storage in open reservoirs for 5 months (van der Veer, 2008).
and Hassanizadeh, 2002; van der Wielen et al., 2008). A few shallow anoxic aquifers require more than 60 days residence time. This high quality water requires no additional disin-fection and is only treated for physical parameters such as oxygen, iron, ammonium and manganese by aeration and fil-tration. Risks of recontamination through poorly constructed wells or insufficient hygiene during construction and mainte-nance are mitigated by training personnel and by using strict hygienic protocols (Leunk and van Lieverloo, 2007).
3.3.2 Selective intake and storage of surface water
Surface water systems have several built-in control measures. In most cases the intake point can be changed to a different source during contamination events or water shortage. The available storage allows stoppage of the intake for days to months. Storage in reservoirs reduces the microbial hazards due to natural processes like die-off, sedimentation, UV in-activation and predation. Figure 3 shows the reduction of Clostridium Perfringens by retention in open reservoirs (van der Veer, 2008). Pretreatment before storage and infiltration in the dunes also reduces microbial and chemical hazards.
3.3.3 Drinking water treatment to control microbial hazards
6 P. W. M. H. Smeets et al.: The Dutch secret
Table 2. Overview of required log reductions by drinking water treatment to comply to 10−4infection risk level at 4 locations in the
Netherlands.
Organism Location 1 Location 2 Location 3 Location 4
Cryptosporidium 6.4 5.6 5.1 6.5
Giardia 6.7 5.9 5.2 6.9
Campylobacter 8.4 8.5 8.6 6.9
Enteric viruses 4.3 4.3 4.2 5.7
surface water systems in the Netherlands, providing insight into the actual efficacy of full-scale drinking water treatment. Table 2 provides an overview of the log reduction that is re-quired to comply to the health-based target at Dutch surface water treatment plants.
Infiltration in the dunes or other means of soil passage are the major barrier against microbial hazards, since it con-tributes over 8 logs of pathogen reduction (Schijven, 1998, 2003; Medema and Stuyfzand, 2002). Consecutive barriers like filtration, disinfection and slow sand filtration each pro-vide some additional reduction of pathogens. Direct treat-ment of surface water relies on a series of barriers, includ-ing traditional processes like filtration, disinfection and slow sand filtration (Hijnen et al., 2005; Smeets, 2008a). These have been complemented with new techniques like UV dis-infection (Hijnen et al., 2006), advanced oxidation with UV-H2O2(Kruithof et al., 2007) and membrane filtration includ-ing ultrafiltration (UF) and reverse osmosis (RO) (Kamp et al., 2000).
3.3.4 Preventing contamination during distribution
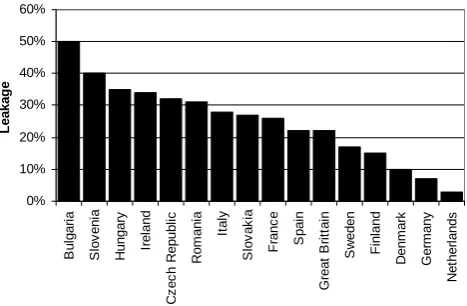
In the Netherlands the focus is on maintaining a high qual-ity distribution system with sufficient pressure to prevent ingress during normal operation. Additionally, strict hy-gienic protocols are set for building, maintenance and re-pair of distribution systems (van Lieverloo et al., 2002). The 100 000 km length of mains (>50 mm) consists of nonplas-tic polyvinyl chloride (PVC, 40%), asbestos (36%), cast iron (14%), polyethylene (2.5%) and others (7.5%). The leakage rate is low, generally<3%. A study showed that leakage is lower when pipelines are placed in sandy or clay soils, when water pressure is low and the proportion of PVC pipelines is high (VEWIN, 2005; DVGW, 2008). Figure 4 shows the leakage rates in several European countries.
Pressure fluctuations and surges that could result in neg-ative pressure in the distribution network are minimized by variable pumps, pressure dampening devices and automated distribution control to prevent large variations in flow (e.g., when filling reservoirs). Negative pressures (syphonage) and
Table 2 Overview of required log reductions by drinking water treatment to comply to 10-4 infection risk
level at 4 locations in the Netherlands
Organism Location 1 Location 2 Location 3 Location 4
Cryptosporidium 6.4 5.6 5.1 6.5
Giardia 6.7 5.9 5.2 6.9
Campylobacter 8.4 8.5 8.6 6.9
Enteric viruses 4.3 4.3 4.2 5.7
Infiltration in the dunes or other means of soil passage are the major barrier against microbial hazards, since it contributes over 8 logs of pathogen reduction (Schijven 1998, 2003; Medema and Stuyfzand 2002). Consecutive barriers like filtration, disinfection and slow sand filtration each provide some additional reduction of pathogens. Direct treatment of surface water relies on a series of barriers, including traditional processes like filtration, disinfection and slow sand filtration (Hijnen et al. 2005, Smeets 2008a). These have been complemented with new techniques like UV disinfection (Hijnen et al. 2006), advanced oxidation with UV-H2O2 (Kruithof et al. 2007) and membrane filtration including ultrafiltration (UF) and reverse osmosis (RO) (Kamp et al. 2000).
3.3.4.Preventing contamination during distribution
In the Netherlands the focus is on maintaining a high quality distribution system with sufficient pressure to prevent ingress during normal operation. Additionally, strict hygienic protocols are set for building, maintenance and repair of distribution systems (van Lieverloo et al. 2002). The 100,000 km length of mains (>50 mm) consists of nonplastic polyvinyl chloride (PVC, 40%), asbestos (36%), cast iron (14%), polyethylene (2.5%) and others (7.5%). The leakage rate is low, generally <3%. A study showed that leakage is lower when pipelines are placed in sandy or clay soils, when water pressure is low and the proportion of PVC pipelines is high (VEWIN 2005, DVGW 2008). Figure 4 shows the leakage rates in several European countries. 0% 10% 20% 30% 40% 50% 60% B u lg a ria S lov en ia H u n gar y Ir e la n d C z e c h R e p ubl ic Ro m a n ia Ita ly S lov ak ia Fr a n c e Sp a in Gr e a t B ri tt a in S w e den F inl and De n m a rk G e rm any N e th e rl a nds L e ak ag e
Figure 4 Leakage rates in European countries (VEWIN 2005, DVGW 2008)
Pressure fluctuations and surges that could result in negative pressure in the distribution network are minimized by variable pumps, pressure dampening devices and automated distribution control to prevent large variations in flow (e.g., when filling reservoirs). Negative pressures (syphonage) and high pressures in hilly areas are prevented by defining pressure zones with limited pressure ranges.
9
Figure 4. Leakage rates in European countries (VEWIN, 2005; DVGW, 2008).
high pressures in hilly areas are prevented by defining pres-sure zones with limited prespres-sure ranges.
The prevention of cross-connections and backflow is ex-tremely important. Connections to installations that could present a risk, for example through the connection of pumps or from high levels of pathogens at the location, are only al-lowed through a backflow prevention valve or a break tank. Examples of this are high-rise buildings with local pressure systems, industry and hospitals.
3.3.5 Preventing microbial growth in the distribution system
Measures to prevent microbial growth in the distribution sys-tem were described by van der Kooij (2003b). The following approaches are used to control or limit microbial activity in the distribution system in the absence of a disinfectant resid-ual:
– Production of biologically stable drinking water;
– A distribution system with non-reactive, biologically
stable materials;
– An optimized distribution system to prevent stagnation
and sediment accumulation.
Aerobic groundwater contains little organic compounds and is generally biostable. Anaerobic groundwater is gen-erally not biostable due to the presence of organic com-pounds, methane and ammonia. Treatment by aeration and sand filtration is generally sufficient to achieve biostable drinking water with AOC levels below 10µg carbon/l. Sur-face water requires extensive treatment to produce biostable water. Biological treatment processes, such as storage in open reservoirs, soil passage, granular activated car-bon filtration and (slow) sand filtration, in combination with physical and chemical treatment processes, such as
P. W. M. H. Smeets et al.: The Dutch secret 7 coagulation-sedimentation and oxidation, form a barrier
against biodegradable compounds. When ozonation is ap-plied, AOC is formed from larger organic compounds. Two-stage filtration is then needed to achieve biostable water. AOC is degraded in the first stage and the second stage re-moves the biomass and fines from the first stage. Biologi-cal filtration processes can reduce AOC and BDOC levels by 80%. Chlorine should be avoided in the influent of biological filters. In the Netherlands chlorine is not used in treatment and chlorine dioxide is only applied as a post-disinfection, and therefore does not affect any treatment processes. The contact times for ozonation are such that no residual ozone reaches the consecutive filtration steps. The effect of mem-brane filtration on biological stability depends on the type of membrane in combination with water characteristics. These relationships are not yet clear.
The biostability of materials is tested with the biofilm for-mation potential (BFP) test (van der Kooij and Veenendaal, 1993). All materials in the Netherlands have to be tested by Kiwa before they can be used in drinking water. The major-ity of the distribution system consists of biostable asbestos cement or PVC, which is generally also used when old dis-tribution pipes are replaced (van der Kooij et al., 1999).
Optimized distribution systems are designed so that stag-nant zones are prevented and the build-up of sediment is pre-vented using advanced network modeling (Blokker, 2008). Since distribution systems have a long lifetime, changes to the design can only be implemented slowly. Still, measures in operation can reduce the build-up of sediment by (Vree-burg, 2007):
– Optimizing treatment to minimize particles in drinking
water entering the network;
– Applying sufficiently high flow velocities during distri-bution, resulting in a “self-cleaning network”;
– Regular flushing under specified conditions.
4 Operational monitoring
4.1 Source water monitoring
The Dutch drinking water decree requires monthly monitor-ing of coliforms and E. coli in abstracted groundwater and E. coli, enterococci and Clostridium perfringens for surface water. River water is monitored on-line and with grab sam-ples at several stations and at intake points for drinking water. The data are made available to water companies via the in-ternet. A range of biomonitors is used at the intake points to detect a broad range of chemical contaminants. Fish, mus-sels, daphnia and algae all have specific sensitivities to chem-ical contaminants. When an alarm is generated, the intake of water is stopped. Microbial parameters require more time for analysis, typically over 24 h. Faster methods are being developed, however these are not (yet) sufficiently rapid to
allow for active management of source water intake. Apart from the legally required parameters, monitoring programs to quantify pathogen concentrations in surface water are also regularly performed. The microbial monitoring data is used in a statistical analysis for the QMRA to estimate nominal and peak concentrations. Thus, risks from these hazards can be adequately quantified (Smeets, 2008a).
For groundwater abstractions that may be vulnerable for contamination at the surface or may be under the influence of surface water, the inspectorate guidance document (de Roda Husman and Medema, 2004) suggests event monitoring. The abstracted water should be tested for the presence of E. coli and F-specific coliphage in 10-l samples during event condi-tions, such as heavy rainfall or flooding. The sampling mo-ment should be corrected for the expected residence time for a contamination to reach the well to maximize the probability of detection.
4.2 Process monitoring
All surface water systems are equipped with automated con-trol systems (SCADA). Relevant process parameters such as pH and turbidity are measured on-line and are used for automated control. Important barriers against microbes are strictly monitored. Sufficient UV disinfection is guaranteed by monitoring the flow, UV transmission of the water and UV intensity of the UV lamps. Ozonation is controlled by measuring water flow, flow of and ozone concentration in the ozone dosing gas and the ozone residual in the water. Thus, sufficient Ct is controlled under all conditions. UF and RO are monitored by particle removal and sulfate removal, respectively. In addition regular off-line integrity tests are performed. The intensity of monitoring and control is re-lated to the required efficacy of the process. For example, highly effective barriers that achieve 6-log reduction require on-line monitoring to verify that the process is effective ev-ery 10 s (Smeets, 2008a). A new development is the design of integrated process control to optimize not only individual processes but also the total combined effect of all treatment processes (van der Helm, 2007).
8 P. W. M. H. Smeets et al.: The Dutch secret
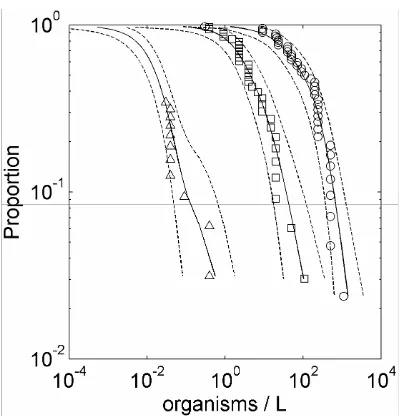
Figure 5 CCDF of monitored Campylobacter MPN concentrations (markers) and the medians (lines) and 95% CI (dashed lines) of the confidence interval for raw water ({), filtered water () and ozonated water (U) (Smeets et al. 2008b)
4.3.Microbial drinking water monitoring
Dutch legislation requires sampling the produced drinking water for E. coli, Clostridium
perfringens, coliforms and colony count on a weekly basis for groundwater, and daily for
surface water. In practice, produced drinking water is tested for the absence of E. coli in a 100
to 1000 ml sample on a daily basis and some water companies take large volume samples of up to 1000 l on a monthly basis.
4.4.Microbial monitoring in distribution
The statutory monitoring of distribution systems is related to the capacity of the system. Per
year 26 samples are required per 2,000 m3/day. So, for a system of 10,000 m3/day, 130
samples are required, spread around the distribution network. Samples are taken from reservoirs and taps in homes or public buildings.
5.Management and communication
5.1.Corrective action and incidence response
Corrective action is generally very specific per drinking water system. The water companies have prepared emergency responses for procedures and emergency plans. The
implementation of water safety plans is rapidly increasing in the Netherlands. Some general corrective actions are discussed here. Corrective actions for the source water include closing intake at moments of poor raw water quality and, in some cases, discharging the
contamination from the intake reservoir back into the river. Process control during treatment and corrective action are related to the types of processes. General hazards such as the loss of power or flooding are covered by emergency power supplies and by partitioning the system in water-tight compartments.
Events in distribution pose the biggest threat to safe drinking water at the tap. In case of contamination, the affected area is contained by selectively closing valves while maintaining pressure in the system. The system is flushed where possible and chlorination can be applied to inactivate pathogens that could remain in the distribution system after flushing. Customers are informed, e.g., by door-to-door boiling notices, the internet and radio. Regional crisis centers are used when the event is of significant size. When water safety is verified by
microbial sampling, the boiling notice is lifted (van Lieverloo et al. 2002). To prevent pressure losses, a water supply security plan was developed allowing other systems to partly take over water supply in an affected area.
12
Figure 5.CCDF of monitored Campylobacter MPN concentrations (markers) and the medians (lines) and 95% CI (dashed lines) of the confidence interval for raw water (), filtered water () and ozonated water (4) (Smeets et al., 2008b).
that exceeded a concentration. For example, 10% of the raw water samples exceeded a concentration of 900 MPN/l. Al-though the concentration varies over two log-units at each stage, Fig. 5 clearly shows that the treatment processes re-duce the concentrations. The data analysis allows an estima-tion of the frequency and magnitude of high concentraestima-tion events by extrapolating the distributions. It also provides an estimate of the distribution of concentrations below the de-tection limit after ozonation (shown by the part of the ozona-tion graph without markers).
4.3 Microbial drinking water monitoring
Dutch legislation requires sampling the produced drinking water for E. coli, Clostridium perfringens, coliforms and colony count on a weekly basis for groundwater, and daily for surface water. In practice, produced drinking water is tested for the absence of E. coli in a 100 to 1000 ml sample on a daily basis and some water companies take large volume samples of up to 1000 l on a monthly basis.
4.4 Microbial monitoring in distribution
The statutory monitoring of distribution systems is related to the capacity of the system. Per year 26 samples are re-quired per 2000 m3/day. So, for a system of 10 000 m3/day, 130 samples are required, spread around the distribution net-work. Samples are taken from reservoirs and taps in homes or public buildings.
5 Management and communication
5.1 Corrective action and incidence response
Corrective action is generally very specific per drinking wa-ter system. The wawa-ter companies have prepared emergency responses by procedures and emergency plans. The imple-mentation of water safety plans is rapidly increasing in the Netherlands. Some general corrective actions are discussed here. Corrective actions for the source water include closing intake at moments of poor raw water quality and, in some cases, discharging the contamination from the intake reser-voir back into the river. Process control during treatment and corrective action are related to the types of processes. Gen-eral hazards such as the loss of power or flooding are covered by emergency power supplies and by partitioning the system in water-tight compartments.
Events in distribution pose the biggest threat to safe drink-ing water at the tap. In case of contamination, the af-fected area is contained by selectively closing valves while maintaining pressure in the system. The system is flushed where possible and chlorination can be applied to inactivate pathogens that could remain in the distribution system after flushing. Customers are informed, e.g., by door-to-door boil-ing notices, the internet and radio. Regional crisis centers are used when the event is of significant size. When water safety is verified by microbial sampling, the boiling notice is lifted (van Lieverloo et al., 2002). To prevent pressure losses, a water supply security plan was developed allowing other sys-tems to partly take over water supply in an affected area.
5.2 Record keeping
The results of (microbial) water quality monitoring are col-lected by the water companies and laboratories in labora-tory information systems (LIMS). The results are reported to the Netherlands Ministry of Housing, Spatial planning and the Environment (VROM) that reports yearly on the Dutch drinking water quality. Incidents are also reported to VROM. Water companies store automated monitoring data which can then be used for analysis, e.g., in QMRA. Most water compa-nies have automated systems to record and store operational information (diaries) and failure reports. Periodically, these reports can be evaluated.
5.3 Verification of safe drinking water at the tap
5.3.1 Verification of microbial safety: health surveillance
Dutch outbreaks were summarized by van Lieverloo et al. (2007): “In the Netherlands, only three outbreaks have been reported for public drinking water systems since the end of World War II. The first of these occurred in 1962, when five cases of typhoid fever were reported in Amsterdam, probably as a result of a contamination of a drinking-water main with sewage (Gemeentewaterleidingen Amsterdam,
P. W. M. H. Smeets et al.: The Dutch secret 9 0 2 4 6 8 10 12 14
Ent. virus Camp. Giardia Crypto.
Log r e duc ti o n UV Filtr SSF Filtr Coa/sed Reservoir Required
Figure 6 Required and verified log reduction of microbial hazards at a Dutch treatment system according to the legislative QMRA study
Figure 7 shows the summarized QMRA results for 10 surface water treatment systems with respect to Giardia. The applied barriers can vary between systems and depend on the site-specific situation. At locations where soil passage is possible (systems 3, 4, 7 and 10), this process forms the major barrier against Giardia (and other microorganisms). Direct surface water treatment, however, requires multiple barriers to achieve safe drinking water (systems 1, 2, 5, 6, 8, 9).
Giardia 0 2 4 6 8 10 12 14 16 18
1 2 3 4 5 6 7 8 9 10
System number Lo g r e duct ion Post disinf RO UF UV Filtr SSF Filtr GAC Ozone Filtr RSF Coa/sed Soil passage Reservoir Required
Figure 7 Required and verified log reduction of Giardia at 10 Dutch treatment systems according to the legislative QMRA studies
Treatment efficacies in Figures 6 and 7 were based on microbial monitoring and surrogate monitoring at full-scale for the first treatment step (Hijnen et al. 2005). Pilot-scale experiments and process monitoring supported the estimated efficacy of the final treatment steps. For most systems, compliance with the 10-4 per person per year risk of infection could be proven
for all index pathogens. In some cases the available information was insufficient to verify this
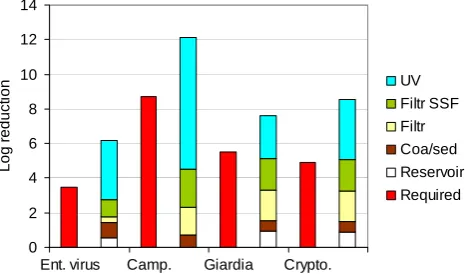
14 Figure 6. Required and verified log reduction of microbial haz-ards at a Dutch treatment system according to the legislative QMRA study.
1962). The second reported outbreak occurred in 1981 in Rotterdam, when sewage and wastewater from a foreign navy vessel were pumped into the distribution system via a drinking water supply valve for marine vessels. This event led to 609 reported cases, mainly of gastroenteri-tis. Pathogens isolated from stool samples included Giardia (8%), Campylobacter (5%), Entamoeba histolytica (2.3%), and Salmonella (1.2%) (Huisman and Nobel, 1981). In 2001, an outbreak of waterborne gastro-enteritis occurred in the Netherlands as a result of an accidental cross-connection be-tween the drinking water distribution system and a grey wa-ter distribution system, intended for flushing toilets, washing cloths and watering gardens in a new residential area (Raad voor de Transportveiligheid, 2003).” This last outbreak led to a legal ban on secondary quality water supply systems in housing.
5.3.2 Verification of microbial safety: QMRA of surface water systems
Since 2001 the Dutch water companies have assessed their drinking water systems through QMRA. Figure 6 shows the summarized results of such a QMRA study for one drinking water system. Numbers were taken from a QMRA study of a surface water treatment plant. The risk was assessed for four index pathogens. Cryptosporidium, Giardia and Enteric viruses are explicitly mentioned in the drinking water decree. Campylobacter was not named explicitly, however it is con-sidered a relevant index pathogen to cover risks from bacte-ria. The QMRA is summarized by pairs of bars in Fig. 6. The first bar shows the required log reduction by drinking water treatment based on the measured concentration of pathogens in source water and the health-based target. The second bar shows how the different treatment barriers contribute to achieving the required log reduction. The graph illustrates how the treatment barriers can have a different significance for the index pathogens. UV disinfection is essential for the
0 2 4 6 8 10 12 14
Ent. virus Camp. Giardia Crypto.
Log r e duc ti o n UV Filtr SSF Filtr Coa/sed Reservoir Required
Figure 6 Required and verified log reduction of microbial hazards at a Dutch treatment system according to the legislative QMRA study
Figure 7 shows the summarized QMRA results for 10 surface water treatment systems with respect to Giardia. The applied barriers can vary between systems and depend on the site-specific situation. At locations where soil passage is possible (systems 3, 4, 7 and 10), this process forms the major barrier against Giardia (and other microorganisms). Direct surface water treatment, however, requires multiple barriers to achieve safe drinking water (systems 1, 2, 5, 6, 8, 9).
Giardia 0 2 4 6 8 10 12 14 16 18
1 2 3 4 5 6 7 8 9 10
System number Lo g r e duct ion Post disinf RO UF UV Filtr SSF Filtr GAC Ozone Filtr RSF Coa/sed Soil passage Reservoir Required
Figure 7 Required and verified log reduction of Giardia at 10 Dutch treatment systems according to the legislative QMRA studies
Treatment efficacies in Figures 6 and 7 were based on microbial monitoring and surrogate monitoring at full-scale for the first treatment step (Hijnen et al. 2005). Pilot-scale experiments and process monitoring supported the estimated efficacy of the final treatment steps. For most systems, compliance with the 10-4 per person per year risk of infection could be proven for all index pathogens. In some cases the available information was insufficient to verify this
14 Figure 7. Required and verified log reduction of Giardia at 10 Dutch treatment systems according to the legislative QMRA stud-ies.
reduction of Campylobacter, while it is not essential, but pro-vides additional safety, against Cryptosporidium.
Treatment efficacies in Figs. 6 and 7 were based on mi-crobial monitoring and surrogate monitoring at full-scale for the first treatment step (Hijnen et al., 2005). Pilot-scale ex-periments and process monitoring supported the estimated efficacy of the final treatment steps. For most systems, com-pliance with the 10−4 per person per year risk of infection could be proven for all index pathogens. In some cases the available information was insufficient to verify this level, and more research was conducted. The quantitative approach did provide several eye-openers for the water companies such as:
– The importance of contamination through “indirect
flows” such as leakage near wells of an artificial infil-tration site;
– The impact of short incidents on the average yearly risk,
such as temporary failure of a dosing system;
– Suboptimal design of a process can have a strong impact
on treatment efficacy;
– The importance of strict sampling procedures to prevent
contamination of samples or the switching of samples since these errors can have a significant impact on the risk assessment outcome.
Given the outcomes of the QMRA studies, it could be stated that drinking water entering the distribution system is indeed safe and does not contain microbial pathogens at a level that would be of any health concern.
5.3.3 Verification of microbial safety: E. coli monitoring of produced drinking water
10 P. W. M. H. Smeets et al.: The Dutch secret
Table 3. Estimated mean infection risks per person per day when exposed to a mean concentration of thermotolerant coliforms of 1 CFU per 100 ml. For enteric viruses in soil or shallow groundwater, three selections of the available ratios were used. Culturable=only ratios of culturable enteric viruses to positive (>0) thermotolerant coliforms (coli44); positive data=ratios of positive enteric viruses (culturable and PCR) vs. coli44; all data=all ratios, including data points with one or both values below the detection limit (coli44 concentrations below detection limit were set to 50% of the detection limit) (van Lieverloo et al., 2007a).
Assuming P/Ea Assuming P/Ea Assuming P/Ea
ratios from sewage ratios from surface water ratios from soil
and shallow groundwater
Cryptosporidium 5.6×10⁻⁷ 3.2×10⁻⁴ –
Giardia 2.2×10⁻⁷ 2.7×10⁻⁵ –
Campylobacter 4.0×10⁻³ 4.8×10⁻² –
Enteric viruses
– culturable 6.3×10⁻⁷ 2.2×10⁻⁵ 6.8×10⁻³
– positive data – – 3.6×10⁻²
– all data – – 0.24
aP/E ratio: pathogen to E. coli or thermotolerant coliform ratio
– no data on pathogen to E. coli or thermotolerant coliform ratio available.
of this data showed that only one surface water treatment system had found E. coli in treated water in 0.08% of 5840 samples between 1996 and 2003. For all Dutch surface water treatment plants, only 5 out of 17 277 finished drinking water samples were positive (0.03%).
5.3.4 Verification of microbial safety: E. coli monitoring in distribution
Van Lieverloo et al. (2007a) found that 0.1% of the yearly samples of distributed drinking water (over 33 000 samples per year) in the Netherlands in 2001, 2002 and 2003 were positive for E. coli or thermotolerant coliforms. They also showed that the statutory monitoring program was not very sensitive for detecting sewage ingress (2007b). The analysis of large volumes of drinking water in the Netherlands (44 samples of max. 2001, total 7062 l) for the presence of E. coli has shown that this indicator of fecal contamination is not present in detectable background concentrations, even when disinfectant residuals are absent (van Lieverloo et al., 2007a; Hambsch et al., 2007).
Van Lieverloo et al. (2006, 2007a) have applied QMRA to estimate the health risks that detections of E. coli in dis-tributed water might indicate. They compared three assump-tions for the ratio between pathogen and thermotolerant col-iform (TTC) concentration related to the type of contamina-tion that occurred. In sewage, the ratio of Campylobacter, Cryptosporidium, Giardia and enteric viruses to TTC was estimated on the order of 10−3, 10−6, 10−5and 10−6, respec-tively. In surface water this was 10−1, 10−4, 10−3 and 10−5, and in soil and groundwater this was 10−2 to 1 for viruses.
Table 4. Typical water quality parameters in the Netherlands (de Moel, 2006).
Unit Surface water Groundwater Drinking water
Temperature ◦ 0–25 10–12 5–25
pH – 6–8 6–8.5 7–8
Turb NTU 0.1–100 – <0.1
O2 mg/l 5–10 0–7 6–11
Fe2+ mg/l – 0–10 <0.1
DOC mg/l 1–10 0–10 0–6
Table 3 shows the theoretical estimated daily risk of infec-tion resulting from these assumpinfec-tions. The results suggest that the risk from bacterial pathogens is high when TTC are detected.
5.3.5 Verification of microbial safety:
Legionellamonitoring
Currently, Legionella is the most significant known source of infection through drinking water in the Netherlands. For risk sites, such as swimming pools, hospitals, and residences for the elderly, a risk assessment and management plan (similar to Water Safety Plan) has to be drawn up and they are reg-ularly monitored for the presence of Legionella. PCR meth-ods, and currently also a new culture method (Veenendaal and van der Kooij, 2007), allow for a distinction between pathogenic Legionella pneumophila and non-pathogenic Le-gionella species, which form the majority of LeLe-gionella
P. W. M. H. Smeets et al.: The Dutch secret 11 found in drinking water installations (Wullings and van der
Kooij, 2006). This allows for a Legionella risk management approach that is directed at pathogenic types rather than all Legionella.
5.3.6 Verification of consumer satisfaction and confidence
Consumer trust in the Netherlands’ drinking water was sur-veyed in 2008 (VEWIN, 2008). Over 95% of the consumers fully trust the drinking water quality and its safety. The es-thetic quality of drinking water was compared to that of bot-tled (mineral or spring) water. Tap water was rated among the best for taste and odor and was therefore preferred by many consumers (Consumentenbond, 1997). The incidental use of chlorine for disinfection after construction, maintenance or repair, however, does lead to an increase in complaints about water quality.
6 Discussion
The Dutch approach of distributing drinking water without a disinfectant residual has been disputed many times. The following arguments in favor of disinfection are discussed here:
– Provides an additional barrier in case treatment is
inef-fective;
– Provides a barrier in case of ingress in the distribution
system;
– Prevents regrowth in the distribution system;
– Prevents outbreaks of disease due to chlorine residual.
6.1 Additional barrier
A disinfectant residual during distribution could mitigate the risks from inadequate drinking water treatment. Long con-tact times could result in significant CT values and thus in disinfection. Consumers living closer to the production site, however, would receive water that was less safe. Further-more, the disinfection process is poorly monitored and con-trolled when it takes place during distribution. Therefore, it makes more sense to properly treat the water at the pro-duction site. Comparing E. coli monitoring results between countries with and without secondary disinfection does not indicate a significantly lower number of detections when dis-infection is applied. Data from the UK indicated 0.02% of the (chlorinated) drinking water samples from the treatment plant were positive for E. coli, and in France up to 1% of the samples contained coliforms (no data on thermotolerant coliforms or E. coli) (van Lieverloo et al., 2007a). In the Netherlands approximately 0.01 to 0.09% of treated water samples were positive in the absence of disinfectant.
6.2 Barrier in case of ingress
In theory, residual chlorine could mitigate the effect of the ingress of contaminated water in the distribution system. However, it is likely that such water also contains a sig-nificant amount of organic compounds that would rapidly consume all residual chlorine. Microorganisms in the con-taminated water could be shielded from chlorine by attach-ment to particulate matter. Moreover, several pathogens can withstand exposure to chlorine (Cryptosporidium) and would not be inactivated. E. coli would be inactivated before most pathogens, thus a contaminated situation could exist for a prolonged period of time without being detected. Therefore, the additional safety provided is very limited. E. coli moni-toring data from the distribution network do not show a sig-nificantly lower number of detections in chlorinated systems. Data from the UK indicated 0.03 to 0.04% of the (chlori-nated) drinking water samples from the distribution network were positive for E. coli, and in France 0.4 to 1.0% of the samples contained coliforms (no data on thermotolerant col-iforms or E. coli) (van Lieverloo et al., 2007a). In the Nether-lands 0.1% of the samples from distribution systems without disinfection were positive for E. coli or thermotolerant col-iforms. This basic comparison indicates that the absence of chlorination does not lead directly to higher numbers of in-dicator bacteria.
6.3 Prevent regrowth
A comparative study of drinking water distribution in the United Kingdom and the Netherlands showed that a chlo-rine residual can be effective to control regrowth in the dis-tribution system. However, this does lead to the formation of DBPs and taste and odor complaints. By controlling the biostability of the water, the Dutch approach has shown that regrowth can also be controlled without a disinfectant resid-ual (van der Kooij et al., 2003b).
6.4 Outbreaks despite chlorination
12 P. W. M. H. Smeets et al.: The Dutch secret water supplier and inspectorate failed to recognize the need
for adequate treatment like filtration (23 cases) or disinfec-tion (12 cases). A water safety plan or QMRA would most likely have identified these needs. Similarly, contamination of source water was not recognized in many cases, leading to insufficient treatment. Most outbreaks occurred in sys-tems that applied a chlorine residual during distribution. The extremely low number of outbreaks in the Netherlands indi-cates the safety of the Dutch approach.
7 Conclusions
In the Netherlands water is distributed without a disinfec-tant residual. This was achieved by taking the following ap-proach:
1. Use the best sources available, in order of preference:
– microbiologically safe groundwater,
– surface water with soil passage such as artificial
recharge or bank filtration,
– direct treatment of surface water in a multiple
bar-rier treatment;
2. Treat using physical processes such as sedimentation, filtration and UV-disinfection. If it cannot be avoided also oxidation by means of ozone or peroxide can be used, but chlorine is not used;
3. Prevent ingress of contamination during distribution; 4. Prevent microbial growth in the distribution system by
production and distribution of biologically stable water and the use of biostable materials;
5. Monitor for timely detection of any failure of the system to prevent significant health consequences.
The success of this approach was achieved by the joint ef-fort of the Dutch water companies to constantly improve the water supply systems. Their joint research program allows efficient research with a close relationship to drinking wa-ter practice. In combination with well- trained and qualified staff, the improvements can be rapidly implemented in prac-tice. Also, specific circumstances in the Netherlands, such as population density, geography and economy, were favorable for these developments. As a consequence, outbreaks of dis-ease through drinking water are extremely rare. The results are that over 95% of Dutch consumers drink water from the tap daily and consumer trust and satisfaction are very high. Other countries can adapt the Dutch approach to their own situation. Relatively simple and robust techniques like infil-tration can be used in rural areas where land is cheap. New technologies with small footprints such as UF and H2O2-UV are more suitable for urban areas where land is scarce.
References
Beuken, R.: Identification and description of hazards for water sup-ply systems, in: A catalogue of today’s hazards and possible fu-ture hazards, edited by: Beuken, R., Techneau, 78 pp., 2008. Blokker, E. J. M., Vreeburg, J. H. G., Buchberger, S. G., and van
Dijk, J. C.: Importance of demand modelling in network water quality models: a review, Drink. Water Eng. Sci., 1, 27-38, 2008, http://www.drink-water-eng-sci.net/1/27/2008/.
Consumentenbond: Drinkwater getest, 18–19, 1997.
de Moel, P. J., Verberk, J. Q. J. C., van Dijk, J. C.: Drinking water – principles and practices, World Scientific Publishing, Singapore, 416 pp., 2006.
den Boer, J. W., Yzerman, E., Schellekens, J., Bruin, J. P., van Leeuwen, W., Mooijman, K., Veenendaal, H., Bergmans, A. M. C., van der Zee, A. N., van Ketel, R. J., Tijsen, H., and Conyn-van Spaendonck, M. A. E.: Onderzoek naar de bron Conyn-van een epi-demie van legionellose na de Westfriese Flora in Bovenkarspel (Research into the Legionellosis outbreak at Bovenkarspel), 83 pp., www.RIVM.nl, 2000.
de Roda Husman, A. M. and Medema, G.: Inspectierichtlijn, Anal-yse microbiologische veiligheid drinkwater, VROM-inspectie, 34 pp., www.vrom.nl, 2004.
DVGW: Verb¨ande pr¨asentieren “Branchenbild 2008”, http://www. dvgw.de, last access: 9 March 2008.
European Commisssion: Council Directive 98/83/EC of 3 Novem-ber 1998 on the quality of water intended for human consump-tion, European Commisssion, 1998.
Gemeentewaterleidingen Amsterdam: Year report 1962 of the City of Amsterdam (in Dutch: Jaarverslag 1962), Gemeentewaterlei-dingen Amsterdam, Amsterdam, The Netherlands, 1962. Hambsch, B., Bockle, K., and van Lieverloo, J. H. M.: Incidence
of faecal contaminations in chlorinated and non-chlorinated dis-tribution systems of neighbouring European countries, J. Water Health, 5, 119–130, 2007.
Hijnen, W. A., Beerendonk, E. F., and Medema, G. J.: Inactiva-tion credit of UV radiaInactiva-tion for viruses, bacteria and protozoan (oo)cysts in water: a review, Water Res., 40(1), 3–22, 2006. Hijnen, W. A. M., Beerendonk, E., and Medema, G. J.: Elimination
of microorganisms by drinking water treatment processes, 2nd Ed., Kiwa NV, Nieuwegein, The Netherlands, 101 pp., 2005. Hrudey, S. E. and Hrudey, E. J.: Safe drinking water – Lessons
learned from recent outbreaks in affluent nations, IWA Publish-ing, London, 514 pp., 2004.
Huisman, J. and Nobel, P. J.: Some epidemiological data on the ef-fects of the faecal contamination of drinking-water in the Scheep-vaartkwartier residential area in Rotterdam in March 1981 (in Dutch: Enkele epidemiologische gegevens over de gevolgen van de faecale drinkwaterverontreiniging in het Scheepvaartkwartier te Rotterdam in maart 1981, H2O 14(26), 642–646, 1981. Kamp, P. C., Kruithof, J. C., and Folmer, H. C.: UF/RO treatment
plant Heemskerk: from challenge to full scale application, De-salination, 131(1–3), 27–35, 2000.
Kruithof, J. C., Kamp, P. C., and Martijn, B. J.: UV/H2O2treatment:
A practical solution for organic contaminant control and primary disinfection, Ozone-Sci. Eng., 29(4), 273–280, 2007.
Leunk, I. and Lieverloo, J. H. M. v.: Hygi¨ene bij winmiddelen: hygi¨enecode drinkwater, KIWA Water Research, Nieuwegein, The Netherlands, 32 pp., 2007.
P. W. M. H. Smeets et al.: The Dutch secret 13
Medema, G. J. and Stuyfzand, P.: Removal of micro-organisms upon basin recharge, deep well injection and river bank filtra-tion in the Netherlands, in: Management of AquiferRecharge for Sustainability Proceedings of the Fourth International Sympo-sium on Artificial Recharge, edited by: Dillon, P. J., Balkama Press, Adelaide, Australia, 125–131, 2002.
Medema, G. J., Hoogenboezem, W., van der Veer, A. J., Ketelaars, H. A., Hijnen, W. A., and Nobel, P. J.: Quantitative risk assess-ment of Cryptosporidium in surface water treatassess-ment, Water Sci. Technol., 47(3), 241–247, 2003.
Nilsson, P., Roser, D., Thorwaldsdotter, R., Petterson, S., Davies, C., Signor, R., Bergstedt, O., and Ashbolt, N.: SCADA data and the quantification of hazardous events for QMRA, J. Water Health, 5, 99–105, 2007.
Orlandini, E., Kruithof, J. C., vanderHoek, J. P., Siebel, M. A., and Schippers, J. C.: Impact of ozonation on disinfection and for-mation of biodegradable organic matter and bromate, J. Water Supply Res. T., 46(1), 20–30, 1997.
Raad voor de Transportveiligheid: Contamination of Drinking-water in Leidsche Rijn (in Dutch: Verontreiniging drinkDrinking-water Leidsche Rijn), Raad voor de Transportveiligheid, The Hague, Tthe Neterlands, 2003.
Risebro, H. L., Doria, M. F., Andersson, Y., Medema, G., Osborn, K., Schlosser, O., and Hunter, P. R.: Fault tree analysis of the causes of waterborne outbreaks, J. Water Health, 5, 1–18, 2007. Rook, J. J.: Haloforms in drinking-water, J. Am. Water Works Ass.,
68(3), 168–172, 1976.
Schets, F. A., van Wijnen, J. H., Schijven, J. F., Schoon, A., and Husmant, A.: Monitoring of waterborne pathogens in surface waters in Amsterdam, The Netherlands, and the potential health risk associated with exposure to Cryptosporidium and Giardia in these waters, Appl. Environ. Microbiol., 74(7), 2069–2078, 2008.
Schijven, J. F., de Bruin, H. A. M., Hassanizadeh, S. M., and Hus-man, A. M. D.: Bacteriophages and clostridium spores as in-dicator organisms for removal of pathogens by passage through saturated dune sand, Water Res., 37(9), 2186–2194, 2003. Schijven, J. F. and Hassanizadeh, S. M.: Virus removal by soil
pas-sage at field scale and groundwater protection of sandy aquifers, Water Sci. Technol., 46(3), 123–129, 2002.
Schijven, J. F., Hoogenboezem, W., Nobel, P. J., Medema, G. J., and Stakelbeek, A.: Reduction of FRNA-bacteriophages and faecal indicator bacteria by dune infiltration and estimation of sticking efficiencies, Water Sci. Technol., 38(12), 127–131, 1998. Smeets, P. W. M. H.: Stochastic modelling of drinking water
treat-ment in quantitative microbial risk assesstreat-ment, Delft University of Technology, Delft, The Nehterlands, 2008a.
Smeets, P. W. M. H., Dullemont, Y. J., van Gelder, P. H. A. J. M., van Dijk, J. C., and Medema, G.: Improved methods for mod-elling drinking water treatment in quantitative microbial risk as-sessment; a case study of Campylobacter reduction by filtration and ozonation, J. Water Health, 6(3), 301–314, 2008b.
Staatsblad: Besluit van 9 januari 2001 tot wijziging van het water-leidingbesluit in verband met de richtlijn betreffende de kwaliteit van voor menselijke consumptie bestemd water (Adaptation of Dutch drinking water legislation), Staatsblad van het Koninkrijk der Nederlanden, 1–53, 2001.
Theunissen, J. J. H., Nobel, P. J., van de Heide, R., de Bruin, H. A. M., van Veenendaal, D., Lodder, W. J., Schijven, J. F.,
Medema, G. J., and van der Kooij, D.: Enterovirusconcentraties bij innamepunten van oppervlaktewater voor de bereiding van drinkwater (Enterovirus concentrations at collection sites of sur-face waters for drinking water production) RIVM, Bilthoven, The Netherlands, Report no: 289202013, 18 pp., www.RIVM.nl, 1998.
USEPA: LT2ESWTR, Long Term Second Enhanced Surface Wa-ter Treatment Rule, United States Environmental Protection Agency, Washington D.C., USA, 2006
van der Helm, A. W.: Intergated modeling of ozonation for opti-mization of drinking water treatment, Delft university of Tech-nology, Delft, The Netherlands, 2007.
van der Kooij, D., Veenendaal, H., and Scheffer, W. J. H.: Biofilm formation and multiplication of Legionella in a model warm wa-ter system with pipes of copper, stainless steel and cross-linked polyethylene, Water Res., 39(13), 2789–2798, 2005.
van der Kooij, D., van Lieverloo, J. H. M., Gale, P., and Stan-field, G.: Distributing drinking water with a low or zero disinfec-tant residual, Operational and biological aspect, UKWIR (Ed.), 2003a.
van der Kooij, D.: Managing regrowth in drinking water distribu-tion systems, in: Heterotrophic Plate Counts and Drinking-water Safety, edited by: Bartram, J., Cotruvo, J., Exner, M., Fricker, C., and Glasmacher, A., IWA Publishing, London, UK, 199–232, 2003b.
van der Kooij, D., van Lieverloo, J. H. M., Schellart, J., and Hiem-stra, P. Maintaining quality without a disinfectant residual, J. Am. Water Works Ass., 91(1), 55–64, 1999.
van der Kooij, D., Hijnen, W. A. M., Drost, Y. C., Willemsen-Zwaagstra, J., Nobel, P. J., and Schellart, J. A.: Multiple barriers against micro-organisms in water treatment and distribution in the Netherlands, Water Supply, 13(2), 13–23, 1995.
van der Kooij, D. and Veenendaal, H.: Assessment of the biofilm formation potential of synthetic materials in contact with drink-ing water durdrink-ing distribution, Miami, AWWA WQTC, 7–11 November 1993.
van der Veer, A. J.: Bijdrage aan het inzicht rond de verwijdering van indicatororganismen en pathogenen door het zuiveringspro-ces (Reduction of indicator organisms by treatment prozuiveringspro-cesses), Internal memo., Evides, Rotterdam, The Netherlands, 19 pp., 2008.
van der Wielen, P., Senden, W., and Medema, G.: Removal of Bacteriophages MS2 and Phi X174 during transport in a sandy anoxic aquifer, Environ. Sci. Technol., 42(12), 4589–4594, 2008. van Lieverloo, J. H. M., Mesman, G. A. M., Bakker, G. L., Bagge-laar, P. K., Hamed, A., and Medema, G.: Probability of detecting and quantifying faecal contaminations of drinking water by peri-odically sampling for E. coli: A simulation model study, Water Res., 41(19), 4299–4308, 2007b.
van Lieverloo, J. H. M., Blokker, E. J. M., and Medema, G.: Quan-titative microbial risk assessment of distributed drinking water using faecal indicator incidence and concentrations, J. Water Health, 5, 131–149, 2007a.
van Lieverloo, J. H. M., Medema, G., and van der Kooij, D.: Risk assessment and risk management of faecal contamination in drinking water distributed without a disinfectant residual, J. Water Supply Res. T., 55(1), 25–31, 2006.
dis-14 P. W. M. H. Smeets et al.: The Dutch secret
tributie KIWA Water Research, Nieuwegein, 161 pp., the Nether-lands, 2002.
Veenendaal, H. and van der Kooij, D.: Een specifieke kweekmeth-ode voor Legionella pneumophila, 36–38, 2007.
VEWIN: Water Supply Statistics 2004, VEWIN, Association of Dutch Water Companies, Rijswijk, The Netherlands, 2005. VEWIN: Groot vertrouwen in Nederlands kraanwater, http://www.
kraanwater.nu, last access: 22 May 2008.
Vreeburg, J.: Discolouration in drinking water systems: a particu-lar approach, Delft University of Technology, Delft, The Nether-lands, 2007.
Westrell, T., Bergstedt, O., Stenstrom, T. A., and Ashbolt, N. J.: A theoretical approach to assess microbial risks due to failures in drinking water systems, Int J. Environ. Health Res., 13(2), 181– 197, 2003.
WHO: Guidelines for Drinking Water Quality, third edition World health organization, Geneva, Switzerland, 2004.
Wullings, B. A. and van der Kooij, D.: Occurrence and genetic di-versity of uncultured Legionella spp. in drinking water treated at temperatures below 15 degrees C., Appl. Environ. Microbiol., 72(1), 157–166, 2006.