www.atmos-meas-tech.net/7/2137/2014/ doi:10.5194/amt-7-2137-2014
© Author(s) 2014. CC Attribution 3.0 License.
Validation of spectral sky radiance derived from all-sky camera
images – a case study
K. Tohsing, M. Schrempf, S. Riechelmann, and G. Seckmeyer
Institut für Meteorologie und Klimatologie, Leibniz Universität Hannover, Herrenhäuser Straße 2, Hanover 30419, Germany Correspondence to: K. Tohsing ([email protected])
Received: 30 September 2013 – Published in Atmos. Meas. Tech. Discuss.: 10 January 2014 Revised: 5 May 2014 – Accepted: 23 May 2014 – Published: 16 July 2014
Abstract. Spectral sky radiance (380–760 nm) is derived from measurements with a hemispherical sky imager (HSI) system. The HSI consists of a commercial compact CCD (charge coupled device) camera equipped with a fish-eye lens and provides hemispherical sky images in three refer-ence bands such as red, green and blue. To obtain the spec-tral sky radiance from these images, non-linear regression functions for various sky conditions have been derived. The camera-based spectral sky radiance was validated using spec-tral sky radiance measured with a CCD spectroradiometer. The spectral sky radiance for complete distribution over the hemisphere between both instruments deviates by less than 20 % at 500 nm for all sky conditions and for zenith angles less than 80◦. The reconstructed spectra of the wavelengths
380–760 nm between both instruments at various directions deviate by less than 20 % for all sky conditions.
1 Introduction
The knowledge of spatial and spectral sky radiance distribu-tion is important for many applicadistribu-tions. For example, the sky radiance is used for studying the optical properties of min-eral dust (Li et al., 2007) and bidirectional reflectance distri-butions (Deering and Eck, 1987). The optical thickness and the size distribution of aerosol were derived from the mea-sured sky radiance using an inversion algorithm (Nakajima et al., 1996; Dubovik and King, 2000). The aerosol phase function and single scattering albedo can be determined from the sky radiance as well (Velmeulen et al., 2000). The spec-tral sky radiance is also used for the computation of the ir-radiance on surfaces, which is applied in design and per-formance investigations of spectral selective energy devices,
such as photovoltaic (PV) systems (Steven and Unsworth, 1997; Hernández-András et al., 2001).
The variation of the sky radiance has been observed and analysed under different sky conditions by using several types of instruments (Dorno, 1911; Bener, 1963; Blumthaler et al., 1996; Ricchiazzi et al., 2000; Huber et al., 2004). Wuttke and Seckmeyer (2006) and Wuttke et al. (2006) per-formed spectral sky radiance measurements over the snow-covered surface in Antarctic environments in order to inves-tigate the impact of high snow albedo on the sky radiance. A recent study by Pissulla et al. (2009) presented an inter-comparison of spectral radiance measurements in the UV and visible wavelengths with high spectral resolution. These measurements were conducted by using five different instru-ments from three locations. The deviation of the measured spectral sky radiance varied between 3 and 35 % depending on the wavelength, location and the instruments.
Most of these spectral radiance observations have been compared with the results from a radiative transfer model. These comparisons were mostly under cloud-free conditions and under partly cloudy conditions. However, the equipment for measuring spectral radiance distributions is relatively non-mobile and expensive, which leads to insufficient spec-tral radiance data. Therefore, some researchers have applied all-sky images to determine the spectral sky radiance, which has great benefits in terms of acquisition time, mobility and cost.
distribution from the same system was also compared with sky radiance simulations (Zibordi and Voss, 1989).
The whole-sky imager was developed for ground-based cloud and radiance measurements (Shields et al., 1998; Feister et al., 2000). The grey level of a monochromatic CCD (charge coupled device) camera has been used to derive the sky radiance distribution for the different sky conditions (Huo and Lu, 2009) and the gray values combined with the radiometric calibration have been applied to obtain the spec-tral radiance (Rossini and Krenzinger, 2007). The specspec-tral skylight from images using a linear pseudo-inverse has been presented (López-Álvarez et al., 2008). Recent research by Román et al. (2012) investigated the spectral sky radiance at three effective wavelengths from hemispherical sky images. A matrix calibration described the relationship between the output signal of images and reference values of the simulated sky radiance were proposed. The camera-based radiance has been estimated and validated with the sun photometer. How-ever, validation of the spectral sky radiance distribution for the whole hemisphere with an accurate instrument has not been performed. Furthermore, the matrix calibration applied in this work is only valid when the spectral response of the CCD sensor is linear.
In contrast to Román et al. (2012), we propose a method to obtain the spectral sky radiance distribution from all-sky images for the complete spectrum in the visible part (380– 760 nm) using the non-linear regression technique. The in-strumentation and the methods for retrieving the spectral ra-diance will be introduced in the next section, followed by spectral and spatial comparison of the sky radiance distribu-tions derived by the hemispherical sky imager (HSI) system with the measured radiance distributions obtained by a CCD spectroradiometer.
2 Instruments and data
2.1 The hemispherical sky imager (HSI) system
The hemispherical sky imager (HSI) was designed and developed at the Institute of Meteorology and Climatol-ogy (IMuK), University of Hanover, Germany (52.39◦N, 9.70◦E, at 59 m a.s.l.). This system contains a Canon Power-Shot G10 compact camera, equipped with a Dörr DHG fish-eye lens, providing an image with a field of view (FOV) of about 183◦and encapsulated in a weather-proof housing for
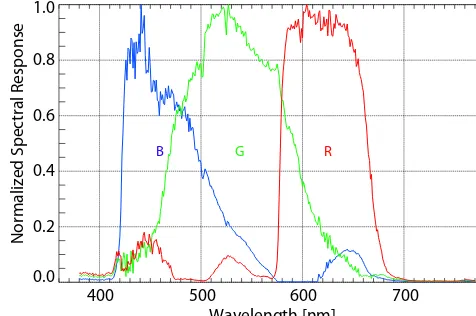
long-term outside operation. Hemispherical pictures can be taken and stored by the software every second. To keep the amount of storage low, an interval of 20 s is useful. More de-tailed descriptions of the HSI system are given in Tohsing et al. (2013). The camera has a CCD sensor with three chan-nels such as red, green and blue. The spectral response of the camera channels has been investigated at IMuK laboratory by using a light source from the 1000 W lamp passed through a monochromator projected onto a reflectance plaque. At
400 500 600 700
Wavelength [nm] 0.0
0.2 0.4 0.6 0.8 1.0
Normalized Spectral Response
R G
B
Figure 1. The relative spectral response of the Canon PowerShot G10 CCD sensor for the red, green and blue channel, investigated at the IMuK laboratory.
each wavelength images of the plaque were acquired and further analysed to obtain the sensor sensitivity. The result-ing spectral response of the camera sensor used is shown in Fig. 1. The maximum responses of each channel are at the wavelengths of 602, 527 and 441 nm for the red, green and blue channel respectively.
2.2 The CCD Array spectroradiometer
Table 1. Measuring description of the CCD spectroradiometer and the HSI system for spectral sky radiance reproduction.
Hour measuring
Date (UTC) Sky conditions Purpose
19 Oct 2012 05:30–17:27 Partly cloudy Validation
20 Oct 2012 05:30–16:44 Partly cloudy Validation
21 Oct 2012 10:23–17:21 Cloud-free Validation
22 Oct 2012 07:17–15:23 Overcast Validation
23 Oct 2012 06:30–16:21 Overcast Training
26 Oct 2012 05:30–17:20 Partly cloudy Validation
28 Oct 2012 12:41–16:00 Cloud-free Training
31 Oct 2012 12:25–16:31 Partly cloudy Validation
2.3 Data
Spectral sky radiance data were obtained by mounting the CCD spectroradiometer onto the Skyscanner platform, there-fore allowing a variety of zenith and azimuth angles to be viewed, and comparing these results with the concurrent im-ages from the HSI system. These data are categorized into two types, the first one to establish a training sample and the second data set to be used for the validation. Table 1 shows when the measurements and images are taken as well as the corresponding sky conditions.
The measurement of a radiance distribution for the whole hemisphere conducted with the CCD spectroradiometer has a scan pattern of 113 points and takes about 12 min. Since HSI images are taken every 20 s, a total of 35 images is within a complete scanning measurement of the CCD spec-troradiometer. In order to use the radiance distribution of the CCD spectroradiometer for the validation, a synchronized HSI image is constructed. For this synchronized HSI image the pixels of each scan point were taken from the correspond-ing all-sky image, dependcorrespond-ing on the time of measurement by the CCD spectroradiometer. The corresponding sky patterns constructed from the HSI system under different sky condi-tions can be seen in Figs. 4d, 5d and 6d.
3 Methods
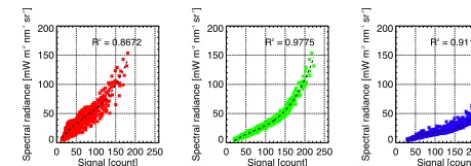
Sky radiance spectra from a limited number of discrete bands are derived from all-sky images. Due to the non-linear be-haviour of the camera sensor (see Fig. 2) a non-linear re-gression approach has been applied to obtain all of the spec-tra in the visible region. This regression method has been applied in various spectral reconstruction applications as de-scribed in Johnsen et al. (2008), Milton and Rollin (2006) and Dahlback (1996). Non-linear regression is used to determine a relationship between two data sets – namely, the measured spectral radiance from the CCD spectroradiometer and the signal from the three channels of the HSI image. In the re-gression process, the optimum correlation was acquired with
0 50 100 150 200 250 Signal [count] 0
50 100 150 200
Spectral radiance [mW m
-2 nm -1 sr -1]
R2 = 0.8672
0 50 100 150 200 250 Signal [count] 0
50 100 150 200
Spectral radiance [mW m
-2 nm -1 sr -1]
R2 = 0.9775
0 50 100 150 200 250 Signal [count] 0
50 100 150 200
Spectral radiance [mW m
-2 nm -1 sr -1]
R2 = 0.9114
Figure 2. Non-linear relationship between the measured spectral sky radiance and the signal count for the three channels red, green and blue of the HSI system. The data are used as a training data set and were recorded on 28 October 2012 for the wavelength 500 nm.
TheR2in the plots represent the correlation coefficients.
a variety of independent variables and the predictor variables were selected (Lütjohann, 1970).
The following two data sets were used in the training of the regression model for cloud-free condition. The first data set contains spectral sky radiance measurements, con-ducted with the CCD spectroradiometer in the wavelength range from 380 to 760 nm on 28 October 2012 from 12:00 to 16:00 UTC. The second data set consists of the signal counts of the three reference bands measured by the HSI system also on 28 October 2012, which have a maximum spectral response at the wavelength of 441 nm for the blue channel, 527 nm for the green channel and 602 nm for the red chan-nel. In this case, the spectral direct radiance from the CCD spectroradiometer as well as the counts from the HSI sys-tem at the circumsolar area or about 20◦around the sun were excluded in the regression model.
At each wavelength (i.e. each regression equation), the measured spectral sky radiance was treated as a function of the signal of red or green or blue counts, which range from 0 to 255 counts. Therefore, there are three non-linear regres-sion equations for each wavelength and 1143 regresregres-sions for the complete spectrum. For different camera settings such as exposure time or aperture and due to the non-linear relation-ship between those settings and the count values different regression equations must be computed. In this work, the re-gression was performed for an exposure time of 1/1000 s, an ISO number (defined as sensitivity of a camera to incoming light) of 80 and an aperture off/40. The results of the non-linear regression equations and the selection of those equa-tions for each wavelength is presented in Sect. 4.1.
both conditions would lead to great deviation in the spectral radiance reconstruction.
Under intermediate sky, the FOV of some scanning points is not completely filled with either clouds or blue sky, as shown in Fig. 6d. In these cases, it is quite difficult to de-cide whether the cloud-free or cloudy sky regression model is more suitable. Therefore, the ratio of the count values of the red and blue channel (called sky index) was investigated to separate blue sky and white clouds (Yamashita et al., 2004). The sky index is expressed as
Sky Index=B−R
B+R, (1)
where B is the count value of the blue channel and R the count value of the red channel of the HSI system.
Eventually, all pixels of each scanning point were aver-aged to gain one representative sky index. The investigations showed that an average of sky index greater than 0.25 indi-cates blue sky. Thus, for these values, the cloud-free regres-sion model will be applied for the spectral reconstruction, otherwise the sky element is covered by clouds.
A major challenge of this regression technique is that the collinearity between the predictor variables, which creates the regression relationship, is very specific to the training data set from which they are derived. Therefore, it would be unsuccessful to apply the same coefficients to other data set without a test of their suitability. Moreover, the training data set contains solar zenith angles 60–90◦due to the fact that
the measurements have been performed in wintertime. For the validation of the spectra reproduction method, the spec-tral radiance was calculated for an independent image data set from the HSI system during one week of the campaign acquired under different sky conditions as shown in Table 1. A discrepancy between the spectral sky radiance from the HSI system and the CCD spectroradiometer is presented as a ratio and also in terms of mean bias difference (MBD) and root mean square difference (RMSD). MBD is determined (Iqbal, 1983) by
MBD=
N
P
i=1
(Rcam−Rmea)
N Rmea
×100 %, (2)
whereRcamis the sky radiance derived from the HSI system,
Rmeais the measured sky radiance from the CCD
spectrora-diometer, Rmea is the averaged sky radiance obtained from
the CCD spectroradiometer and N is the number of mea-surement data. The RMSD measures the variation between the computed values and the measured values. RMSD is ex-pressed as follows (Iqbal, 1983):
RMSD=
s
N
P
i=1
(Rcam−Rmea)2
N
Rmea
×100 % (3)
400 500 600 700 800
Wavelength [nm] 0.6
0.7 0.8 0.9 1.0
Correlation coefficient BlueGreenRed
Blue
Green
Red
400 500 600 700 800
Wavelength [nm] 0.80
0.85 0.90 0.95 1.00
Correlation coefficient
Red Green
Blue Red
Green
Blue
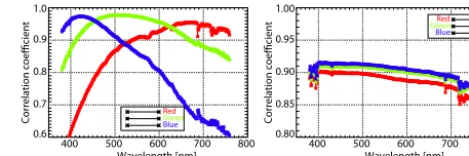
Figure 3. The optimum correlation coefficient (R2) derived from the comparison with the CCD spectroradiometer and the digital numbers of the three channels of the images from the HSI system for cloudless sky measured on 28 October 2012 (left) and on 23 Oc-tober 2012 for cloudy sky (right).
The results of the comparison between camera-based and measured spectral sky radiance are presented in Sects. 4.2 and 4.3.
4 Results
4.1 Non-linear regression model
The synchronized data sets collected on 23 and 28 Octo-ber 2012 by the CCD spectroradiometer and the HSI system were used as training data sets to determine the non-linear regression equations. Figure 2 shows the non-linear regres-sion fitted by a third-degree polynomial and the correlation coefficient (R2) at the wavelength 500 nm for the three chan-nels. The resulting plot in Fig. 3 presents the variation of the correlation coefficients of the training data for cloud-free sky on 28 October 2012 (left) and for cloudy sky on 23 Octo-ber 2012 (right) plotted against the visible wavelength. For blue sky, the best correlation coefficients are at the centre of each band, which has a correlation coefficient ofR2>0.95 and the correlation coefficients of each channel vary with the wavelength that corresponds to the camera sensor response. The coefficients for cloud-free data of the red channel vary mostly in the region around 680–760 nm due to water absorp-tion lines (Liou, 2002). In the case of cloudiness (see Fig. 3 right), there are variations of the correlation coefficients at wavelength less than 400 nm due to the absorption by ozone and in the 680–760 nm wavelength range, otherwise the cor-relation coefficients are quite constant ranging from about 0.85 to 0.92.
Therefore, the general equations of the non-linear regres-sion models for each wavelength (λ) can be expressed by the following equations:
Lcam, r=a0,λ+a1,λR+a2,λR2+a3,λR3 (4) Lcam, g=b0,λ+b1,λG+b2,λG2+b3,λG3 (5) Lcam, b=a0,λ+c1,λB+c2,λB2+c3,λB3 (6)
whereLcam, r,Lcam, g,Lcam, bare the sky radiance values
R,GandBare the signal counts from the red, green and blue channel.a,bandcare the wavelength dependent coefficients of the regression equations.
The regression model for each wavelength has been se-lected by comparing the best correlation coefficients of the three channels. As presented in Fig. 3 (left), the blue chan-nel yields the best correlation coefficients in the 380 nm to 450 nm wavelength range due to the sensitivity of this chan-nel (see Fig. 1). The non-linear regression model from Eq. (6) has been applied to predict the spectral sky radiance in this region. The non-linear regression model from Eq. (5) domi-nated by the green channel is used to obtain the spectral sky radiance in the 451 to 620 nm wavelength range. Spectral sky radiance in the last part of the spectrum from 621 to 760 nm has been calculated by using the non-linear regression from the red channel as expressed in Eq. (4). Finally, the spectral sky radiance using the above three regression relationships may be estimated for the entire visible spectrum. The result of the application of these regression models to the indepen-dent validation data set of the synchronized HSI images is presented in Sects. 4.2 and 4.3.
4.2 Comparison of spectral radiance distribution at 500 nm from CCD spectroradiometer and
HSI system
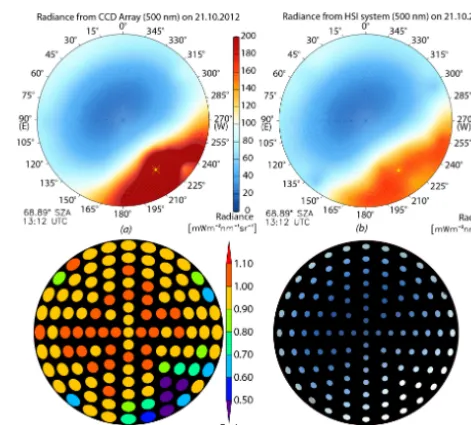
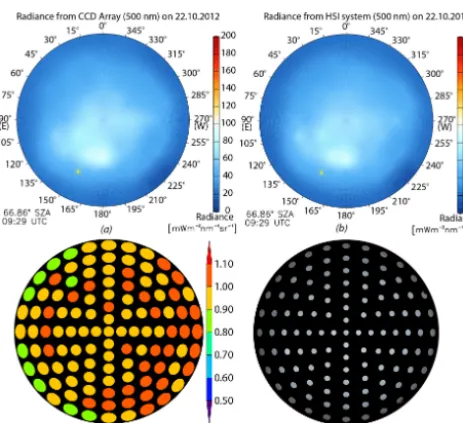
Examples of the spectral sky radiance at 500 nm for the whole hemisphere measured with the CCD spectroradiome-ter are compared with the spectral radiance from the HSI images for different sky conditions as shown in Figs. 4–6. Figure 4 shows the measurement and the comparison for cloud-free sky on 21 October 2012 at 13:12 UTC (scanning period is 13:12–13:24 UTC): (a) the measured spectral sky radiance from CCD spectroradiometer and interpolated for the whole sky (b) the spectral radiance distribution calcu-lated from the HSI system, (c) the ratio between the camera-based and measured spectral sky radiation compared point by point (no interpolation) and (d) 113 points of the syn-chronized HSI image reconstructed from about 35 images depending on the scanning time. The size of the illustrated scan points in Fig. 4d corresponds to the 5◦FOV of the CCD spectroradiometer. Although the FOV of the scanning pattern is 5◦(Fig. 4d), the scanning points showing the ratio (Fig. 4c) are plotted with a FOV of 10◦for clarity of the presentation. A yellow star represents the position of the sun with its cor-responding solar zenith angle (SZA). Due to the obstacles of buildings and trees, the spectral radiance for zenith an-gles higher than 80◦is not considered. Measurements in the circumsolar region are not included in the regression model, since both instruments suffer from oversaturation due to their limited dynamic range. Internal reflections of direct sunlight can cause ghost images in some parts of the HSI image and lead to an overestimation of the spectral sky radiance of about 2–5 % (Tohsing et al., 2013).
Figure 4. Spectral radiance distribution at 500 nm measured by (a) CCD spectroradiometer and (b) HSI system on 21 October 2012
at 13:12 UCT (68.89◦of solar zenith angle (SZA)) for cloud-free
condition. (c) Ratio between the computed spectral radiance of the HSI system and the measured spectral radiance of the CCD spec-troradiometer (HSI system/CCD specspec-troradiometer). Although the
FOV of the scanning pattern is 5◦(see d), the scanning points
show-ing the ratio are plotted with a FOV of 10◦for clarity of the
presen-tation. The synchronized HSI image showing the 5◦FOV pattern of
the scanning points from the CCD spectroradiometer is illustrated in (d).
A rim at the horizon with higher values of spectral sky radiance can be observed, in contrast to the spectral sky radi-ance at the zenith. For the spectral sky radiradi-ance distribution, in general, the brightness of the horizon which is dominated by the Rayleigh scattering (Liou, 2002) increases with in-creasing wavelength and can clearly be observed in the mea-surements with the CCD spectroradiometer. From the results of the spectral sky radiance derived from the HSI system, the horizon brightening could not be identified at short wave-lengths (400 nm) but could be distinctly observed at longer wavelengths (600 nm), which is not shown in the plots. The variation of the spectral sky radiance distribution at the wave-length 500 nm deviates by up to 10 % for the whole hemi-sphere excluding the circumsolar region as shown in the ratio plot of Fig. 4c.
Figure 5. Spectral radiance measured at the wavelength 500 nm by the CCD spectroradiometer (a) and HSI system (b) on 22
Octo-ber 2012 at 09:29 UCT (66.86◦of SZA) under overcast sky. (c)
Ra-tio between the computed spectral radiance from the HSI system and the measured spectral radiance by the CCD spectroradiome-ter (HSI system/CCD spectroradiomespectroradiome-ter). Although the FOV of the
scanning pattern used is 5◦(see d), the scanning points showing the
ratio are plotted with a FOV of 10◦for clarity. The synchronized
HSI image showing the 5◦FOV pattern of the scanning points from
the CCD spectroradiometer is illustrated in (d).
The validation for partly cloudy sky, measured on 26 Octo-ber 2012 at 12:01 UTC (scanning period, 12:01–12:13 UTC), is presented in Fig. 6. Most of the sky elements with a zenith angle greater than 50◦ were covered by clouds, while the
zenithal area was cloudless. The sky index was determined and applied for separating blue sky and cloudy areas.
The comparison shows that the spectral radiance distribu-tion of the blue sky at the zenith derived by the HSI sys-tem agrees well with the measurement with a deviation up to 10 %. The same deviation is observed at scanning points that are fully covered by clouds. If scanning points are covered by a small degree by clouds, the HSI system overestimates the spectral sky radiance. In this case the deviation is less than 20 %. However, the spectral sky radiance of bright clouds is overestimated by the HSI system.
The values of the MBD and RMSD of the compared sky radiance measurements for the wavelengths of 400, 500 and 600 nm during the measurement campaign under different sky conditions are summarized in Table 2. The HSI system tends to underestimate the spectral sky radiance with respect to the CCD spectroradiometer as presented by the MBD. The MBD and the RMSD of the spectral sky radiance in the case of partly cloudy sky between both instruments were found to be higher than for completely cloud-free and overcast skies.
Figure 6. Spectral radiance measured at the wavelength 500 nm by the CCD spectroradiometer (a) and HSI system (b) on 26 October
2012 at 12:01 UCT (66.12◦of SZA) under intermediate sky. Plot
(c) shows the ratio between the computed spectral radiance from the HSI system and the measured spectral radiance by the CCD spec-troradiometer (HSI system/CCD specspec-troradiometer). Although the
FOV of the scanning pattern used is 5◦(see d), the scanning points
showing the ratio are plotted with a FOV of 10◦to achieve a
bet-ter illustration. The synchronized HSI image showing the 5◦FOV
pattern of the scanning points from the CCD spectroradiometer is illustrated in (d).
4.3 Comparison of spectral radiance from CCD spectroradiometer and HSI system for the visible spectrum
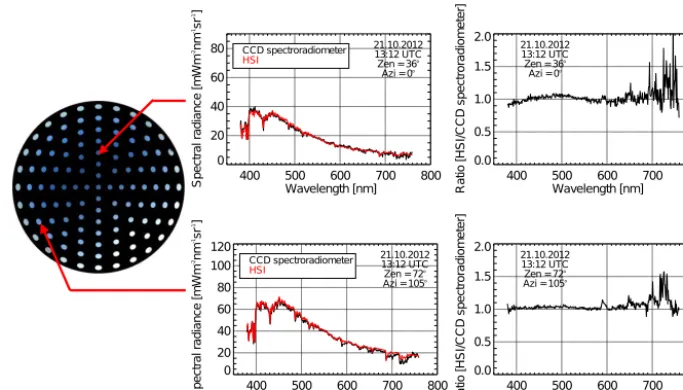
The spectral sky radiance obtained for the whole visible spectrum of the wavelength from 380 to 760 nm by the HSI system was compared with the measurements of the three different sky conditions mentioned in Sect. 4.2. For each sky condition, two points of the scan pattern were chosen to rep-resent the spectral validation.
In Fig. 7 the reconstructed spectra from 21 October 2012 at 13:12 UTC for the scanning points with zenith angles of 36◦ and 72◦ and azimuth angles of 0◦and 105◦ are illustrated. The validation shows that the camebased spectral sky ra-diance agrees well with the spectral rara-diance from the CCD spectroradiometer and has a deviation of less than 10 % in the 380 to 700 nm wavelength range as shown in the ratio plots of Fig. 7. For wavelengths greater than 700 nm the deviation can be up to 30 % and could be caused by the absorption band of the water vapour (Liou, 2002) and the detection threshold of the CCD spectroradiometer in this wavelength region.
400 500 600 700 800 Wavelength [nm] 0 20 40 60 80 S p e c tr a l ra d ia n c e [m W m -2n m -1s r -1] 21.10.2012 13:12 UTC Zen =36o Azi =0o CCD spectroradiometer
HSI
CCD spectroradiometer
HSI
400 500 600 700 800 Wavelength [nm] 0.0 0.5 1.0 1.5 2.0 R a ti o [H S I/ C C D s p e c tr o ra d io m e te r] 21.10.2012 13:12 UTC Zen =36o Azi =0o
400 500 600 700 800 Wavelength [nm] 0 20 40 60 80 100 120 S p e c tr a l ra d ia n c e [m W m -2n m -1s r -1] 21.10.2012 13:12 UTC Zen =72o Azi =105o CCD spectroradiometer
HSI
CCD spectroradiometer
HSI
400 500 600 700 800 Wavelength [nm] 0.0 0.5 1.0 1.5 2.0 R a ti o [H S I/ C C D s p e c tr o ra d io m e te r] 21.10.2012 13:12 UTC Zen =72o Azi =105o
Fig.7
Figure 7. Spectral radiance measured on 21 October 2012 at 13:12 UTC by the CCD spectroradiometer and the HSI system for the scanning
points with azimuth and zenith angles of 0◦and 36◦(upper panel) and 105◦and 72◦(lower panel). The ratio between the measured and
computed spectral radiance is shown on the right.
400 500 600 700 800 Wavelength [nm] 0 20 40 60 80 100 S p e c tr a l ra d ia n c e [m W m -2n m -1s r -1] 22.10.2012 09:29 UTC Zen =0o Azi =0o CCD spectroradiometer
HSI
CCD spectroradiometer
HSI
400 500 600 700 800 Wavelength [nm] 0.0 0.5 1.0 1.5 2.0 R a ti o [H S I/ C C D s p e c tr o ra d io m e te r] 22.10.2012 09:29 UTC Zen =0o Azi =0o
400 500 600 700 800 Wavelength [nm] 0 20 40 60 80 100 S p e c tr a l ra d ia n c e [m W m -2n m -1s r -1] 22.10.2012 09:29 UTC Zen =48o Azi =202o CCD spectroradiometer
HSI
CCD spectroradiometer
HSI
400 500 600 700 800 Wavelength [nm] 0.0 0.5 1.0 1.5 2.0 R a ti o [H S I/ C C D s p e c tr o ra d io m e te r] 22.10.2012 09:29 UTC Zen =48o Azi =202o
Fig.8
Figure 8. Spectral radiance on 22 October 2012 at 09:29 UTC measured by the CCD spectroradiometer and the HSI system at the zenith
(upper panel) and for azimuth angle of 202◦, zenith angle of 48◦(lower panel). The ratio between the measured and computed spectral
radiance is shown on the right.
azimuth angle of 202◦. The spectral radiance from the HSI image agrees very well with the measured spectral zenith ra-diance from the CCD spectroradiometer with a deviation of less than 10 % in the visible spectrum.
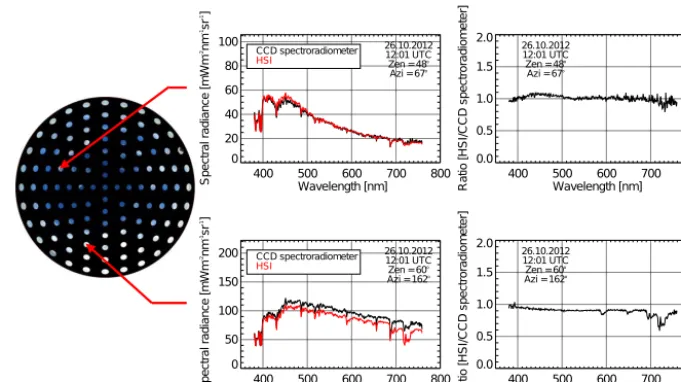
As shown in Fig. 9, the radiance spectra were also de-termined by the HSI system for a broken cloud condition observed on 26 October 2012 at 12:01 UTC. The scanning point with the zenith angle of 48◦ and the azimuth angle of 67◦, shown in the upper panel, is covered up to one half with clouds. The sky index was found to be close to 0.22. Therefore, the regression model for cloudy conditions was
selected. The resulting value from the HSI system is slightly higher than from the CCD spectroradiometer but the devia-tion is still within 10 %. In the lower panel, the plot of the scanning point with the zenith angle of 60◦and the azimuth
angle of 162◦, which was fully covered by cumulus clouds,
400 500 600 700 800 Wavelength [nm] 0
20 40 60 80 100
S
p
e
c
tr
a
l
ra
d
ia
n
c
e
[m
W
m
-2n
m
-1s
r
-1]
26.10.2012 12:01 UTC Zen =48o
Azi =67o
CCD spectroradiometer
HSI
CCD spectroradiometer
HSI
400 500 600 700 800 Wavelength [nm] 0.0
0.5 1.0 1.5 2.0
R
a
ti
o
[H
S
I/
C
C
D
s
p
e
c
tr
o
ra
d
io
m
e
te
r]
26.10.2012 12:01 UTC Zen =48o Azi =67o
400 500 600 700 800 Wavelength [nm] 0
50 100 150 200
S
pec
tr
al
ra
di
an
ce
[m
W
m
-2nm -1sr -1]
26.10.2012 12:01 UTC Zen =60o
Azi =162o
CCD spectroradiometer
HSI
CCD spectroradiometer
HSI
400 500 600 700 800
Wavelength [nm] 0.0
0.5 1.0 1.5 2.0
R
at
io
[H
S
I/C
C
D
sp
ec
tr
or
ad
iom
et
er
]
26.10.2012 12:01 UTC Zen =60o Azi =162o
Fig.9
Figure 9. Spectral radiance measured on 26 October 2012 at 12:01 UTC by the CCD spectroradiometer and the HSI system for the scanning
points with the azimuth and zenith angle of 67◦and 48◦(upper panel) and for the azimuth and zenith angle of 162◦and 60◦(lower panel).
The ratio between the measured and computed spectral radiance is shown on the right. The agreement is considered to be satisfactory.
Table 2. The MBD and RMSD of the spectral sky radiance measured by the HSI system and the CCD spectroradiometer on various days corresponding to the sky conditions shown in Table 1.
MBD (%) RMSD (%)
Date 400 nm 500 nm 600 nm 400 nm 500 nm 600 nm
19 Oct 2012 −14.09 −11.51 −13.36 19.13 16.11 17.12
20 Oct 2012 −17.76 −15.22 −18.60 18.57 15.47 17.53
21 Oct 2012 −2.90 −2.13 −3.22 10.46 6.20 12.14
22 Oct 2012 −3.09 −2.12 −2.46 7.53 5.81 9.36
26 Oct 2012 −12.12 −6.72 −9.36 13.41 14.34 15.71
31 Oct 2012 −10.41 −7.40 −10.08 13.56 9.56 13.19
the HSI system and the measured spectral radiance from the spectroradiometer for all directions and zenith angles (entire hemisphere excepting the sun position) was up to 20 % for wavelengths less than 700 nm. Sample results can be found in Sect. 4.2 for the wavelength of 500 nm. For wavelengths greater than 700 nm, the deviation can be up to 40 % when some parts of scanning point were covered by clouds. Due to Mie scattering, the maximum radiance during cloudy sit-uations is shifted from 400 nm for a cloud-free sky (Fig. 7, left upper panel) to 450 nm (Fig. 8, left upper panel) as de-scribed in Lenoble (1993). The shift of the radiance maxi-mum to longer wavelengths was observed and investigated at different locations (Pissulla et al., 2009; Seckmeyer et al., 1994; Wuttke and Seckmeyer, 2006).
5 Conclusions
A non-linear regression model derived from the relationship between measurements and signal counts of the red, green
and blue channels of hemispherical sky images was devel-oped to derive the spectral sky radiance in the visible spec-trum. The optimum non-linear regression equation for each wavelength was selected by using a training data set and the correlation coefficients between predicted radiance of the training set and the radiance from the measurements. For the validation, the camera-based spectral sky radiance from RGB image data obtained from the regression equations for different days under various sky conditions was calculated and compared with spectral sky radiance measurements by a CCD spectroradiometer.
concluded that the HSI system can derive the spectral sky ra-diance distribution from hemispherical sky images with rea-sonable accuracy and reliability.
Acknowledgements. We acknowledge support by Deutsche
Forschungsgemeinschaft and the Open Access Publishing Fund of Leibniz Universität Hannover.
Edited by: A. Macke
References
Ansko, I., Eerme, K., Lätt, S., Noorma, M., and Veismann, U.: Study of suitability of AvaSpec array spectrometer for solar UV field measurements, Atmos. Chem. Phys., 8, 3247–3253, doi:10.5194/acp-8-3247-2008, 2008.
Bener, P.: Der Einfluß der Bewölkung auf die Himmelsstrahlung, Theor. Appl. Climatol., 12, 442–457, doi:10.1007/BF02242986, 1963.
Blumthaler, M., Grübner, J., Huber, M., and Ambach, W.: Measur-ing spectral and spatial variations of UVA and UVB sky radi-ance, J. Geophys. Res., 23, 547–550, 1996.
Cordero, R. R., Seckmeyer, G., Pissulla, D., and Labbe, F.: Uncer-tainty of experimental integrals: application to the UV index cal-culation, Metrologia, 45, 1–10, 2008.
Czibula, G. and Grundmann, O.: Skyscanner – Gerätebeschreibung, Czibula and Grundmann Engeneering GbR, Berlin, 2002. Dahlback, A.: Measurements of biologically effective UV doses,
to-tal ozone abundances, and cloud effects with multichannel, mod-erate bandwidth filter instruments, Appl. Optics, 35, 6514–6521, 1996.
Deering, D. W. and Eck, T. F.: Atmospheric optical depth effects on angular on anisotropy of plant canopy reflectant, Int. J. Remote Sens., 8, 893–916, 1987.
Dorno, C.: Studie über Licht und Luft des Hochgebirges, Vieweg und Sohn, Braunschweig, 1911.
Dubovik, O. and King, M. D.: A flexible inversion algorithm for re-trieval of aerosol optical properties from Sun and sky radiance measurements, J. Geophys. Res.-Atmos., 105, 20673–20696, 2000.
Feister, U., Shields, J., Karr, M., Johnson, R., Dehne, K., and Woldt, M.: Ground-based cloud images and sky radiance in the visible and near infrared region from whole sky image measure-ment, in: EUMETSAT Satellite Application Facility Workshop, German Weather Service and World Meteorological Organiza-tion, 79–88, 2000.
Hernández-András, J., Romero, J., and Lee, J. R. L.: Colorimetric and spectro-radiometric characteristics of narrow-field-of-view clear skylight in Granada, Spain, J. Opt. Soc. Am., 18, 412–420, 2001.
Huber, M., Blumthaler, M., Schreder, J., Schallhart, B., and Leno-ble, J.: Effect of inhomogeneous surface albedo on diffuse UV sky radiance at a high-altitude site, J. Geophys. Res., 109, 1–9, 2004.
Huo, J. and Lu, D.: Calibration and validation of an All–Sky Imager, Atmos. Ocean. Sc. Lett., 2, 220–223, 2009.
Iqbal, M.: An Introduction to Solar Radiation, Academic Press, Canada, 1983.
Johnsen, B., Kjeldstad, B., Aalerud, T. N., Nielsen, L. T., Schreder, J., Blumthaler, M., Bernhard, G., Topaloglou, C., Meinander, O., Bagheri, A., Slusser, J. R., and Davis, J.: Inter-comparison and haromonization of UV index measurments from multiband filter radiometers, J. Geophys. Res., 113, 1–9, 2008. Kouremeti, N., Bais, A., Kazadzis, S., Blumthaler, M., and
Schmitt, R.: Charge-coupled device spectrograph for direct so-lar irradiance and sky radiance measurements, Appl. Optics, 47, 1594–1607, 2008.
Kreuter, A. and Blumthaler, M.: Stray light correction for solar measurements using array spectrometers, Rev. Sci. Instrum., 80, 096108, doi:10.1063/1.3233897, 2009.
Lenoble, J.: Atmospheric Radiative Transfer, Deepak Publishing, Hampton, 1993.
Li, Z., Goloub, P., Blarel, L., Damiri, B., Podvin, T., and Jankowiak, I.: Dust optical properties retrieved from ground-based polarimetric measurements, Appl. Optics, 46, 1548–1553, 2007.
Liou, K. N.: An Introduction to Atmospheric Radiation, Academic Press, Orlando, 2002.
López-Álvarez, M. A., Hernández-Andrés, J., Romero, J., Olmo, F. J., Cazorla, A., and Alados-Arboledas, L.: Using a trichromatic CCD camera for spectral skylight estimation, Appl. Optics, 47, H31–H38, 2008.
Lütjohann, H.: The stepwise regression algorithm seen from the statistician’s point of view, Metrika, 15, 110–125, 1970. Milton, E. J. and Rollin, E. M.: Estimating the irradiance spectrum
from measurements in a limited number of spectral bands, Re-mote Sens. Environ., 100, 348–355, 2006.
Nakajima, T., Tonna, G., Rao, R., Boi, P., Kaufman, Y., and Hol-ben, B.: Use of sky brightness measurements from ground for remote sensing of particulate dispersion, Appl. Optics, 35, 2672– 2686, 1996.
Pissulla, D., Seckmeyer, G., Cordero, R. R., Blumthaler, M., Schall-hart, Webb, A., Kift, R., Smedley, A., Bais, A. F., Kouremeti, N., Ced, A., Hermang, J., and Kowalewskig, M.: Comparison of at-mospheric spectral radiance measurements from five indepen-dently calibrated systems, Photochem. Photobiol. S., 8, 516–527, 2009.
Ricchiazzi, P. J., Payton, A., and Gautier, C.: The Effect of Sur-face Albedo Heterogeneity on Sky Radiance, Tenth ARM Sci-ence Team Meeting Proceedings, San Antonio, Texas, 1–9, 2000. Román, R., Antón, M., Cazorla, A., de Miguel, A., Olmo, F. J., Bilbao, J., and Alados-Arboledas, L.: Calibration of an all-sky camera for obtaining sky radiance at three wavelengths, At-mos. Meas. Tech., 5, 2013–2024, doi:10.5194/amt-5-2013-2012, 2012.
Rossini, E. G. and Krenzinger, A.: Maps of sky relative radiance and luminance distributions acquired with a monochromatic CCD camera, Sol. Energy, 81, 1323–1332, 2007.
Seckmeyer, G., Mayer, B., Erb, R., and Bernhard, G.: UV-B in Ger-many higher in 1993 than in 1992, Geophys. Res. Lett., 21, 577– 580, 1994.
Shields, J. E., Johnson, R. W., Karr, M. E., and Wertz, J. L.: Auto-mated day/night whole sky imagers for field assessment of cloud cover distributions and radiance distribution, in: Tenth Sympo-sium on Meteorological Observations and Instrument, American Meteorological Society, 1998.
Steven, M. D. and Unsworth, M. H.: Standard distribution of clear sky radiance, Q. J. Roy. Meteorol. Soc., 103, 457–465, 1997. Tohsing, K., Schrempf, M., Riechelmann, S., Schilke, H., and
Seck-meyer, G.: Measuring high-resolution sky luminance distribu-tions with a CCD camera, Appl. Optics, 52, 1564–1573, 2013. Velmeulen, A., Deveax, C., and Herman, M.: Retrieval of the
scat-tering and microphysical properties of aerosols from ground-based optical measurements including polarization. I. Method, Appl. Optics, 39, 6207–6220, 2000.
Voss, K. J. and Zibordi, G.: Radiometric and geometric calibration of a visible spectral electro-optic “fisheye” camera radiance dis-tribution system, J. Atmos. Ocean. Tech., 6, 652–662, 1989.
Wuttke, S. and Seckmeyer, G.: Spectral radiance and sky luminance in Antarctica: a case study, Theor. Appl. Climatol., 85, 131–148, 2006.
Wuttke, S., Bernhard, G., Ehramjian, J., McKenzie, R., Johnston, P., ÓNeil, M., and Seckmeyer, G.: New spectroradiometers comply-ing with NDSC standards, J. Atmos. Ocean. Tech., 23, 241–251, 2006.
Yamashita, M., Yoshimura, M., and Nakashizaka, T.: Cloud cover estimation using multitemporal hemispherical imageries, Int. Arch. Photogram. Rem. Sens. Spatial Inform. Sci., 35, 826–829, 2004.