www.solid-earth.net/7/1185/2016/ doi:10.5194/se-7-1185-2016
© Author(s) 2016. CC Attribution 3.0 License.
Digital carbonate rock physics
Erik H. Saenger1,2, Stephanie Vialle3, Maxim Lebedev3, David Uribe4,5, Maria Osorno4, Mandy Duda1, and Holger Steeb4,5
1International Geothermal Centre, 44801 Bochum, Germany
2Institute for Geology, Mineralogy and Geophysics, Ruhr-Universität Bochum, 44801 Bochum, Germany 3Department of Exploration Geophysics, Curtin University, Perth, Australia
4Institute for Mechanics, University of Stuttgart, 70569 Stuttgart, Germany
5Stuttgart Research Centre for Simulation Technology (SRC SimTech), 70569 Stuttgart, Germany Correspondence to:Erik H. Saenger ([email protected])
Received: 1 March 2016 – Published in Solid Earth Discuss.: 9 March 2016 Revised: 7 July 2016 – Accepted: 13 July 2016 – Published: 4 August 2016
Abstract. Modern estimation of rock properties combines imaging with advanced numerical simulations, an approach known as digital rock physics (DRP). In this paper we suggest a specific segmentation procedure of X-ray micro-computed tomography data with two different resolutions in the µm range for two sets of carbonate rock samples. These carbonates were already characterized in detail in a previous laboratory study which we complement with nanoindenta-tion experiments (for local elastic properties). In a first step a non-local mean filter is applied to the raw image data. We then apply different thresholds to identify pores and solid phases. Because of a non-neglectable amount of unresolved microporosity (micritic phase) we also define intermediate threshold values for distinct phases. Based on this segmen-tation we determine porosity-dependent values for effective P- andS-wave velocities as well as for the intrinsic perme-ability. For effective velocities we confirm an observed two-phase trend reported in another study using a different car-bonate data set. As an upscaling approach we use this two-phase trend as an effective medium approach to estimate the porosity-dependent elastic properties of the micritic phase for the low-resolution images. The porosity measured in the laboratory is then used to predict the effective rock properties from the observed trends for a comparison with experimen-tal data. The two-phase trend can be regarded as an upper bound for elastic properties; the use of the two-phase trend for low-resolution images led to a good estimate for a lower bound of effective elastic properties. Anisotropy is observed for some of the considered subvolumes, but seems to be in-significant for the analysed rocks at the DRP scale. Because
of the complexity of carbonates we suggest using DRP as a complementary tool for rock characterization in addition to classical experimental methods.
1 Introduction
Andrä et al., 2013b). For example, Darcy permeability can be predicted by numerically simulating single-phase fluid flow through 3-D rock pore structure models, with the numerical results being in reasonable agreement with laboratory mea-surements (e.g. Osorno et al., 2015; Saenger et al., 2016). In this case, the resolution of the micro-XRCT technique is suf-ficient, because fluid pathways predominantly follow larger pores. However, if the pore size is much smaller than 1 µm the agreement might be less satisfactory due to resolution limitations. On the other hand, mechanical properties, such as the effective elastic moduli, strongly depend on the mi-crostructural details of the rock, which may stay unresolved by the micro-XRCT technique (e.g. for Bentheim sandstone considered in Saenger et al., 2016). The inability to fully characterize the microstructural details of a rock sample can lead to a disagreement between numerical estimates of me-chanical properties based on micro-XRCT images and labo-ratory data (Andrä et al., 2013b).
An example of such a disagreement between laboratory and digital rock physics (DRP) estimates is described in An-drä et al. (2013a, b). In these benchmark papers a comparison between different numerical methods is presented. All DRP estimates of the effective elastic bulk modulus use the same segmented data set. Regardless of the numerical approach, all computational predictions overestimate the bulk modu-lus measured in the laboratory. This concmodu-lusion is mostly based on Berea sandstone although carbonates are consid-ered in this study. However, Jouini et al. (2015) also reports about an overestimation of effective elastic properties of car-bonates by DRP. Therefore we conclude here that the digital rock images themselves and/or the computational workflow have to be improved to provide better estimates of effective properties of rocks. In this paper we consider a carbonate data set in detail and suggest techniques to achieve a bet-ter agreement between numerical predictions and laboratory measurements. Our study is complementary to the DRP car-bonate studies performed in Derzhi et al. (2010), Lopez et al. (2012), Ringstad et al. (2013), Andrä et al. (2013a, b), and Jouini et al. (2015). In contrast to these studies our digi-tal rock physics study is complemented with a very detailed experimental characterization (Sect. 2). Our suggested seg-mentation technique (Sect. 3) is used to estimate effective mechanical and transport properties (Sect. 4). Among oth-ers, we observe a two-phase trend for monomineralic (cal-cite) carbonates which can be regarded as an upper bound for velocities at all scales (see discussion in Sect. 5) due to the observed self-similarity of those rocks (Jouini et al., 2015).
We studied samples of two carbonates from the Upper Cre-taceous carbonate system of the Gargano–Murge region (southern Italy). Carb-A is a limestone from the Paleocene– Eocene Peschici Formation, and Carb-B is a micritic mud-stone from the Late Cretaceous Monte Acuto Formation (Martinis and Pavan, 1967; Cremonini et al., 1971). Both car-bonates are composed of nearly 100 % calcite (Scotellaro et al., 2014).
Both samples have been characterized in the laboratory in detail in Vialle et al. (2013), e.g. SEM images showing the microstructure of these two samples. We only give a short summary here. Both carbonate samples display a matrix of micrite (abbreviation for microcrystalline calcite) with a typ-ical grain size of 1–4 µm (Moshier, 1989), but the texture of these micrites is different between the two samples. Fol-lowing the classification of micrite microtexture proposed by Lambert et al. (2006) and Deville de Periere et al. (2011), the micrite in sample Carb-A is mainly a “tight micrite”, spa-tially varying from anhedral compact to fused, with grains typically 1–2 µm in diameter; micrite in sample Carb-B is a “porous micrite”, varying from rounded to subrounded, with anhedral to subhedral, rounded grains, typically 2–4 µm in diameter. Besides a micrite matrix, sample Carb-A exhibits vuggy-like pores either rounded, up to about 60 µm, or more elongated, up to 300 µm in length. Sample Carb-B exhibits a calcite spar cement of grains typically tens to hundreds of micrometres in diameter, as well as rounded vugs up to about 100–200 µm.
He-grain density, bulk density, and resulting porosity, as well as air permeability, were previously measured at room pressure and temperature on core plugs 0.025 m in length and diameter (Vialle et al., 2013). The associated errors did not exceed 0.5, 1, and 2 %, respectively.P- andS-wave veloci-ties, at 1 and 0.7 MHz frequency, respectively, were acquired on dry samples under increasing (up to 30 MPa) and decreas-ing hydrostatic stress. Velocities were measured by usdecreas-ing a pulse-transmission technique. The errors inVP andVSwere
about 1 %. The results are listed in Tables 1 and 2. The ob-tained grain densities (2690±10 and 2700±10 kg m−3for samples Carb-A and Carb-B, respectively) are in agreement with a mineralogy of pure calcite (Mavko et al., 2009). 2.2 Nanoindentation
Table 1.Helium bulk and grain density (in g cm−3), helium porosity (in PU), and air permeability (in mD) measured at benchtop conditions for Carb-A and Carb-B. Permeability of plug Carb-A is below the sensitivity level of the apparatus used (0.1 mD). Values are from Vialle et al. (2013).
Sample ID Porosity Bulk density Grain density Permeability
Carb-A 0.167±0.002 2.24±0.01 2.69±0.01 < 0.1 Carb-B 0.294±0.003 1.90±0.01 2.70±0.01 60±5
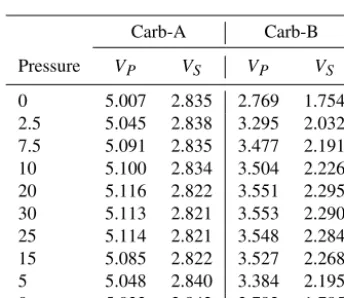
Table 2.Pressure dependence of the elastic wave velocities for the two studied samples. Pressure is in megapascal, andP- andS-wave velocity are in kilometres per second. Values are from Vialle et al. (2013).
Carb-A Carb-B
Pressure VP VS VP VS
0 5.007 2.835 2.769 1.754 2.5 5.045 2.838 3.295 2.032 7.5 5.091 2.835 3.477 2.191 10 5.100 2.834 3.504 2.226 20 5.116 2.822 3.551 2.295 30 5.113 2.821 3.553 2.290 25 5.114 2.821 3.548 2.284 15 5.085 2.822 3.527 2.268 5 5.048 2.840 3.384 2.195 0 5.033 2.842 2.792 1.785
Roughness (Sq) of the surface measured by DS 95 AFM system (Semilab) on 10 µm×10 µm areas was 1.4 µm (rms values) for Carb-A and not measured for Carb-B. The IBIS nanoindentation system (Model B, Fisher-Cripps Laborato-ries Pty.Ltd.) is equipped with a Berkovich-type diamond in-denter (Lebedev et al., 2014) and was used in static mode: the tests consist of continuously recording the load,P, and the displacement, h, of the indenter as it pushes into and withdraws from the surface of the sample. A constant max-imum loading force of 10 mN and an initial contact force of 0.15 mN were used. In total, 961 (31×31) measurements were performed on a 300×300 µm surface with a spacing of 10 µm between measurement points.
Typically, the extraction of the mechanical properties is achieved by using the P-h curves and by applying a continuum-scale mechanical model to obtain the indentation modulus M (Fischer-Cripps, 2004; Lebedev et al., 2014):
Mdef= √
π 2
S √
Ac
, (1)
whereS the is unloading indentation stiffnessS=(dP /dh) and Ac the contact area, extrapolated from the maximum penetration depthhmaxand using the relationAc=24.5h2max according to the geometry of Berkovitch-type indenters (Fischer-Cripps, 2004).
Figure 1.Nanoindentation results for Carb-A (left-hand side) and Carb-B (right-hand side). In blue we illustrate the corresponding moduli range from ultrasonic experiments on dry samples from 0 to 30 MPa confining pressure, and in green we illustrate the mod-uli range given by the solid anisotropic calcite crystal. Overall we observe that the medium effective indentation module M is slightly stiffer for Carb-A (26 GPa vs. 25 GPa).
Data were further corrected considering deviation of the indenter tip from ideal geometry, initial penetration into the rock below a load threshold, and compliance of the loading column, leading to a nominal uncertainty of indentation mod-uli of < 2 GPa.
Young’s moduli, E, can be calculated from the indentation moduli (Fischer-Cripps, 2004) according to
1 M =
1−v2 E +
1−vi2 Ei
. (2)
Indenter properties are Ei=1220 GPa and Ei=0.06,
Figure 2. Simplified segmentation workflow as applied in this study.
3 The CT data sets
3.1 Procedure to get CT images
Two samples were prepared for imaging with micro-XRCT from the cuttings, one from Carb-A and one from Carb-B. A cylindrical-shaped sample of 1.5 cm in height and 2 mm in diameter was achieved by gently grinding the cuttings, first on the side on a rock saw blade, then by hand using sand pa-per (grit 120). This procedure allows us to obtain very thin cylinders while minimizing mechanical damage that classi-cal drilling would produce. These cylindriclassi-cal samples were then glued with Crystalbond509 (SPI suppliers) on a 2 mm diameter flat-head metal pin, which was itself inserted in the core holder of the micro-tomograph. The 3-D X-ray Micro-scope Versa XRM 500 (Zeiss – XRadia) was used with a X-ray energy of 60 keV. Two different settings of source-to-sample and detector-to-source-to-sample distance were used to achieve two nominal voxel sizes of (3.4 µm)3and (0.6 µm)3for Carb-A, and of (3.4 µm)3and (1.1 µm)3for Carb-B, referred to as “low resolution” and “high resolution”, respectively, for each for the two samples. X-ray microscope and image acquisition settings are summarized in Table 3 for each of the two sam-ples.
The number of radiographic projections acquired during sample imaging with low and high resolutions were 3001 and 5001, respectively. The total scanning time for one sample was about 8 h. Initial cone-beam 3-D image reconstruction was performed using the internal software XM Reconstruc-tor (XRadia). To remove geometrical artefacts during recon-struction, a secondary reference was acquired for sample im-ages with maximum resolution.
3.2 Segmentation procedure
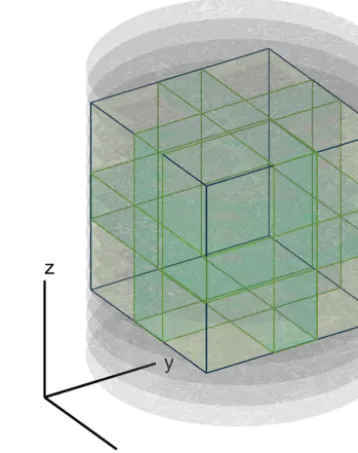
In addition to solid grains and pore space different micritic phases are visible in the raw images of the scans entailing an advanced segmentation procedure. For our segmentation (Fig. 2) we select a region of interest (ROI) from the raw data of the two types of carbonates with two different resolutions (Table 3). The ROI is subdivided in eight partly overlapping subvolumes, each of a size of 4003voxels (Figs. 3 and 4). For the low-resolution images, it thus gives eight cubes with a side of 1.37 mm for both samples, and for the low-resolution images, eight cubes with a side of 0.25 mm for Carb-A and of 0.46 mm for Carb-B.
Our segmentation workflow is applied to the full ROI in-cluding all subvolumes. Image enhancement and
segmenta-Figure 3.Sketch to illustrate the segmentation geometry (here for Carb-B; high resolution). The full cube is subdivided into eight partly intersecting subvolumes with a size of 4003 grid points. Those subvolumes are used in the numerical simulations to estimate effective material properties.
tion steps were carried out using the software package Avizo Fire 9 (FEI Visualization Sciences Group). Before actual seg-mentation the image noise and scan artefacts are reduced while preserving interfaces using a 3-D non-local mean im-age filter. In our experience the standard values of this fil-ter are appropriate (search windows=21, local neighbor-hood=5, similarity value=0.6). Note that every step of im-age enhancement changes the original data set, affecting sub-sequent steps required for data analysis.
The image-enhanced data sets were segmented into classes using global thresholds for the covered range of grey values. The global threshold is valid for all the eight partly over-lapping subvolumes mentioned above. Considering that the samples represent quasi-monomineralic calcitic rocks, we identified the following classes illustrated in Figs. 5 and 6:
– high-confidence pores (illustrated with dark blue colour),
– high-confidence mineral (illustrated with dark red colour),
– and five intermediate classes.
Table 3.CT scanner parameters used for image acquisition of the two carbonate samples. Sample abbreviations are explained in Table 1.
Carb-A Carb-B
Pressure Low resolution High resolution Low resolution High resolution
Voxel size (3.4348 µm)3 (0.6245 µm)3 (3.4352 µm)3 (1.1450 µm)3 Image size 1012×1012 1012×1012 1013×1013 1013×1013
Acceleration voltage 60 kV 60 kV 60 kV 60 kV
Current 80 µA 80 µA 83 µA 83 µA
Source-to-sample distance 50.00 mm 11.10 mm 12.00 mm 12.00 mm Detector-to-sample distance 50.00 mm 120.00 mm 12.00 mm 60.00 mm
Exposure time 20 s 20 s 1 s 6 s
Optical magnification 4× 4× 4× 4×
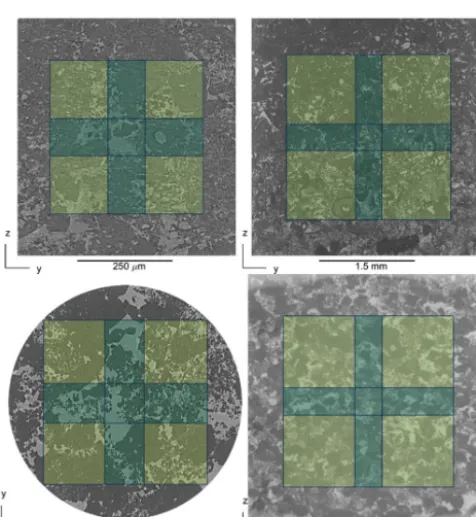
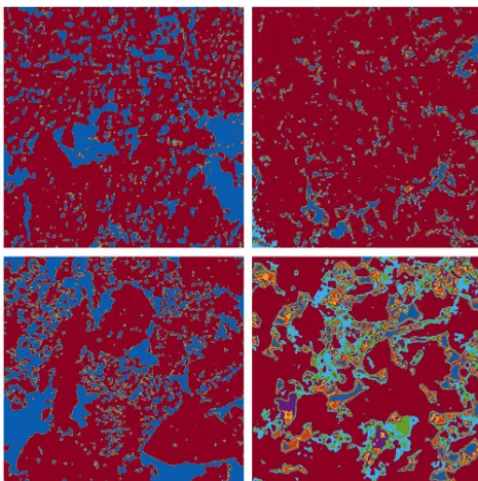
Figure 4. Slices of the raw tiff images of the scanned samples. The dark green areas mark the overlapping zones of the consid-ered subvolumes. Top row: Carb-A with high (left) and low resolu-tion (right). Bottom row: Carb-B with high (left) and low resoluresolu-tion (right).
mineral class and the high-confidence pore class can be in-creased or dein-creased for other materials. In contrast to Lopez et al. (2012) or Ringstad et al. (2013), we do not think that the density can be approximated directly by the grey value of those micritic phases. From our point of view the relationship between grey value and density can be highly non-linear and becomes even more complicated in the case of multimineral rocks. However, we make use of the accepted assumption that lighter grey values in the histogram correspond to lower porosities.
4 Numerical results
In order to numerically calculate the effective intrinsic per-meability k of the digitized rock sample, we calculate the fluxes under creeping flow condition based on a parallelized Stokes solver. The parallelized finite-difference-based Stokes solver is suitable for the calculation of effective hydraulic pa-rameters for low and high porous materials (cf. Osorno et al., 2015). Using volume averaging technique, we coarse-grain the local velocity fieldu(x), obtaining the global velocity componentumin flow direction.
The intrinsic permeability k is calculated with Darcy’s law:
k=µum
1p . (3)
The pressure gradient1pis imposed with pressure boundary conditions in the numerical simulations. The dynamic vis-cosity of the pore fluid is µ. In our numerical simulations 1pis−5.8×10⁻⁴Pa m−1andµis 1.2 Pa s.
To obtain effectiveP- andS-wave velocities of the digi-tized rock samples we use a technique described in detail in Saenger et al. (2011) and references therein. The basic idea of this approach is to study speeds of elastic waves through heterogeneous materials in the long wavelength limit (pore sizewavelength) using the rotated staggered grid (RSG) finite difference algorithm (Saenger et al., 2000) for the sim-ulation of elastic wave velocities (cf. Andrä et al., 2013a, b). 4.1 High resolution
4.1.1 Permeability
26
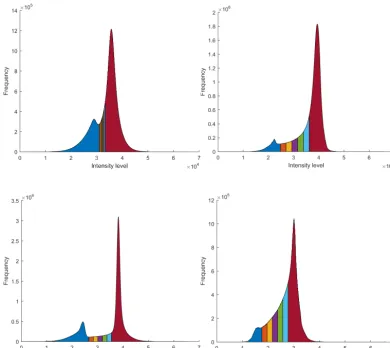
Fig 5.: Color-coded histograms of the scanned samples. Top row: Carb-A with high (left) and low 5
resolution (right). Bottom row: Carb-B with high (left) and low-resolution (right). Between the high-confidence pore phase (marked blue) and the high-high-confidence mineral phase (marked red) we define five intermediate classes to characterize the micritic phases within carbonate rock.
10
Figure 5.Colour-coded histograms of the scanned samples. Top row: Carb-A with high (left) and low resolution (right). Bottom row: Carb-B with high (left) and low resolution (right). Between the high-confidence pore phase (marked blue) and the high-confidence mineral phase (marked red) we define five intermediate classes to characterize the micritic phases within carbonate rock.
(range defined by high-confidence pores to high-confidence grains; see also discussion in Sect. 5.2) showing the mini-mum and maximini-mum deviation in porosity with respect to the experimental investigation. To analyse the homogeneity of the sample this step was performed for all eight subvolumes. For the high-resolution subdomains (Carb-A and Carb-B) we perform Stokes flow simulations only in one direction (z di-rection, cf. Fig. 3).
The left-hand side of Fig. 7 displays the intrinsic perme-ability calculated for the Carb-A high resolution. The poros-ity range of the subvolumes is higher than the experimentally determined porosity. In addition, the numerically calculated permeability values are significantly lower than the values obtained for the low-resolution samples. The right-hand side of Fig. 7 shows the results of the intrinsic permeability cal-culated for the selected high-resolution samples of the Carb-B. It can be observed that the high-resolution sample shows a much lower variation between the extreme values of the porosity range.
From the results of the high-resolution samples, Carb-A and Carb-B, it could be observed that the variation in pore channel arrangement is significant and the permeability in the different subvolumes of the same material does not nec-essarily increase with the porosity increment.
4.1.2 Elasticity
effec-Figure 6. Slices of the segmented images used for the numeri-cal simulations to determine permeability and velocities. Top row: Carb-A with high (left) and low resolution (right). Bottom row: Carb-B with high (left) and low resolution (right).
tive elastic properties (Saenger et al., 2004, 2011, 2016). For these time-of-flight simulations we assign vacuum properties to the pore phase, while the rest of the digital image including the micritic phase will be assumed to be solid with the min-eral properties of calcite (e.g. Andrä et al., 2013b). For the second simulation, we assign vacuum properties to the pores and the first micritic phase, while the rest will be assumed to be solid. We continue this way for all micritic phases, so that the last simulation assigns the mineral properties of calcite only to the high-confidence mineral phase. By this technique we obtain a porosity–velocity trend (Fig. 8) for a random se-lection of high-resolution subvolumes for A and Carb-B:
VP =6259.1 m s−1−ϕ·9640 m s−1+3381 m s−1·ϕ2 (4)
VS=3237.2 m s−1−ϕ·3237.2 m s−1.‘ (5)
This porosity–velocity trend is exactly the same as has been observed for a carbonate data set from a different location used in Saenger et al. (2014). In their paper this trend has been observed for three different resolutions (65 nm, 1 and 4 µm). Please note that due to computational restrictions we are only able to simulate a random selection of subsamples; however, as shown in Fig. 8, all our calculated velocities fol-low the trends according to Eqs. (4) and (5).
4.2 Low resolution 4.2.1 Permeability
Similar to the procedure of the numerical simulation for elas-ticity (Sect. 4.1.2), we vary the sample porosity. This way we get six different porosities for each subvolume depend-ing on the threshold variation. To reduce computational times for the Stokes flow simulation we eliminate the disconnected pores. Some subvolume solid–pore configurations with lower porosities do not present connected pores, and we assume the effective permeabilityk=0.
Figure 9 presents the permeability values for Carb-A (left-hand side) and Carb-B (right-(left-hand side) samples as a func-tion of porosity. For the permeability calculafunc-tions for these samples we perform the Stokes flow simulation in a z-direction only (compare Fig. 3).
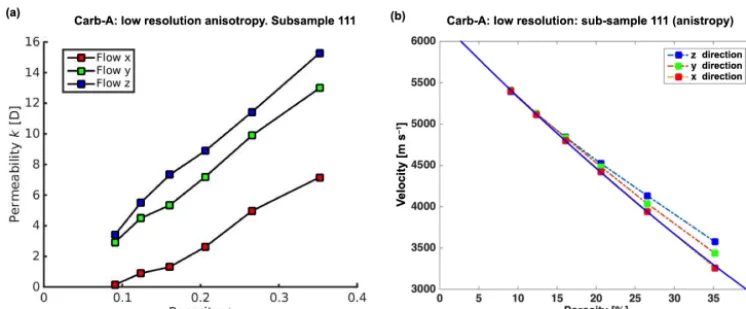
Additionally we performed the Stokes flow simulations in three directions (X, Y, and Z) for Carb-A sample (see Fig. 11). From the simulation results it can be seen that the Carb-A sample permeability (Fig. 11, left-hand side) is anisotropic with a variation between directions of up to 80 %. In some subvolumes permeability value varies by up to 2 or-ders of magnitude.
From the CT data of the low-resolution Carb-A, the largest domain that could be extracted is 2.4 mm×2.4 mm×2.4 mm (6893 voxels). The perme-ability calculated for this domain is 13.0 D for a porosity of ϕ=0.173.
4.2.2 Elasticity
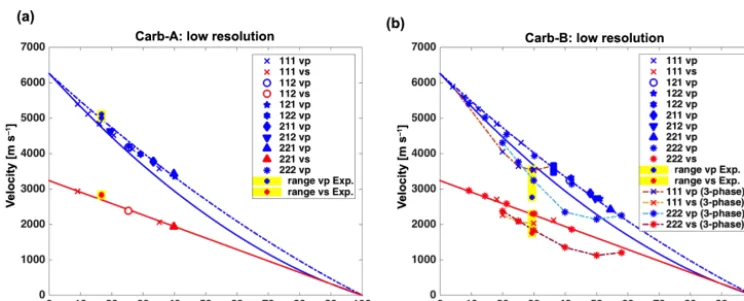
For the low-resolution scans we repeat the two-phase simula-tions for Carb-A and Carb-B as described in Sect. 4.1.2. The results are displayed in Fig. 10. Interestingly, the two-phase trend given by Eqs. (4) and (5) is confirmed only clearly for S-wave velocities of Carb-A and Carb-B. For the case of P-wave velocities we observe a slightly different trend (cf. Eq. 4) that we illustrate with blue dashed/dotted lines in Fig. 10:
VP =6259.1 m s−1−ϕ·7970 m s−1+1700,m s−1·ϕ2. (6)
val-Figure 7.Intrinsic permeability simulated for the eight subvolumes. Results are given for the extreme porosities configuration of Carb-A (left-hand side) and Carb-B (right-hand side) high-resolution samples.
Figure 8.EffectiveP- andS-wave velocities (red and blue dots, respectively) for simulations based on a two-phase segmentation. The results were obtained for a random selection of subvolumes of Carb-A (left-hand side) and Carb-B (right-hand side). The blue and red lines are the velocity trends given by Eqs. (4) and (5). The green lines are derived by using the upper Hashin–Shtrikman bounds. For details please refer to the text.
ues for the high-confidence pores and use the known elastic moduli of calcite (e.g. Andrä et al., 2013b) for the remaining phases. The results are displayed with green dots for Carb-B in Fig. 10. We repeat the procedure with different intervals of the micritic phases. There are three interesting observa-tions: (1) the resulting effective velocities are always signif-icantly below the observed two-phase trend, (2) the curves for different intervals will intersect each other, and (3) the experimental determined velocities for high confining pres-sures are between the multiphase results and the two-phase trend as described above.
5 Discussion
In this paper we compare results from laboratory investiga-tions with numerical estimates based on digital images. Note that in laboratory experiments we use samples on the cen-timetre scale for the determination of permeability and ultra-sonic velocities and compare it with DRP predictions based on images on the millimetre scale. Especially because of the
known heterogeneity of carbonates there is always a risk that the selected scanned area is not representative compared to the full sample size used for laboratory characterizations. In general, a multiscale approach as suggested by Ringstad et al. (2013) should be used for upscaling the results to the plug scale. However, our studies on Carb-A and Carb-B suggest workflows which should be applied in practice for as many samples as possible for improving the statistical significance. 5.1 Discussion of experimental characterization
Figure 9.Simulated intrinsic permeability as a function of porosity. Results for the eight subvolumes of Carb-A (left-hand side) and Carb-B (right-hand side) low-resolution samples. Squares markers display each of the pore–solid configurations.
Figure 10.EffectiveP-wave andS-wave velocities (red and blue dots, respectively) for simulations based on a two-phase segmentation. The results were obtained for subvolumes of the low-resolution images of Carb-A (left-hand side) and of Carb-B (right-hand side). The blue and red lines are the velocity trends given by Eqs. (4) and (5); the blue dashed/dotted line is the trend given by Eq. (6). The experimental results (interval from 0 to 30 MPa confining pressure) are illustrated with crosses connected with yellow bars for comparison. The green dots display the results of the multiphase simulations (only performed for Carb-B and forP waves). For details please refer to the text.
by void, and establishing a porosity–velocity trend. A more advanced technique using dry and wet imaging is suggested by Bhattad et al. (2014) using the difference imaging to ap-proximate effective properties. However, the nanoindentation technique provides a measure for the distribution of effec-tive elastic properties at the micrometre scale, and can thus potentially constrain the input parameters for the different phases identified during the segmentation. To be able to do so, nanoindentation needs to provide bulk and shear moduli from each of the measurements (load–displacement curves) and we need to obtain effective bulk and shear moduli val-ues for each of the identified phases in the microtomography (pores, calcite grains, and the five micritic phases). However, if nanoindentation technique is a well-established technique in material sciences, which deals with homogeneous, purely elastic materials, this is, as of today, not the case for rocks, which are heterogeneous materials with both elastic and non-elastic behaviour (creep). Though nanoindentation tests
There-Figure 11.Left-hand side: intrinsic permeability for subvolume 111 of Carb-A low resolution. Permeability calculated from flow simulated in x,y, andzdirections. Right-hand side:P-wave velocities for all propagation directions of the same subsample. The solid line is the velocity trend given by Eq. (4). The moderate anisotropy visible in permeability is not present for the velocities.
fore the direct translation of moduli derived from nanoinden-tation also remains difficult. The resolution of nanoindenta-tion used in this study allows for determining effective elastic properties at slightly bigger scales than those used here for the micro-XRCT.
Regnet et al. (2014) showed that there is a relationship be-tween micrite microstructure and laboratory ultrasonic veloc-ities on core samples, with samples with a higher content of tight micrite, exhibiting higher velocities, and samples with a higher content of microporous micrite, exhibiting lower ve-locities. Studied core samples were through a mixture of dif-ferent types of micrite and the measured velocities represent effective properties at the core scale. This observation is re-flected in the established porosity–velocity trends (Eqs. 4, 5, and 6): micritic phases with density closer to that of calcite (tight micrites) have higher velocities than micritic phases with lower density (Figs. 8 and 10), which are closer to that of pores (microporous micrites).
5.2 Discussion of porosity: experiments vs. digital rock physics
After the segmentation it is also possible to estimate the porosities of the samples. Based on the suggested workflow described in Sect. 3.2 there will be a lower and upper bound. For the lower bound we will treat only the high-confidence pores as pores; for the upper bound we count only high-confidence minerals as minerals.
We obtain a porosity range between 25 and 35 % for the high-resolution data of Carb-A and a range between 7.5 and 31 % for the low-resolution data. We observe that the mean value is in rough agreement with the experimentally deter-mined porosity of 16.7 % (see Table 1) only for the low-resolution case. Although also the experimental value comes with an error we conclude that the high-resolution data set for Carb-A is maybe not representative for the full sample used
for the helium porosity in the laboratory. In case of Carb-B the intervals range from 13 to 45 and 7 to 48 % for the high-resolution and low-resolution case, respectively. Here the mean value is in both cases closer to the experimentally determined porosity of 29.4 %.
We conclude that the porosity values of carbonates using micro-XRCT data will only provide estimates with a rela-tively high uncertainty due to the significant amount of unre-solved pore features in the images. An indication is the result of the mercury-intrusion experiments presented by Vialle et al. (2013): the pore throats of the micritic phase are mainly below the resolution of available micro-XRCT devices. 5.3 Discussion of permeability: experiments vs. digital
rock physics
ob-served that for a porosity below 25 %, permeability values of carbonates can span several orders of magnitude (e.g. Fig. 3 of Vialle et al., 2013). Therefore we suggest considering a statistically significant number of samples to characterize a formation and found that eight samples are sufficient for the numerical permeability calculations (see Figs. 7 and 9). 5.4 Discussion of elasticity: experiments vs. digital rock
physics
There are two important observations. The two-phase trend (displayed with solid and dashed/dotted lines) seems to be an upper bound for velocities. This data-driven upper bound is much stricter than the bound given by Hashin–Shtrikman (see Fig. 8) and is now confirmed for several carbonates us-ing several resolutions (this study and Saenger et al., 2014). Only for the low-resolution images we observe a slightly dif-ferent trend forP waves (Eq. 6 and Fig. 10).
The trend given by the envelope of the multiphase sim-ulations (displayed by dashed/dotted lines in Fig. 10, right-hand side) is not a strict lower bound, because the shape will strongly depend on the applied method to determine effec-tive elastic properties for areas which are below the reso-lution limit of the used XRCT technique. The best choice to our knowledge is the two-phase trend discussed above, which can be regarded as a carbonate-data-driven effective medium approach. We suggest implementing here in the fu-ture also the findings of the nanoindentation experiments. However, we observe that the velocities obtained for the mul-tiphase simulations are in a reasonable agreement with lab-oratory measurements. This is the case for a known poros-ity determined in complementary laboratory studies (see also Sect. 5.1). For carbonates the distribution of the micritic phases and their effective elastic behaviour is crucial to pre-dict the effective wave speeds.
5.5 Discussion of anisotropy: elasticity vs. permeability In general we do not observe any significant anisotropy for permeability and for velocities of the considered samples. However, a few samples are out of this general trend. One example is a subvolume of Carb-A (low-resolution case), for which we show the results forP-wave velocities and perme-abilities in Fig. 11. Interestingly, the moderate anisotropy for the permeability is not present for the velocity.
6 Summary
With the current imaging techniques it remains difficult to resolve microstructures (on submicrometre scale) and image a representative volume at the same time, which is essential to understand the effective material properties of rocks. For this purpose the exact determination of the porosity of the rock samples is the most relevant parameter. To overcome this problem, we have conducted a specific multiphase
seg-mentation technique and a careful calibration of DRP esti-mates with laboratory data. Especially for carbonate samples it is difficult to exactly estimate the porosity from raw CT data, because the micritic phases remain unresolved with an unknown porosity. Therefore, we use our presented numeri-cal results in an inverse way. We suggest using the porosity determination from the laboratory and go back to our low-resolution trends given in Figs. 9 and 10. With a given poros-ity we can now estimate the permeabilporos-ity and the effective wave velocities.
In case of the studied samples Carb-A and Carb-B, we can predictP andS-wave velocities with a good agreement to laboratory results. The presented two-phase trend (Eqs. 4, 5, and 6) is found to be an upper bound for a wide range of scales and can also be used as an effective medium approach to the micritic phases. The predicted permeability values are only in good agreement for Carb-B. Most probably the low-resolution image of Carb-A is not representative for the sam-ple used in the laboratory.
However, for the used carbonate rock samples anisotropy seems insignificant for elastic as well as for hydraulic prop-erties.
In general, the resolution of the XRCT is the limiting fac-tor for the application of DRP for carbonate rock. The mi-critic phases remain unresolved even for the highest reso-lutions available. Therefore, the effective elastic properties have to be approximated. Our suggestion is to use the trend of the two-phase simulations. The implemented workflow in this paper can be applied in general for numerical estimates of mechanical and transport properties of carbonates. Be-cause of the known strong heterogeneity of carbonates we suggest using a statistically significant amount of digital im-ages to characterize a formation.
Acknowledgements. Erik H. Saenger would like to thank Exxon-Mobil for the support of some ideas presented in this study. This work was partially funded by Curtin Reservoir Geophysical Con-sortium (CRGC). The authors thank the National Geosequestration Laboratory (NGL) of Australia for providing access to the X-ray microscope Versa XRM 500 (Zeiss – XRadia) and to the Nanoin-dentation system (Fisher-Crips Laboratories Pty.Ltd.). Funding for this facility was provided by the Australian Federal Government.
Edited by: M. Halisch
Reviewed by: O. Lopez and one anonymous referee
References
Abousleiman, Y. N., Tran, M. H., Hoang, S., Bobko, C. P., Ortega, A., and Ulm, F. J.: Geomechanics field and laboratory character-ization of the Woodford Shale: The next gas play, SPE Annual Technical Conference and Exhibition, 2007.
2013a.
Andrä, H., Combaret, N., Dvorkin, J., Glatt, E., Han, J., Kabel, M., Keehm, Y., Krzikalla, F., Lee, M., Madonna, C., Marsh, M., Mukerji, T., Saenger, E. H., Sain, R., Saxena, N., Ricker, S., Wiegmann, A., and Zhan, X.: Digital rock physics benchmarks-Part II: Computing effective properties, Comput. Geosci., 50, 33– 43, 2013b.
Arns, C. H., Knackstedt, M. A., Pinczewskiz, M. V., and Gar-boczi, E. J.: Computation of linear elastic properties from microtomographic images: Methodology and agreement be-tween theory and experiment, Geophysics, 67, 1396–1405, doi:10.1190/1.1512785, 2002.
Bhattad, P., Young, B., Berg, C. F., Rustad, A. B., and Lopez, O.: X-ray micro-ct assisted drainage rock typing for characterization of flow behaviour of laminated sandstone reservoirs: International Symposium of the Society of Core Analysts, Avignon, France, SCA2014-024, 2014.
Blunt, M. J., Bijeljic, B., Dong, H., Gharbi, O., Iglauer, S., Mostaghimi, P., Paluszny, A., and Pentland, C.: Pore-scale imaging and modelling, Adv. Water Resour., 51, 197–216, doi:10.1016/j.advwatres.2012.03.003, 2013.
Cantrell, D. L. and Hagerty, R. M.: Microporosity in Arab Forma-tion Carbonates, Saudi Arabia, GeoArabia, 4, 129–154, 1999. Cnudde, V. and Boone, M. N.: High-resolution X-ray
com-puted tomography in geosciences: A review of the cur-rent technology and applications, Earth-Sci. Rev., 123, 1–17, doi:10.1016/j.earscirev.2013.04.003, 2013.
Costanza-Robinson, M. S., Estabrook, B. D., and Fouhey, D. F.: Representative elementary volume estimation for porosity, mois-ture saturation, and air-water interfacial areas in unsaturated porous media: Data quality implications, Water Resour. Res., 47, W07513, doi:10.1029/2010WR009655, 2011.
Cremonini, G., Elmi, C., and Selli, R.: Note illustrative della carta geologica d’Italia. Foglio 156 “S. Marco in Lamis”, Servizio Ge-ologico d’Italia, 1971.
Derzhi, N., Dvorkin, J., Diaz, E.,Baldwin, C., Fang, Q., Sulayman, A., Soroka, W. L., Clark, A., Al Dayyni, T., and Kalam, Z: Com-parison of traditional and digital rock physics techniques to deter-mine the elastic core parameters in Cretaceous formations, Abu Dhabi, Abu Dhabi International Petroleum Exhibition & Confer-ence, Abu Dhabi, UAE, SPE-138586-PP, 2010.
Deville de Periere, M., Durlet, C., Vennin, E., Lambert, L., Bouril-lot, R., Caline, B., and Poli, E.: Morphometry of micrite particles in cretaceous microporous limestones of the Middle East: Influ-ence on reservoir properties, Mar. Petrol. Geol., 28, 1727–1750, doi:10.1016/j.marpetgeo.2011.05.002, 2011.
Fischer-Cripps, A. C.: Nanoindentation, 2nd Edn., Springer-Verlag, ISBN 0387220453, 2004.
Fusseis, F., Xiao, X., Schrank, C., and De Carlo, F.: A brief guide to synchrotron radiation-based microtomography in (struc-tural) geology and rock mechanics, J. Struct. Geol., 65, 1–16, doi:10.1016/j.jsg.2014.02.005, 2014.
Hill, R.: Elastic properties of reinforced solids: some theoretical principles, J. Mech. Phys. Solids, 11, 357–372, 1963.
Klein, C. A. and Cardinale, C. F.: Young’s modulus and Poisson’s ratio of CVD diamond, Diam. Relat. Mater., 2, 918–923, 1992. Lambert, L., Durlet, C., Loreau, J. P., and Marnier, G.: Burial
dis-solution of micrite in Middle East carbonate reservoirs (Jurassic-Cretaceous): Keys for recognition and timing, Mar. Petrol. Geol., 23, 79–92, doi:10.1016/j.marpetgeo.2005.04.003, 2006. Lebedev, M., Wilson, M. E. J., and Mikhaltsevitch, V.: An
ex-perimental study of solid matrix weakening in water-saturated Savonnières limestone, Geophys. Prospect., 62, 1253–1265, doi:10.1111/1365-2478.12168, 2014.
Lopez, O., Mock, A., Øren, P. E., Long, H., Kalam, Z., Vahrenkamp, V., Gibrata, M., Seraj, S., Chacko, S., Al Hammadi, M., Al Hosni, H., Sahn, H., and Vizamora, A.: Validation of fundamental car-bonate reservoir core properties using digital rock physics, In-ternational Symposium of the Society of Core Analysts held in Aberdeen, Scotland, UK, SCA2012-19, 2012.
Madonna, C., Quintal, B., Frehner, M., Almqvist, B. S. G., Tisato, N., Pistone, M., Marone, F., and Saenger, E. H.: Synchrotron-based X-ray tomographic microscopy for rock physics investiga-tions, Geophysics, 1, D53–D64, doi:10.1190/GEO2012-0113.1, 2013.
Martinis, B. and Pavan, G.: Note illustrative della carta geolog-ica d’Italia, Foglio 157 “Monte S. Angelo”: Servizio Geologico d’Italia, Roma, 1967.
Mavko, G., Mukerji, T., and Dvorkin, J.: The rock physics hand-book, Cambridge University Press, 2009.
Moshier, S. O.: Microporosity in micritic limestones: A re-view, Sediment. Geol., 63, 191–213, doi:10.1016/0037-0738(89)90132-2, 1989.
Osorno, M., Uribe, D., Ruiz, O. E., and Steeb, H.: Finite Dif-ference Calculations of Permeability in Large Domains in a Wide Porosity Range, Arch. Appl. Mech., 85, 1043–1054, doi:10.1007/s00419-015-1025-4, 2015.
Regnet, J. P., Robion, P., David, C., Fortin, J., Brigaud, B.,and Yven, B.: Acoustic and reservoir properties of micro-porous carbonate rocks: Implication of micrite particle size and morphology, J. Geophys. Res.-Sol. Ea., 120, 790–811, doi:10.1002/2014JB011313, 2014.
Ringstad, C., Westphal, E., Mock, M., Al Hammadi, M., Al Ra-trout, A., and Kalam, Z.: Elastic Properties of Carbonate Reser-voir Rocks Using Digital Rock Physics: 75th EAGE Conference & Exhibition, London, 10–13 June 2013.
Saenger, E. H., Gold, N., and Shapiro, S. A.: Modeling the prop-agation of elastic waves using a modified finite-difference grid, Wave Motion, 31, 77–92, doi:10.1016/S0165-2125(99)00023-2, 2000.
Saenger, E. H., Krüger, O. S., and Shapiro, S. A.: Numeri-cal considerations of fluid effects on wave propagation: In-fluence of the tortuosity, Geophys. Res. Lett., 31, L21613, doi:10.1029/2004GL020970, 2004.
Saenger, E. H., Madonna, C., Osorno, M., Uribe, D., and Steeb, H.: Digital Carbonate Rock Physics, SEG Annual Meeting, Denver, Colorado, 2014.
Saenger, E. H., Lebedev, M., Uribe, D., Osorno, M., Vialle, S., Duda, M., Inglauer, S., and Steeb, H.: Analysis of high res-olution X-ray CT images of Bentheim sandstone under el-evated confining pressure, Geophys. Prospect., 64, 848–859, doi:10.1111/1365-2478.12400, 2016.
Scotellaro, C., Vanorio, T., and Mavko, G.: The effect of mineral composition and pressure on carbonate rocks, 77th Annual Inter-national Meeting, SEG, Expanded Abstracts, 1684–1689, 2004. Ulm, F.-J. and Abousleiman, Y.: The nanogranular nature of shale:
Acta Geotechnica, 1, 77–88, doi:10.1007/s11440-006-0009-5, 2006.
Vialle, S. and Lebedev, M.: Heterogeneities in the elastic properties of microporous carbonate rocks at the microscale from nanoin-dentation tests, SEG Technical Program Expanded Abstracts, 3279–3284, doi:10.1190/segam2015-5885016.1, 2015.
Vialle, S., Dvorkin, J., and Mavko, G.: Implications of pore micro-geometry heterogeneity for the movement and chemical reactiv-ity of CO2in carbonates, Geophysics, 78, L69–L86, 2013. Wang, Y., Yang, Y., Xiao, T., Liu, K., Clennell, B., Zhang, G.,