Research
Article
Automated Dimension Determination for
NMF-based Incremental Collaborative Filtering
Xiwei Wang
1,∗, Jun Zhang
2, and Ruxin Dai
31Department of Computer Science, Northeastern Illinois University, Chicago, Illinois 60625, USA 2Department of Computer Science, University of Kentucky, Lexington, Kentucky 40506-0633, USA
3Department of Computer Science and Information Systems, University of Wisconsin River Falls, River Falls,
Wisconsin 54022, USA
Abstract
The nonnegative matrix factorization (NMF) based collaborative filteringte chniquesha veac hievedgreat
success inproductrecommendations.It iswellknownthat in NMF, thedimensionsof the factormatrices
havetobedeterminedinadvance.Moreover,dataisgrowingfast;thusinsomecases,thedimensionsneedto
bechangedtoreducetheapproximationerror.Therecommendersystemsshouldbecapableofupdatingnew
datainatimelymannerwithoutsacrificingthepredictionaccuracy.
Inthispaper,weproposeanNMFbaseddataupdateapproachwithautomateddimensiondeterminationfor
collaborativefilteringpurposes.Theapproachcandeterminethedimensionsofthefactormatricesandupdate
themautomatically.Itexploitsthenearestneighborhoodbasedclusteringalgorithmtoclusterusersanditems
accordingtotheirauxiliaryinformation,andusestheclustersastheconstraintsinNMF.Thedimensionsofthe
factormatricesareassociatedwiththeclusterquantities.Whennewdatabecomesavailable,theincremental
clusteringalgorithm determineswhethertoincrease thenumberof clustersormergethe existingclusters.
Experimentsonthreedifferent datasets(MovieLens, Sushi,andLibimSeTi)wereconductedtoexaminethe
proposedapproach.Theresultsshowthatourapproachcanupdatethedataquicklyandprovideencouraging
predictionaccuracy.
Receivedon 27 December 2014;acceptedon 30 June 2015;publishedon17 December 2015
Keywords: auxiliaryinformation,incrementalclustering,datagrowth,collaborativeFiltering,NMF
Copyright©2015 XiweiWang etal., licensedto EAI. Thisisanopen accessarticledistributedunderthetermsofthe Creative Commons Attribution license (http://creativecommons.org/licenses/by/3.0/), which permits unlimited use,distributionandreproductioninanymediumsolongastheoriginalworkisproperlycited.
doi:10.4108/eai.17-12-2015.150804
1. Introduction
The advent of the Internet has generated exponential growth of various kinds of data. For average people, easy-to-use tools are highly desired to retrieve useful information that is beneficial to their daily life. In eCommerce, a large number of online shopping websites employ recommender systems to make personalized product recommendations. In general, a recommender system is a program that utilizes algorithms to predict users’ preferences by profiling their shopping patterns. With the help of recommender systems, online merchants could better sell their products to the users who have visited their websites
∗
Correspondingauthor.Email:[email protected]
in the past. Collaborative filtering (CF) techniques are one of the most popular fundamental algorithms in recommender systems. CF aims at predicting users’ preferences based on their transaction history and/or their feedback on products. There are different types of CF techniques, e.g., item/user correlation based CF’s [16], singular value decomposition (SVD) based latent factor CF’s [17], and nonnegative matrix factorization (NMF) based CF’s [3][23].
One of the critical components of a recommender system is the user data. CF techniques require at least users’ rating data, which reflects their preferences over products, to make the predictions. In addition, the auxiliary information associated with users and items is also taken into account by some CF models. Chen et al. [4] proposed a toolkit for the feature
1
EAI Endorsed Transactions
EA
on
Collaborative Computing
EAI Endorsed Transactions on
Collaborative Computing 11-122015|Volume1|Issue5|e2
based collaborative filtering, named SVDFeature. They presented an example of using the toolkit. In their example, the album information and the temporal information are treated as auxiliary information in their SVDFeature for better prediction. Gu et al. [6] incorporated user and item graphs into an NMF based CF algorithm to improve the prediction accuracy. It is known that in some datasets, e.g., the MovieLens dataset [17], the Sushi preference dataset [10], and the LibimSeTi dating agency dataset [2], auxiliary information such as users’ demographic data and items’ category data, are also provided. This information, if properly used, can improve the recommendation accuracy, especially when the original rating matrix is extremely incomplete.
Furthermore, CF algorithms must be able to handle the fast data growth efficiently. In general, data grows in two aspects: new items/users with their transaction or rating data and the accompanying auxiliary infor-mation. The algorithms need to update the data and provide recommendations in a timely manner. Addi-tionally, the matrix factorization based collaborative filtering algorithms require the dimensions of the factor matrices to be set in advance. When new data becomes available, the dimensions need to be updated.
In this paper, we propose an NMF based data update approach with automated dimension determination for collaborative filtering purposes. The approach, named iCluster-NMF, is based on the incremental clustering algorithm and the incremental nonnegative matrix tri-factorization (NMTF) [5]. It can determine the dimensions of the factor matrices and update them automatically. It exploits the nearest neighborhood based clustering algorithm to cluster users and items according to their auxiliary information, and uses the clusters as the constraints in NMF. The dimensions of the factor matrices are associated with the cluster quantities. When new data arrives, the incremental clustering algorithm determines whether to increase the number of clusters or merge the existing clusters. We examine our approach on previously mentioned three datasets in three aspects: (1) the correctness of the approximated rating matrix, (2) the time cost of the algorithms, and (3) the number of clusters produced by the approach. The results show that our approach can update the data quickly and provide satisfactory prediction accuracy.
The contributions of this paper are twofold: (1) utilizing auxiliary information as the constraints in NMTF for data approximation; (2) incorporating the incremental clustering technique into NMTF to automatically determine the dimensions of the factor matrices.
The remainder of this paper is organized as follows. Section 2 presents the related work. Section 3defines the problem and related notations. Sections 4 and 5
describe the main idea of the proposed approach as well as a comparison model. Section 6 studies the experiments and discusses the results. Some concluding remarks and future work are given in7.
2. Related Work
With the increasing popularity of online applications, the problem of managing fast growing data has become one of the major research topics in data science. The emergence of eCommerce has greatly facilitated people’s life and expedited the daily purchases. With a large amount of new data arriving, the recommender systems employed by online merchants have to update and process the data efficiently. In [1], Brand proposed update rules for adding data to a “thin” SVD data model, which is used to update new data into the lightweight recommender systems. Wang and Zhang [20] incorporated the missing value imputation and the randomization based perturbation into incremental SVD for privacy preserving collaborative filtering data update. Wang et al. [21] proposed a swarm intelligence based recommendation algorithm, named Ant Collaborative Filtering, to capture the evolution of user preference over time. By doing so, the new data can be dynamically updated online.
Our proposed approach uses NMF as the funda-mental technique for the data update. In [23], Zhang et al. applied NMF to collaborative filtering to learn the missing values in the rating matrix. They treated NMF as a solution to the expectation maximization (EM) problems. Chen et al. [3] proposed an orthogonal nonnegative matrix tri-factorization (ONMTF) [5] based collaborative filtering algorithm. Their algorithm also takes into account the user similarity and item similar-ity. Nirmal et al. [19] proposed explicit incorporation of the additional constraint, called the “clustering con-straint”, into NMF in order to suppress the data patterns in the process of performing the matrix factorization. Their work is based on the idea that one of the factor matrices in NMF contains cluster membership indi-cators. The clustering constraint is another indicator matrix with altered class membership in it. This con-straint then guides NMF in updating factor matrices. Based on this idea, the proposed model applies the user and item cluster membership indicators to nonnegative matrix tri-factorization (NMTF), which results in better imputation of the missing values.
With regard to the clustering algorithms, K-Means [14] is a popular and well studied approach that is easy to implement and is widely used in many domains. As the name of the algorithm indicates, K-Means needs the definition of “mean” prior to clustering. It minimizes a cost function by calculating the means of clusters. This makes K-Means most suitable for continuous numerical data. When given categorical data such as users’
2
EAI
European Alliance for InnovationEAI Endorsed Transactions on
Automated Dimension Determination for NMF-based Incremental Collaborative Filtering
demographic data and movies’ genre information, K-Means needs a pre-processing phase to make the data suitable for clustering. Huang [7] proposed a K-Modes clustering algorithm to extend the K-Means paradigm to categorical domains. Their algorithm introduces new dissimilarity measures to handle categorical objects and replaces means of clusters with modes. Additionally, a frequency based method is used to update modes in the clustering process so that the clustering cost function is minimized. In 2005, Huang et al. [8] further applied a new dissimilarity measure to the K-Modes clustering algorithm to improve its clustering accuracy.
The fast data growth requires the clustering algo-rithms to update the clusters constantly. The number of clusters might be increased or decreased. Su et al. [18] proposed a fast incremental clustering algorithm by changing the radius threshold value dynamically. Their algorithm restricts the number of the final clus-ters and reads the original dataset only once. It also considers the frequency information of the attribute values in the inter-cluster dissimilarity measure. Our approach adopts their clustering algorithm with some modifications. As stated previously, it is known that the NMF based collaborative filtering algorithms need to determine the dimensions of the factor matrices and update them when necessary. It is not convenient for people to manually specify these values and the automated decision making is highly desired. To this purpose, the proposed method determines the number of clusters by an incremental clustering algorithm and uses them as the dimensions in NMF.
3. Problem Description
Assume the data owner has three matrices: an incomplete user-item rating matrix R∈Rm×n, a user
feature matrixFU ∈Rm×kU, and an item feature matrix
FI ∈Rn×kI, where there are m users, nitems, kU user features, and kI item features. An entry rij in R represents the rating left on item j by user i. The approximated matrix, denoted byRr ∈Rm×n is the one that has all unknown values predicted in it.
When new users’ ratings arrive, the new rows, denoted byT ∈Rp×n, should be appended to the
orig-inal matrixR. Meanwhile, their auxiliary information is also available, and thus the feature matrix is updated as well, i.e.,
" R T
#
→R0,
" FU
∆FU
#
→F0
U (1)
where∆FU ∈Rp×kU.
Similarly, when new items become available, the new columns, denoted byG∈Rm×q, should be appended to
the original matrixR, so should the item feature matrix, i.e.,
h
R G i→R00,
" FI
∆FI
#
→F0
I (2)
where∆FI ∈Rq×kI.
4. iCluster-NMF Data Update
In this section, we will introduce the iCluster-NMF algorithm and its application in collaborative filtering data update.
4.1. Cluster-NMF
While iCluster-NMF handles the incremental data update, it is necessary to present the non-incremental version, named Cluster-NMF beforehand. This section is organized as follows: developing the objective function, deriving the update formulas, and the detailed algorithms.
Objective Function. Nonnegative matrix factorization (NMF) [13] is a widely used dimension reduction method in many applications such as clustering [5][11], text mining [22][15], data distortion based privacy preservation [9][19], etc. NMF is also applied in col-laborative filtering to make product recommendations [23][3]. However, in CF data, a single user may have rated only a few items and one item may get only a small number of ratings. Therefore, the rating matrix is typically incomplete and NMF cannot directly work on it. In [23], Zhang et al. proposed the weighted NMF (WNMF) to work with incomplete matrices without a separate imputation procedure.
Given a rating matrix R and the associated weight matrixW ∈Rm×n that indicates the existence of values
inR, the objective function of WNMF is
minU≥0,V≥0f(R, W , U , V) =kW◦(R−U VT)k2F (3)
whereU andV are two orthogonal nonnegative matri-ces, and◦denotes the element-wise multiplication.
wij=
(
1 if rij ,0 0 if rij = 0 (wij
∈W , rij ∈R) (4)
When WNMF converges, ˜R=U VT is the matrix with all missing entries filled. This process can be treated as either missing value imputation or unknown rating prediction.
Because of NMF’s intrinsic property, when given a matrix R with objects as rows and attributes as columns, matrices U and V contain the clustering information of the objects. With that being said, in some cases, the data matrix R can represent relationships between two types of objects, e.g., user-item rating matrices in collaborating filtering applications and term-document matrices in text mining applications.
3
EAI
European Alliance for InnovationEAI Endorsed Transactions on
It is expected that both row (user/term) clusters and column (item/document) clusters can be obtained by performing NMF on R. With conventional NMF, it is very difficult to find two matrices U and V that represent user clusters and item clusters respectively at the same time. Hence, an extra factor matrix is needed to absorb the different scales ofR,U, andV for simultaneous row clustering and column clustering [5]. Eq. (5) gives the objective function of the nonnegative matrix tri-factorization (NMTF).
minU≥0,S≥0,V≥0f(R, U , S, V) =kR−U SVTk2F (5)
whereU ∈Rm+×k,S ∈R+k×l, andV ∈Rn+×l.
The use ofS brings in a large scale of freedom for
U and V so that they can focus on row and column clustering. In this scheme, both U and V are cluster membership indicator matrices whileSis the coefficient matrix. Note that objects corresponding to rows in R
are clustered into k groups and objects corresponding to columns are clustered intolgroups.
With the auxiliary information of users and items, we can convert NMTF to a supervised learning procedure by applying cluster constraints to the objective function (5), giving the equation
minU≥0,S≥0,V≥0f(R, U , S, V , CU, CI) =
α· kR−U SVTk2
F+β· kU −CUkF2+γ· kV−CIk2F (6)
whereα,β, andγare coefficients that control the weight of each part. CU and CI are user cluster matrix and item cluster matrix, respectively. They are obtained by running clustering algorithms on user feature matrix
FU and item feature matrixFI as mentioned in Section
3.
Combining Eqs. (3) and (6), we develop the objective function for the weighted and constrained nonnegative matrix tri-factorization, i.e.,
minU≥0,S≥0,V≥0f(R, W , U , S, V , CU, CI) =
α· kW ◦(R−U SVT)k2
F+β· kU−CUk2F+γ· kV −CIk2F. (7)
We name this matrix factorization the Cluster-NMF.
Update Formulas. In this section, we illustrate the derivation of the update formulas for Cluster-NMF.
Let L=f(R, W , U , S, V , CU, CI), X=kW◦(R−
U SVT)k2
F, Y =kU−CUk2F, and Z=kV−CIk2F. Take derivatives ofXwith respect toU,S, andV:
∂X
∂U =−2(W◦R)V S
T + 2W◦(U SVT)V ST (8)
∂X ∂S =−2U
T(W ◦R)V+ 2UT[W◦(U SVT)]V (9)
∂X
∂V =−2(W◦R)
TU S+ 2[W◦(U SVT)]TU S (10)
Take derivatives ofY with respect toU,S, andV:
∂Y
∂U = 2U−2CU, ∂Y ∂S =
∂Y
∂V = 0 (11)
Take derivatives ofZwith respect toU,S, andV:
∂Z ∂U =
∂Z ∂S = 0,
∂Z
∂V = 2V−2CI (12)
Using Eqs. (8) to (12), we get the derivatives ofL:
∂L
∂U = 2α[W◦(U SV
T)]V ST + 2βU
−2α(W◦R)V ST −2βCU
(13)
∂L
∂V = 2α[W◦(U SV
T)]TU S+ 2γV
−2α(W◦R)TU S−2γCI
(14)
∂L ∂S = 2αU
T[W◦(U SVT)]V
−2αUT(W◦R)V
(15)
To obtain update formulas, we apply the Karush-Kuhn-Tucker (KKT) complementary condition [12] to the nonnegativities ofU,S, andV. We have
{2α[W◦(U SVT)]V ST + 2βU
−2α(W◦R)V ST −2βCU}ijUij = 0 (16)
{2α[W◦(U SVT)]TU S+ 2γV
−2α(W◦R)TU S−2γCI}ijVij = 0 (17) {2αUT[W◦(U SVT)]V−2αUT(W◦R)V}ijSij = 0
(18) They give rise to the corresponding update formulas:
Uij=Uij·
{α(W◦R)V ST +βCU}ij
{α[W◦(U SVT)]V ST +βU}ij (19)
Vij =Vij·
{α(W◦R)TU S+γCI}ij
{α[W◦(U SVT)]TU S+γV}ij (20)
Sij =Sij·
{UT(W◦R)V}ij
{UT[W◦(U SVT)]V}ij (21)
Assume k, l min(m, n), the time complexities of
updatingU,V, andSin each iteration are allO(mn(k+
l)). Therefore, the time complexity of Cluster-NMF in each iteration isO(mn(k+l)).
The convergence analysis of the update formulas is presented in AppendixA.
4
EAI
European Alliance for InnovationEAI Endorsed Transactions on
"VUPNBUFE%JNFOTJPO%FUFSNJOBUJPOGPS/.'CBTFE*ODSFNFOUBM$PMMBCPSBUJWF'JMUFSJOH
Clustering the Auxiliary Information. In Eq. (7), the clustering membership indicator matrices are used as the constraints to perform the supervised learning. This requires the auxiliary information to be clustered beforehand. In [18], Su et al. proposed a nearest neighborhood based incremental clustering algorithm that can directly work on categorical data. We follow their algorithm and make some modifications so that it can be integrated into Cluster-NMF as the fundamental clustering technique.
Algorithm 1 depicts the steps to build the initial clusters for the existing feature matrices FU and FI. It is worth mentioning that since this algorithm takes categorical data as input, for each attribute, we store all possible values in one column. For example, a user vector (a row in FU) contains 3 attributes (columns), gender, age, and occupation. Each column has a different number of possible values, e.g., gender has two possible values: male and female. Same format applies toFI.
Detailed Algorithm. The whole process of performing Cluster-NMF, the non-incremental version of iCluster-NMF, on a rating matrix is illustrated in Algorithm2. In this algorithm, an extra stop criterion, the maximum iteration count, is set to terminate the program at a reasonable point. In collaborative filtering applications, this value varies from 10 to 100 and can generally produce satisfactory results.
4.2. iCluster-NMF
When new rows/columns are available, they are imputed by iCluster-NMF with the aid of U , S, V , CU, andCI generated by Algorithm2.
Technically, iNMF is identical to Cluster-NMF, but focuses on a series of new rows or columns. Meanwhile, when new feature data ∆FU and ∆FI arrive, they need to be clustered into existing clusters, otherwise new clusters are created. Eq. (7) indicates the relationship between the dimensions of U and CU,V andCI. This means that once the clusters are updated, NMF must be completely recomputed.
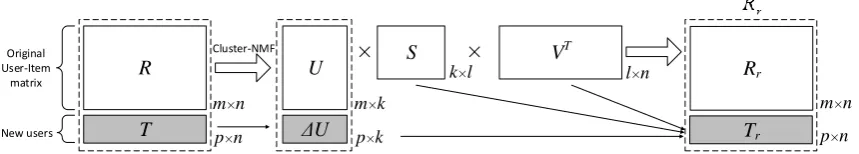
In Eq. (1), we see thatT ∈Rp×nis added toRas a few
rows. This process is illustrated in Figure1. Like Section
4.1, the objective function is developed by
min∆U≥0f(T , WT,∆U , S, V ,∆CU) =
α· kWT ◦(T −∆U SVT)k2
F+β· k∆U−∆CUk2F. (22)
Accordingly, the update formula for this objective function is obtained as follows
∆Uij=∆Uij·
{α(WT ◦T)V ST +β∆CU}ij
{α[WT ◦(∆U SVT)]V ST +β∆U}ij. (23)
Since the row update only works on new rows, the time complexity of the algorithm in each iteration is
Algorithm 1Initial Cluster Builder Input:
Object feature matrix:D ∈Rm×f, where there arem
objects andf attributes;
Maximum number of clusters:maxK; Initial radius threshold:s;
Radius decreasing step:ds; Empty cluster collection:CS; Initial cluster feature:CF. Output:
Updated radius threshold:s0; Updated cluster collection:CS0; Updated cluster feature:CF0;
1: SetCS0to empty andmaxScoreto 0; 2: fornumK= 1to maxKdo
3: ResetD,s,CS, andCF; 4: whileDis not emptydo 5: Read a new objectOfromD; 6: ifCS is emptythen
7: Create a cluster withOand place it intoCS;
8: else
9: Calculate the distance between O and each cluster in CS and find out the smallest distanceminDisoc;
10: if minDisoc< sthen
11: Insert O into the nearest cluster and
updateCF;
12: else
13: Create a cluster with O and place it into CS;
14: end if 15: end if
16: if|CS|> numK then
17: Calculate the distance between any two
clusters and merge the two clusters with the minimum distanceminDiscc;
18: ifminDiscc> sthens=minDiscc;
19: end if 20: end while
21: if|CS|< numK thens=s−ds; Goto3;
22: Calculate the inter-cluster distance and inner-cluster distance to obtain the inner-clustering score
lScore.
23: if lScore > mScore then mScore=lScore; CS0= CS;CF0
=CF;s0
=s; 24: end for
O(pn(l+k) +pkl). Assume k, l min(p, n), the time
complexity is then simplified toO(pn(l+k)).
The column update is almost identical to the row update. When the new data G∈Rm×q arrives, it is
updated according to Eq. (24). The time complexity for
5
EAI
European Alliance for InnovationEAI Endorsed Transactions on
R Original
User-Item
matrix U
S VT
×
×
Cluster-NMF
T
New users ΔU
Rr
m×n
p×n
m×k
p×k
k×l l×n
m×n
Tr p×n
Figure 1. Updating new rows in iCluster-NMF
Algorithm 2Cluster-NMF Input:
User-Item rating matrix:R∈Rm×n;
User feature matrix:FU∈Rm×kU; Item feature matrix:FI ∈Rn×kI;
Coefficients in objective function:α,β, andγ; Number of maximum iterations:MaxIter. Output:
Factor matrices:U ∈Rm+×k,S ∈R+k×l,V ∈Rn+×l;
User cluster membership indicator matrix: CU∈ Rm×k;
Item cluster membership indicator matrix: CI ∈ Rn×l;
1: Cluster users based onFUby Algorithm1→CU;
2: Cluster items based onFI by Algorithm1→CI;
3: InitializeU,S, andV with random values; 4: Build weight matrixW by Eq. (4);
5: Setiteration= 1 andstop=f alse;
6: while (iteration <=MaxIter) and (stop==f alse) do
7: Uij←Uij·
{α(W◦R)V ST+βC U}ij
{α[W◦(U SVT)]V ST+βU}ij;
8: Vij ←Vij·
{α(W◦R)TU S+γC I}ij
{α[W◦(U SVT)]TU S+γV}ij;
9: Sij←Sij·
{UT(W◦R)V}ij {UT[W◦(U SVT)]V}ij; 10: L←α· kW◦(R−U SVT)k2
F+β· kU −CUk2F+γ·
kV−CIk2
F;
11: if(Lincreases in this iteration)then 12: stop=true;
13: Restore U, S, and V to their values in last iteration.
14: end if
15: iteration=iteration+ 1; 16: end while
the column update isO(qm(l+k)).
∆Vij =∆Vij·
[α(WG◦G)TU S+γ∆CI]ij
{α[WG◦(U S∆VT)]TU S+γ∆V}ij (24)
Algorithm 3Incremental clustering algorithm Input:
Object feature matrix:∆D ∈Rm×f, where there are
mobjects andf attributes;
Maximum number of clusters:maxK; Radius threshold:s0;
Cluster collection:CS0; Cluster feature:CF0. Output:
Updated radius threshold:s00; Updated cluster collection:CS00; Updated cluster feature:CF00;
1: while∆Dis not emptydo 2: Read a new objectOfrom∆D;
3: Calculate the distance between O and each cluster inCS0
and find out the smallest distance
minDisoc;
4: if minDisoc< s
0 then
5: Insert O into the nearest cluster and update
CF0; 6: else
7: Create a cluster withOand place it intoCS0; 8: end if
9: if|CS0|> maxKthen
10: Calculate the distance between any two clusters and merge the two clusters with the minimum distanceminDiscc;
11: ifminDiscc> s0thens00=minDiscc;
12: end if 13: end while 14: CF00
=CF0
;CS00
=CS0
;s00
=s0
;
5. A Comparison Model: kMeans-NMF
In the previous section, we introduced iCluster-NMF that utilizes the incremental clustering algorithm to obtain and update user clusters and item clusters. The cluster quantities can change when new data arrives. This would also affects the matrix dimensions in the NMF update. To study how this automated procedure performs differently from a user-controlled clustering based NMF data update, we propose a comparison model, named kMeans-NMF.
6
EAI
European Alliance for InnovationEAI Endorsed Transactions on
The model uses the K-Means algorithm instead of Algorithms 1 and 3 to cluster the users and items. It is shown in Eq. (7) that the dimensionality of U are equal to the dimensionality ofCU whileV andCI have the same dimensionalities. It requires the number of user clusterskand the number of item clustersl to be predetermined. To do so, the data owner has to run the K-Means algorithm multiple times and find out the best values forkandl. The cluster quantities do not change in the whole process. Therefore, the dimensions of the factor matrices remain the same during the update.
When new users’ and items’ feature data becomes available, K-Means calculates the distance between each new object and the existing cluster centroids so the closest cluster is identified. The new object is then added to this cluster and the centroid is updated.
In general, kMeans-NMF is identical to iCluster-NMF but has a different clustering algorithm as well as no re-computation for NMF.
6. Experimental Study
6.1. Data Description
In the experiments, we adopt the MovieLens [17], Sushi [10], and LibimSeTi [2] datasets as the test data. Table1
collects the statistics of the datasets.
Table 1. Statistics of the data
Dataset #users #items #ratings Sparsity MovieLens 943 1,682 100,000 93.7%
Sushi 5,000 100 50,000 90%
LibimSeTi 2,000 5,625 129,281 98.85%
The public MovieLens dataset has 3 subsets, 100K(100,000 ratings), 1M(1,000,000 ratings) and 10M(10,000,000 ratings). The first dataset, which is adopted in the experiments, has 943 users and 1,682 items. The 100,000 ratings, ranging from 1 to 5, were divided into two parts: the training set with 80,000 ratings and the test set with 20,000 ratings. In addition to rating data, user demographic information and item genre information are also available.
The Sushi dataset describes users’ preferences on different kinds of sushi. There are 5,000 users and 100 sushi items. Each user has rated 10 items, with a rating ranging from 1 to 5. That is to say, there are 50,000 ratings in this dataset. To build the test set and the training set, for every user, 2 out of 10 ratings were randomly selected and were inserted into the test set (10,000 ratings) while the rest of ratings were used as the training set (40,000 ratings). Similar to MovieLens, the Sushi dataset comes with user demographic information as well as item group information and some attributes, e.g., the heaviness/oiliness in taste and how frequently the user eats the sushi.
The LibimSeTi dating dataset was gathered by LibimSeTi.cz, an online dating website. It contains 17,359,346 anonymous ratings of 168,791 profiles made by 135,359 users as dumped on April 4, 2006. However, only the user’s gender is provided with the data. Later sections will show how to resolve this problem with the lack of item information. Confined to the memory limit of the test computer, the experiments only used 2,000 users and 5,625 items1with 108,281 ratings in the training set and 21,000 ratings in the test set. Ratings are on a 1∼10 scale where 10 is best.
6.2. Data Pre-processing
Because iCluster-NMF and kMeans-NMF require dif-ferent feature data formats (numerical vs categorical), the data fed to them should be processed in diff er-ent ways. In the MovieLens dataset, user demographic information includes user ID, age, gender, occupation, and zip code. Among them, we utilized age, gender, and occupation as features. For ages, the numbers were categorized into 7 groups: 1-17, 18-24, 25-34, 35-44, 45-49, 50-55,>=56. For gender, there are two possible values: male and female. According to the statistics, there are 21 occupations: administrator, artist, doctor, and so on. For iCluster-NMF, since it directly works on categorical data, we built the user feature matrix
FU with 3 attributes (kU = 3). They correspond to gen-der (2 possible values), age (7 possible values), and occupation (21 possible values), respectively. In con-trast, for kMeans-NMF, the categories were converted to numbers since K-Means algorithm only works on numerical data. The user feature matrix FU was built with 30 attributes (kU = 30); each user was represented as a row vector with 30 elements. An element will be set to 1 if the corresponding attribute value is true for this user and 0 otherwise. Similar with the user feature matrix, the item feature matrix was built in terms of their genres. Movies in this dataset were attributed to 19 genres and hence the item feature matrix FI has 6 attributes for iCluster-NMF (kI = 6 as a single movie could have up to 6 genres) and 19 attributes for kMeans-NMF (kI = 19).
In the Sushi dataset, eight of the user demographic attributes were used: gender, age, city in which the user has lived the longest until age 15 (plus region and east/west). Additionally, the city (plus region and east/west) in which the user currently lives was also used. In this case, users’ age was categorized into six groups by the data provider: 15-19, 20-29, 30-39, 40-49, 50-59,>=60. User gender consists of male and female, which is the same as MovieLens. There are 48 cities (Tokyo, Hiroshima, Osaka, etc.), 12 regions (Hokkaido,
1User profiles are considered as items for this dataset
7
EAI
European Alliance for InnovationEAI Endorsed Transactions on
Tohoku, Hokuriku, etc.) and 2 possible east/west values (either the eastern or western part of Japan). Thus, the user feature matrix for iCluster-NMF on this dataset has 5,000 rows and 8 columns. Nevertheless, since there are too many possible values (2 + 6 + (48 + 12 + 2)×2 =
132 values) for all attributes, only gender and age were used to build the user feature matrix for kMeans-NMF. This makes the matrix have 5,000 rows and 8 columns (2 genders plus 6 age groups). The item feature matrix, on the other hand, has 100 rows and 3 columns for iCluster-NMF (16 columns for kMeans-NMF) since there are 2 styles, 2 major groups, and 12 minor groups. Since the LibimSeTi dataset only provides the user gender information, it was simply used as the user cluster indicator matrix CU. Note that in this dataset, there are three possible gender values: male, female, and unknown. To be consistent, the number of user clusters is set to 1 for iCluster-NMF and 3 for kMeans-NMF.
6.3. Evaluation Strategy
To evaluate the algorithms, the error of unknown value prediction and the time cost were measured. Besides iCluster-NMF and kMeans-NMF, a naive Cluster-NMF was exploited as the benchmark in the experiments for comparisons. Two SVD based collaborative filtering algorithms were studied as well.
Naive Cluster-NMF: The Benchmark Model. The general idea of the naive Cluster-NMF is quite close to iCluster-NMF. The only difference is the way of updating the clusters. In iCluster-NMF, we use Alogrthim 1 to build the initial clusters which are then updated by Algorithm 3. In contrast, the naive Cluster-NMF does not use incremental clustering but simply uses the idea of Alogrthim 1 to cluster the existing objects to the fixed number of clusters and re-cluster them (to the fixed number of clusters as well) when new data is available. In other words, FU0 in Eq. (1) andFI0 in Eq. (2) are re-clustered every time there is an update on the data. This will significantly lower the performance of the algorithm but it theoretically produces the most accurate result among all.
The SVD Based Comparison Models. In order to demonstrate how much improvement our algorithms have achieved, they were compared to two SVD based collaborative filtering algorithms and the performance was evaluated. In [1], Brand proposed a recommender system that leveraged the probabilistic imputation to fill the missing values in the incomplete rating matrix and then used the incremental SVD to update the imputed rating matrix. This makes SVD work seamlessly for CF purposes. We denote this algorithm as iSVD. The SVD based method that was proposed by Wang and Zhang [20] is similar to [1] but
has additional processing steps to ensure privacy protection. Additionally, it uses mean value imputation instead of the probabilistic imputation to remove missing values. We denote this algorithm as pSVD. It is worth mentioning that neither of them considers auxiliary information so only the rating matrix is used.
Evaluation Measures and Experiment Procedure. The experiments measured the prediction error and the time cost on three proposed algorithms as well as iSVD and pSVD. The prediction error was measured by calculating the difference between the actual ratings in the test set and the predicted ratings. A common and popular criterion is the mean absolute error (MAE), which can be calculated as follows:
MAE= | 1
T estSet|
X
rij∈T estSet
|rij−pij| (25)
wherepijis the predicted rating.
When building the starting matrixR, the split ratio was used to decide how many ratings would to be removed from the whole training data. For example, there are 1,000 users and 500 items with their ratings in the training data. If the split ratio is 40% and a row update will be done, we use the first 400 rows as the starting matrix (R∈R400×500). The remaining 600 rows
of the training matrix will be added to R in several rounds. Similarly, if a column update will be performed, we use the first 200 columns as the starting matrix (R∈R1000×200) while the remaining 300 columns will
be added toRin several rounds.
In each round, 100 rows/columns were added to the starting matrix. If the number of the rows/columns of new data is not divisible by 100, the last round will update the rest. Therefore, in this example, the remaining 600 rows will be added toRin 6 rounds with 100 rows each. Note that the Sushi data set only has 100 items in total but we still want to test the column update on it so 10 items were added instead of 100 in each round.
The basic procedure of the experiments is as follows:
1. Perform Algorithm1and Algorithm2onR;
2. Append the new data to R by iCluster-NMF, kMeans-NMF, and naive Cluster-NMF (nCluster-NMF for short), yielding the updated rating matrix ˜Rr;
3. Measure the prediction errors and the time costs of the updates;
4. Compare and study the results.
The machine we used was equipped with Intel® Core™i5-2405S processor, 8GB RAM and was installed with UNIX operating system. We wrote and ran the code in MATLAB.
8
EAI
European Alliance for InnovationEAI Endorsed Transactions on
6.4. Results and Discussion
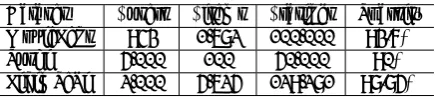
Parameter Setup. The parameters that have to be determined by kMeans-NMF are listed in Table 2, wherekis the column dimension of matrixU andl is the column dimension ofV.
Table 2. Parameter setup for kMeans-NMF
Dataset α β γ k l MaxIter
MovieLens 0.2 0 0.8 7 7 10
Sushi 0.4 0.6 0 7 5 10
LibimSeTi 1 0 0 3 10 10
For the MovieLens dataset, we set α= 0.2, β= 0, and γ = 0.8, which means that the prediction relied mostly on the item cluster matrix, and then the rating matrix, whereas eliminated the user cluster matrix. This combination was selected after probing many possible cases. Both k and l are set to 7 because K-Means was prone to generate empty clusters with greater k and
l, especially on the data with very few users or items. It is worth mentioning that if β or γ is a non-zero value, the user or item cluster matrix will be used and
k orl is equal to the number of user clusters or item clusters. As long as β or γ is zero, the algorithm will eliminate the corresponding cluster matrix andk orl
will be unrelated to the number of user clusters or item clusters.
For the Sushi dataset, we setα = 0.4,β= 0.6, andγ= 0. The parameters indicate that the user cluster matrix played the most critical role during the update process. In contrast, rating matrix was the second important factor as it indicates the user preference on items. The item cluster matrix seems trivial so it did not participate in the computation. We setkto 7 andlto 5 based on the same reason as mentioned in the previous paragraph.
For the LibimSeTi dataset, full weight was given to the rating matrix. The user and item cluster matrices received zero weight since they did not contribute anything to the positive results. As mentioned in the data description, users’ auxiliary information only includes the gender with three possible values. So k
was set to 3. In this case, l only denotes the column dimension ofV and was set to 10.
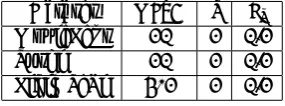
Table 3. Parameter setup for iCluster-NMF and nCluster-NMF
Dataset maxK s ds
MovieLens 10 1 0.1
Sushi 10 1 0.1
LibimSeTi 3/1 1 0.1
The iCluster-NMF and nCluster-NMF are in general the same as kMeans-NMF but with different clustering approaches and NMF re-computation strategies. In Algorithm1, the maximum number of clusters maxK,
the initial radius thresholds, and the radius decreasing stepdsmust be determined in advance. Table3gives the parameter setup for iCluster-NMF and nCluster-NMF. Note that the LibimSeTi dataset hasmaxK= 3 for user clusters andmaxK= 1 for item clusters.
As far as iSVD and pSVD, the only parameter involved is the rank of the singular matrix. To determine this value, both algorithms were run for multiple times with different ranks. We selected the numbers that achieved the optimal outcomes. The best ranks for the MovieLens, the Sushi, and the LibimSeti datasets are 13, 7, and 10, respectively.
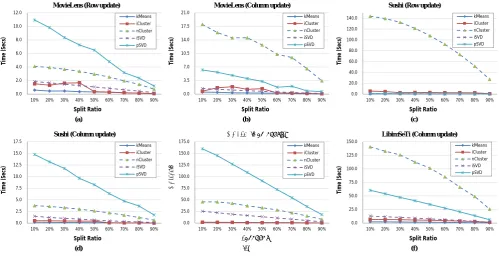
Experimental Results. Figure2 shows the time cost for updating new rows and columns by kMeans-NMF, iCluster-NMF, nCluster-NMF, as well as iSVD and pSVD. In most cases, nCluster-NMF and pSVD took significantly longer time than others. This is because nCluster-NMF was used to probe all possible cluster quantities to find out the choices that achieve the best MAE’s. That is to say, it tries to cluster users into k groups and items into l groups, where k, l=
{1,2, ...,10}, which results in 100 combinations. In
addition, nCluster-NMF needs to re-cluster the whole data every time the new portion arrives. This requires even more time. As for pSVD, since it uses the mean value of each column to impute all missing values in that column, when a large amount of data is involved in the update (e.g. the row update on MovieLens and the column update on Sushi), the time cost can be high. The performance of iSVD is not as sensitive as pSVD to the data size but it also suffers from high matrix dimensionality, as shown in Figure2(e).
Comparing kMeans-NMF and iCluster-NMF, it can be seen that their time costs were close in the process, though the former was slightly faster than the latter. This is because iCluster-NMF not only updates the clusters’ content as kMeans-NMF does, but also combines existing clusters or creates new clusters when necessary. The cluster update itself does not cost more time but since the number of clusters changes in some cases, the NMF has to be recomputed, which requires additional time.
As a reference, Table 4 lists the optimal number of clusters on the Sushi dataset. Note that the split ratio determines how many rows or columns should be present in the starting matrix. iCluster-NMF first runs Algorithm1onRto find the optimal number of clusters for users and items. Then they will be updated when new data is added toR. The numbers shown in this table are the final cluster quantities. When the rows were being updated, the model kept the columns unchanged and vice versa. This is why the number of item clusters remained the same when performing the row update and the number of user clusters remained the same when performing the column update. From the table,
9
EAI
European Alliance for InnovationEAI Endorsed Transactions on
0.0 2.0 4.0 6.0 8.0 10.0 12.0
10% 20% 30% 40% 50% 60% 70% 80% 90%
Ti m e (S ec s) kMeans iCluster nCluster iSVD pSVD Split Ratio
MovieLens (Row update)
(a) 0.0 3.5 7.0 10.5 14.0 17.5 21.0
10% 20% 30% 40% 50% 60% 70% 80% 90%
Ti m e (S ec s) kMeans iCluster nCluster iSVD pSVD Split Ratio
MovieLens (Column update)
(b) 0.0 20.0 40.0 60.0 80.0 100.0 120.0 140.0
10% 20% 30% 40% 50% 60% 70% 80% 90%
Ti m e (S ec s) kMeans iCluster nCluster iSVD pSVD Split Ratio
Sushi (Row update)
(c) 0.0 2.5 5.0 7.5 10.0 12.5 15.0 17.5
10% 20% 30% 40% 50% 60% 70% 80% 90%
Ti me (S ec s) kMeans iCluster nCluster iSVD pSVD Split Ratio
Sushi (Column update)
(d) 0.0 25.0 50.0 75.0 100.0 125.0 150.0 175.0
10% 20% 30% 40% 50% 60% 70% 80% 90%
Ti m e (S ec s) kMeans iCluster nCluster iSVD pSVD Split Ratio
LibimSeTi (Row update)
(e) 0.0 25.0 50.0 75.0 100.0 125.0 150.0
10% 20% 30% 40% 50% 60% 70% 80% 90%
Ti m e (S ec s) kMeans iCluster nCluster iSVD pSVD Split Ratio
LibimSeTi (Column update)
(f)
Figure 2. Time cost variation with split ratio
Table 4. Optimal number of clusters on the Sushi dataset
Split Ratio 10% 20% 30% 40% 50% 60% 70% 80% 90%
iCluster-NMF (Row) #UserClusters 10 10 10 10 10 10 9 10 8
#ItemClusters 10 10 10 10 10 10 10 10 10
iCluster-NMF (Column) #UserClusters 5 5 5 5 5 5 5 5 5
#ItemClusters 5 5 5 5 4 4 7 9 10
nCluster-NMF (Row) #UserClusters#ItemClusters 77 77 77 77 77 77 77 77 77
nCluster-NMF (Column) #UserClusters 6 6 6 6 6 6 6 6 6
#ItemClusters 10 10 10 10 10 10 10 10 10
one can see that the best combinations obtained by nClsuter-NMF were 7 user clusters / 7 item clusters for the row update and 6 user clusters / 10 item clusters for the column update. Although the numbers are different from the ones obtained by iCluster-NMF, their MAE’s are nearly the same.
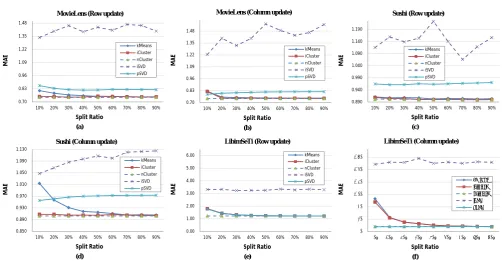
The mean absolute errors of the prediction are plotted in Figure 3. iSVD performed worst on all datasets while nCluster-NMF reached the best results in most cases. Due to the way that nCluster-NMF works, the MAE’s were consistently at the same level. They did not change significantly with varying split ratios. The only exception was the row update on the Sushi dataset, where iCluster-NMF achieved lower MAE than nCluster-NMF when the split ratio became higher. This to some extent means that updating the number of clusters in iCluster-NMF benefited the lower global prediction error. The figures show that iCluster-NMF outperformed kMeans-NMF on all three datasets. It
is interesting to look at the errors of pSVD, which were very close to iCluster-NMF on LibimSeTi but were worse on other datasets. Remember that we mentioned in Section 6.1, LibimSeTi only provides user gender information. In other words, our proposed models did not really receive any extra helpful information from this dataset. Thus, its prediction accuracy was almost identical to pSVD’s, which does not utilize auxiliary information at all.
We attribute the promising results to not only the incremental clustering but also the recomputation of NMF. On one hand, clusters are updated when the new data comes in. This strategy ensures that the cluster membership indicator matrices CU and CI in Eq. (7) always maintain up-to-date relationships between either rows or columns. This, in turn, benefits the NMF update. On the other hand, due to the accumulated error in the incremental update, NMF needs to be recomputed to maintain the accuracy. It
10
EAI
European Alliance for InnovationEAI Endorsed Transactions on
0.70 0.83 0.96 1.09 1.22 1.35 1.48
10% 20% 30% 40% 50% 60% 70% 80% 90%
M
AE
kMeans iCluster nCluster iSVD pSVD
Split Ratio
MovieLens (Row update)
(a)
0.70 0.83 0.96 1.09 1.22 1.35 1.48
10% 20% 30% 40% 50% 60% 70% 80% 90%
M
AE
kMeans iCluster nCluster iSVD pSVD
Split Ratio
MovieLens (Column update)
(b)
0.890 0.940 0.990 1.040 1.090 1.140 1.190
10% 20% 30% 40% 50% 60% 70% 80% 90%
M
AE
kMeans iCluster nCluster iSVD pSVD
Split Ratio
Sushi (Row update)
(c)
0.850 0.890 0.930 0.970 1.010 1.050 1.090 1.130
10% 20% 30% 40% 50% 60% 70% 80% 90%
M
AE
kMeans iCluster nCluster iSVD pSVD
Split Ratio
Sushi (Column update)
(d)
0.00 1.00 2.00 3.00 4.00 5.00 6.00
10% 20% 30% 40% 50% 60% 70% 80% 90%
M
AE
kMeans iCluster nCluster iSVD pSVD
Split Ratio
LibimSeTi (Row update)
(e)
1.10 1.40 1.70 2.00 2.30 2.60 2.90
10% 20% 30% 40% 50% 60% 70% 80% 90%
M
AE
kMeans iCluster nCluster iSVD pSVD
Split Ratio
LibimSeTi (Column update)
(f)
Figure 3. MAE variation with split ratio
is not convenient for the data owner to determine when to perform the recomputation and update the dimensions of the factor matrices. In this situation, iCluster-NMF recomputes NMF when the number of clusters change. It also explains why the MAE’s of kMeans-NMF and iCluster-NMF tend to be close when the split ratios become higher —since kMeans-NMF does not recompute NMF, the more data it starts with, the less accumulated update error it has. Nevertheless, with more data available, the error will inevitably become larger.
As a summary, the iCluster-NMF data update algorithm produced higher prediction accuracy while costing just a little more time, if not the same as kMeans-NMF did. More importantly, the former does not need the data owner to determine the number of user and item clusters and can recompute the NMF when necessary. Once useful auxiliary information became available, both algorithms outperformed the incremental SVD based algorithms with respect to the prediction accuracy. The results are encouraging.
7. Conclusion and Future Work
In this paper, we propose an NMF based data update approach with automated dimension determination for collaborative filtering purposes. It integrates the incremental clustering technique into the NMF based data update algorithm. This approach utilizes the auxiliary information to build the cluster membership indicator matrices of users and items. These matrices
are regarded as the constraints in updating the weighted nonnegative matrix tri-factorization. The proposed approach, named iCluster-NMF, does not require the data owner to determine when to recompute the NMF and the dimensions of the factor matrices. Instead, it sets the dimensions of the factor matrices according to the clustering result on users and items and updates it automatically. Experiments conducted on three different datasets demonstrate the high accuracy and performance of iCluster-NMF.
In the real world, when people are shopping online, the factors that affect their decisions are not quite unique. In collaborative filtering research, most literatures focus on the correlations between users and items. This is apparently one of the most consequential factors but there are also some others. In future work, we will take into account more related auxiliary information, such as social networks, to achieve better prediction accuracy. We will also make use of the group preference to provide privacy preserving product recommendations.
Appendix A. Convergence Analysis for
Cluster-NMF Update Formulas
We follow [13] to prove that the objective function
L=f(R, W , U , S, V , CU, CI) is nonincreasing under the update formulas (19), (20), and (21).
11
EAI
European Alliance for InnovationEAI Endorsed Transactions on
Definition 1.H(u, u0) is an auxiliary function forF(u) if the conditions
H(u, u0)≥F(u), H(u, u) =F(u) (A.1)
are satisfied.
Lemma 1.If H is an auxiliary function for F, then F is nonincreasing under the update
ut+1= argmin
u H
(u, ut) (A.2)
Lemma1can be easily proved since we haveF(ut+1) =
H(ut+1, ut+1)≤H(ut+1, ut)≤H(ut, ut) =F(ut).
We will prove the convergences of the update formulas (19), (20), and (21) by showing that they are equivalent to Eq. (A.2), with proper auxiliary functions defined.
Let us rewrite the objective functionL,
L=tr{α(W◦R)T ·(W ◦R)}
+tr{−2α(W◦R)T ·[W ◦(U SVT)]}
+tr{α[W ◦(U SVT)]T ·[W ◦(U SVT)]}
+tr(βUTU) +tr(−2βUTCU) +tr(βCT
UCU) +tr(γVTV) +tr(−2γVTCI) +tr(γCT
I CI)
(A.3)
wheretr(∗) is the trace of a matrix.
Eliminating the irrelevant terms, we define the following functions that are only related toU,V, and
S, respectively.
L(U) =tr{−2α(W◦R)T ·[W◦(U SVT)]
+α[W ◦(U SVT)]T ·[W ◦(U SVT)]
+βUTU −2βUTCU}
=tr{−2[α(W◦R)V ST +βCU]UT
+UT[αW ◦(U SVT)V ST] +UT(βU)}
(A.4)
L(V) =tr{−2α(W◦R)T ·[W◦(U SVT)]
+α[W◦(U SVT)]T ·[W◦(U SVT)]
+γVTV−2γVTCI}
=tr{−2[α(W◦R)TU S+γCI]VT
+VT[α(W◦(U SVT))TU S] +VT(γV)}
(A.5)
L(S) =tr{−2α(W◦R)T ·[W◦(U SVT)]
+α[W◦(U SVT)]T ·[W◦(U SVT)]}
=tr{[−2αUT(W◦R)V]ST
+ [αUT(W ◦(U SVT))V]ST}
(A.6)
Lemma 2.For any matricesX∈Rn×n
+ ,Y ∈Rk ×k
+ ,F∈Rn ×k
+ , F0 ∈Rn+×k, and X, Y are symmetric, the following
inequality holds
n
X
i=1
k
X
j=1
(XF0Y)ijFij2
Fij0 ≥tr(F
TXFY) (A.7)
The proof of Lemma2is presented in [5]. We use this lemma to build an auxiliary function for L(U). Since
L(V) and L(S) are similar toL(U), their convergences are not necessary to be discussed.
Lemma 3.
H(U , U0) =−2X
ij
{[α(W◦R)V ST +βCU]UT}ij
+X
ij
{αW◦(U0SVT)V ST +βU0}ijU2
ij
Uij0
(A.8)
is an auxiliary function ofL(U) and the global minimum ofH(U , U0) can be achieved by
Uij =U
0
ij·
{α(W◦R)V ST +βCU}ij {α[W◦(U0SVT)]V ST +βU0}
ij
(A.9)
Proof. We need to prove two conditions as specified in Definition 1. It is apparent that H(U , U) =L(U). According to Lemma2, we have
X
ij
{αW◦(U0SVT)V ST +βU0}ijU2
ij
Uij0
=X
ij
{αW ◦(U0SVT)V ST}ijU2
ij
Uij0 +
X
ij
{βU0}ijU2
ij
Uij0
≥tr{UT[αW◦(U SVT)V ST]}+tr{UT(βU)}.
(A.10)
Therefore, H(U , U0
)≥L(U). Thus H(U , U0
) is an auxiliary function ofL(U).
To find the global minimum of H(U , U0) with U0
fixed, we take the derivative of H(U , U0) with respect toUij and let it be zero:
∂H(U , U0)
∂Uij
={−2[α(W◦R)V ST +βCU]}ij
+ 2
{αW◦(U0SVT)V ST +βU0}ijUij
Uij0 = 0
(A.11)
Solving forUij, we have
Uij=U
0
ij·
{α(W◦R)V ST +βCU}ij {α[W ◦(U0
SVT)]V ST +βU0}
ij
(A.12)
Since F(U0) =H(U0, U0)≥H(U1, U0)≥F(U1)≥...,
F(U) is monotonically decreasing and updating U by Eq. (A.12) can reach the global minimum.
Similarly, the convergences of update formulas (20) and (21) can be proved as well.
12
EAI
European Alliance for InnovationEAI Endorsed Transactions on
References
[1] Brand, M. (2003) Fast Online SVD Revisions for
Lightweight Recommender Systems. In Proceedings of SIAM International Conference on Data Mining(SIAM).
[2] Brozovsky, L. and Petricek, V. (2007) Recommender
System for Online Dating Service. In Proceedings of Znalosti 2007 Conference(VSB).
[3] Chen, G.,Wang, F.andZhang, C.(2007) Collaborative
Filtering Using Orthogonal Nonnegative Matrix Tri-factorization. InProceedings of the 7th IEEE International Conference on Data Mining Workshops(IEEE): 303–308. [4] Chen, T., Zhang, W., Lu, Q.,Chen, K., Zheng, Z.and
Yu, Y.(2012) SVDFeature: A Toolkit for Feature-based
Collaborative Filtering. Journal of Machine Learning Research13: 3619–3622.
[5] Ding, C.,Li, T.,Peng, W.andPark, H.(2006) Orthogonal
Nonnegative Matrix Tri-Factorizations for Clustering. In Proceedings of the 12th ACM SIGKDD International Conference on Knowledge Discovery and Data Mining (ACM): 126–135.
[6] Gu, Q., Zhou, J. and Ding, C. (2010) Collaborative
Filtering: Weighted Nonnegative Matrix Factorization Incorporating User and Item Graphs. InProceedings of the 7th IEEE International Conference on Data Mining Workshops(SIAM): 199–210.
[7] Huang, Z.(1997) A Fast Clustering Algorithm to Cluster
Very Large Categorical Data Sets in Data Mining. In Research Issues on Data Mining and Knowledge Discovery: 1–8.
[8] Huang, Z., Deng, S. and Xu, X. (2005) Improving
K-modes Algorithm Considering Frequencies of Attribute Values in Mode3801: 157–162.
[9] Kabir, S.M.A.,Youssef, A.M.andElhakeem, A.K.(2007)
On Data Distortion for Privacy Preserving Data Mining. In Proceedings of Canadian Conference on Electrical and Computer Engineering(IEEE): 308 – 311.
[10] Kamishima, T.andAkaho, S.(2006) Efficient Clustering
for Orders. In Proceedings of the 2nd International Workshop on Mining Complex Data: 274–278.
[11] Kim, J.andPark, H. (2008) Sparse Nonnegative Matrix
Factorization for Clustering. Tech. rep., Georgia Institute of Technology.
[12] Kuhn, H. and Tucker, A. (1951) Nonlinear
Program-ming. InProceedings of the 2nd Berkeley Symposium on Mathematical Statistics and Probability: 481–492.
[13] Lee, D.D. and Seung, H.S. (2001) Algorithms for
Non-negative Matrix Factorization. Advances in Neural Information Processing Systems13: 556–562.
[14] MacQueen, J.B.(1967) Some Methods for Classification
and Analysis of Multivariate Observations. In Proceed-ings of the 5th Berkeley Symposium on Mathematical Statis-tics and Probability, 1: 281–297.
[15] Pauca, V.P., Shahnaz, F., Berry, M.W. andPlemmons,
R.J.(2004) Text Mining Using Nonnegative Matrix
Fac-torizations. InProceedings of the 2004 SIAM Interational Conference on Data Mining(SIAM), 54: 452–456. [16] Resnick, P.,Iacovou, N.,Suchak, M.,Bergstrom, P.and
Riedl, J.(1994) GroupLens: An Open Architecture for
Collaborative Filtering of Netnews. InProceedings of the 1994 ACM Conference on Computer Supported Cooperative Work(ACM): 175–186.
[17] Sarwar, B.M., Karypis, G., Konstan, J.A. and Riedl,
J.T.(2000) Application of Dimensionality Reduction in
Recommender Systems – A Case Study. InProceedings of ACM WebKDD Workshop(ACM).
[18] Su, X., Lan, Y., Wan, R. and Qin, Y. (2009) A Fast
Incremental Clustering Algorithm. InProceedings of the 2009 International Symposium on Information Processing: 175–178.
[19] Thapa, N.,Liu, L.,Lin, P.,Wang, J.andZhang, J.(2011)
Constrained Nonnegative Matrix Factorization for Data Privacy. InProceedings of the 7th International Conference on Data Mining: 88–93.
[20] Wang, X. and Zhang, J. (2012) SVD-based Privacy
Preserving Data Updating in Collaborative Filtering. In Proceedings of the World Congress on Engineering 2012 (IAENG): 377–284.
[21] Wang, Y.,Liao, X.,Wu, H.andWu, J.(2012) Incremental
collaborative filtering considering temporal effects. http://arxiv.org/abs/1203.5415.
[22] Xu, W., Liu, X. and Gong, Y. (2003) Document
Clustering Based on Non-negative Matrix Factorization. In Proceedings of the 26th Annual International ACM SIGIR Conference on Research and Development in Informaion Retrieval(ACM): 267–273.
[23] Zhang, S., Wang, W., Ford, J.andMakedon, F. (2006)
Learning from Incomplete Ratings Using Non-negative Matrix Factorization. In Proceedings of the 6th SIAM International Conference on Data Mining (SIAM): 548– 552.
13
EAI
European Alliance for InnovationEAI Endorsed Transactions on