INTRODUCTION
The buffer zones constitute an important ele
-ment of the landscape in agricultural catch-ments. As belts of shelters and permanent grasslands, they are generally believed to protect the surface water from the runoff from arable land and grassland. In addition, recent research indicates additional en
-vironmental benefits of barriers [Mitsch and Jor
-gensen 2003]. These include regulating the impact on the climate through carbon sequestration, modi
-fying the hydrological regime and protecting bio
-diversity, both on a local and regional scale [Brian et al. 2004, Blank et al. 2011, Hefting et al. 2012]. The effectiveness of barriers in removing the biogens displaced with surface runoff and ground
-water depends on many factors, among which, first of all, the maintenance of natural vegetation and optimal humidity of coastal zone soils is indi
-cated. The barrier must be able to slow down the underground outflow in order to ensure the longest time of water contact with the soil and plant roots, then it is possible to work the physicochemical and
biological processes that lead to the reduction of pollutants: denitrification, adsorption, immobiliza
-tion by microorganisms and vascular plants [Cor
-rell 2005, Hefting et al. 2005, Liu et al. 2008]. However, more often it is pointed out that in some cases, the protective functions are assigned to the buffer zones a little too hastily. Particular doubts arise from their effectiveness in the winter half-year, which under the hydroclimatic conditions of Central and Eastern Europe is the period of the most intense chemical denudation [Banaszuk 2007]. The author’s research results indicate that in this period, a particularly active role in the move
-ment of biogenes is played by the paths of privi
-leged migration, i.e. migration corridors [Haag and Kaupenjohann 2001]. They increase the catchment area in contact with the watercourse, forming a di
-rect link between the land and water environment. Their presence makes the pollutant load bypass the most “active” element of the barrier – it is a soil environment with a large denitrification and sorp
-tive potential[Wesström et al. 2001]. This leads to the intense migration of dissolved substances into Accepted: 2018.09.15 Available online: 2018.11.01
Volume 20, Issue 1, January 2019, pages 214–219 https://doi.org/10.12911/22998993/93873
Soils of Buffer Zones as a Source of Nitrogen Compounds
Małgorzata Krasowska
11 Department of Agri-Food Engineering and Environmental Management, Faculty of Civil and Environmental
Engineering, Białystok University of Technology, ul. Wiejska 45A, 15-351 Białystok, Poland e-mail: [email protected]
ABSTRACT
A buffer zone is a belt of shelter or permanent grassland separating the agricultural land from watercourses and water reservoirs. According to the Code of Good Agricultural Practices, they constitute a landscape element that can limit the migration of biogenic substances. Increasing attention is paid to the fact that these barriers are effec
-tive during the growing season. However, in the autumn-winter and early-spring half-year, they can be a source of nitrogen compounds leached from the catchment to the surface water. In connection with this, research was under
-taken to assess the content of nitrogen compounds in the soil of the zone at the channel and water of the watercourse in a small agricultural catchment. The processes occurring in the buffer zones leading to the release of biogenic compounds do not only concern leaching them to surface and groundwater; therefore, the amount of nitrous oxide emissions, which is the result of the denitrification process occurring in the soil, was examined. On the basis of the obtained results, it was found that an increased content of nitrogen compounds in the soil of buffer zones may have an impact on the elevated emission of N2O and a raised content of these substances in surface water.
surface water. In addition, the nutrients that accu
-mulate in the bedded zone soil are released during the early spring period, resulting in a number of adverse changes in the environment.
Considering that at present agriculture must meet the requirements of environmental protec
-tion, it is necessary to analyze in detail all the proposed methods of limiting the area and point pollution, also including the greenhouse gases the emissions of which differ on a global and regional scale. However, it should be remembered that in order to mitigate the effects of emissions of vari
-ous pollutants to the environment, they must be adjusted accordingly [Wysocka-Czubaszek et al. 2018, Marcinkowski 2010].
Due to the fact that nitrogen, unused in agri
-cultural production, is dispersed into the environ
-ment and its type, the place and directions of its migration are still an open and not fully recog
-nized issue [Marcinkowski 2010]. In this work, the research is focused on the content of nitrogen compounds in the buffer zone in the agricultural catchment, which can be an element limiting the migration of pollutants. The conducted research concerned the analysis of the nitrogen content compounds in the soil their contents in the aque
-ous solution, groundwater and streamwater were analyzed, and the emission of nitrous oxide from the soil was examined as well.
MATERIALS AND METHODS
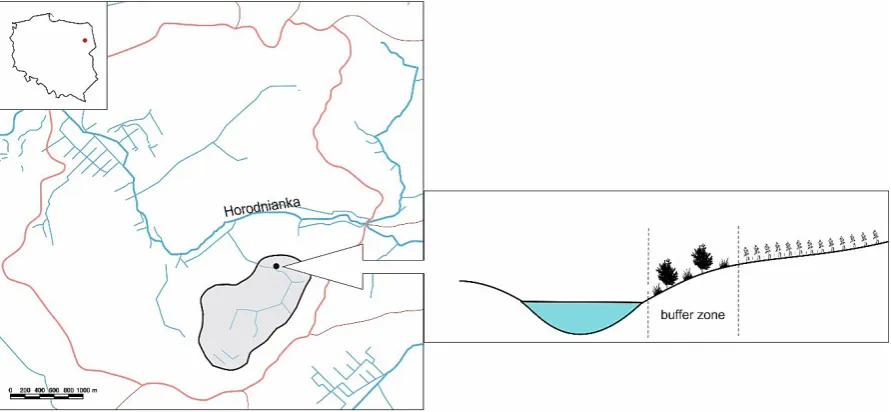
The research was carried out in the Podlaskie Voivodeship, in the catchment of a small water
-course, which is a left-bank tributary of the Horo
-dnianki river. The bottom of the watercourse val
-ley is narrow, with a width of 10 to 20 m, and the riverbed cuts into its surface to a depth of 0.8 to 1.0 m. On the considerable length of the valley, the arable fields approach the stream shores at a distance of 5 to 10 m. The test points were located in the buffer zone at a distance of about 2 m from the river bed. They were under shrubs and trees, on black soils, made of clayey sands (Figure 1).
The catchment is typically agricultural; the dominant way of land use is relatively low-inten
-sity agriculture, where arable land accounts for 75% of the area (Figure 2).
The research was carried out during the thaw
-ing period. In order to analyze the content of nitrogen compounds in the buffer zone, the soil samples were taken from a depth of about 10 cm and the soil solutions, ground water and surface water were collected from the watercourse. In the soil and water samples, the content of nitrate ions (NO3-) and ammonium ions (NH
4+) was deter
-mined, as well as total nitrogen (TN). In addition, the nitrous oxide emissions were measured using the chamber method, while the N2O concentra
-tion was determined using a gas chromatograph.
RESULTS AND DISCUSSION
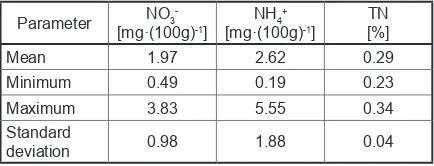
In the buffer zone, the average content of ni
-trates in the soil was 1.97 mg·(100g)-1, while the
content ammonium was about 1.5 times greater. In addition, the total nitrogen content ranged from about 0.2 to over 0.3% (Table 1). According to
Ostrowska [1991], the content of nitrate nitrogen in the top surface layer of soils in Poland ranges from 0.6 to 8.0 mg·(100g)-1, which indicates that
the analyzed soil is poor in nitrates. This could be due to the launch of surface runoff and the elution of dissolved substances to surface water and deep into the soil profile. Many authors have reported that low levels of nitrogen in the soil may be related to its leaching, which is a com
-mon phenomenon. Nitrates are susceptible to this process, which – as anions – are not adsorbed by soil colloids strongly. If the water seeps through the soil, the nitrates can leach below the root zone [Bekier-Jaworowska and Szostak 2006]. How
-ever, according to Ostrowska [1991], the aver
-age content of ammonium nitrogen in topsoil in Poland ranges from 0.5 to 1.9 mg·(100g)-1. The
average NH4+ content in the analyzed soil was
slightly higher. However, the highest value re
-corded in the buffer zone was over twice as high as the values given by Ostrowska. The elevated NH4+ content in the soil could have been caused
by the weather conditions during which the tests were carried out. The early spring period is the time of defrosting the soil, combined with thaw
-ing, but also sudden temperature drops leading to
the re-freezing of soils. Under these conditions, the ability of the soil to replace the non-exchange
-able NH4+ increases. Moreover, during this peri
-od, due to thawing, the soil moisture in the buffer zone could be high. Thus, the oxygen content was low in the top soil layer, which could lead to the intensification of many processes, including deni
-trification, which resulting in N2O emission and nitrate reduction [Turbiak et al. 2011].
However, the most easily available and transformable are the forms of nitrogen (NO3
-and NH4+) present in the soil solution. Their
content is subject to intense changes and de
-pends on the atmospheric conditions, the doses of fertilizers used and the collection by plants. The research conducted by the author showed that the dissolved substances accumulated in the catchment system in the winter period, start up in early spring and their content increases rapidly in water and soils in the basin. In the spring period, the amount of nitrogen com
-pounds increases along with the intensifica
-tion of the mineraliza-tion process of organic matter. Plants that are still at rest do not take dissolved compounds, which makes the sub
-stances to move to the surface and ground wa
-ter and results in increased N2O emission. This is particularly visible in the buffer zones, where the thawing of soils occurs as quickly as pos
-sible and where surface runoff drains rich water into dissolved substances washed out from the catchment system [Pionke et al. 2000].
Considering that the boundary zones are the place of intense chemical and biological transfor
-mations, the amount of nitrous oxide (N2O) emis
-sion was investigated, which arises as a result of the denitrification process taking place in the soil. The relationship between the content of nitrates in the soil and the emission of N2O from the bound
-ary zone was directly proportional (Figure 3). The research confirmed the observations of many au
-thors that the amount of nitrous oxide emissions increases along with the nitrate content in the soil [Sapek 2008, Burczyk et al. 2011, Gabrielle et al. 2006, Signor et al. 2013].
Additionally, for the purpose of detailed analysis of nitrogen compounds content in the boundary zone, the groundwater, soil solution and water of the watercourse, which is the re
-ceiver of all water flowing from the basin, were examined. On the basis of the obtained results, it was found that the water from the watercourse had the highest content of nitrates and total nitro
-Figure 2. Use of the catchment area (own elaboration based on the soil and agricultural map)
Table 1. Selected statistics describing the content of nitrogen compounds in the soil of the buffer zone
Parameter NO3
-[mg·(100g)-1] NH4 +
[mg·(100g)-1] TN [%]
Mean 1.97 2.62 0.29
Minimum 0.49 0.19 0.23
Maximum 3.83 5.55 0.34
Standard
gen. This is characteristic of the period of thaw floods in North-Eastern Poland, where mainly the content of biogenic substances in surface water increases. However, the smallest content of these components was noted in groundwater. In this water, the average content of ammonium ions was the highest (Table 2). The period in which the tests were carried out was characterized by an increased runoff of surface and subsurface water from the catchment; therefore, the lower content of the analyzed nitrogen compounds in ground
-water may indicate that these substances have not yet reached through filtration to the lower layers of the soil profile and groundwater.
Considering that buffer zones are part of the basin, which has a significant impact on other landscape elements, it was found that with the ni
-trate content in the soil increases along with their concentration in the watercourse (Figure 4).
Figure 3. Relationship between the emission of nitrous oxide (N2O) and the content of nitrates (NO3-) in soil
Table 2. Selected statistics describing the content of nitrogen compounds in groundwater, soil solution from the buffer zone and water of the watercourse
Parameter NO3
-[mg·dm-3] NH4 +
[mg·dm-3] [%]TN groundwater
Mean 8.88 0.61 5.19
Minimum 3.90 0.09 3.22
Maximum 13.71 1.19 7.13
Standard deviation 3.28 0.43 1.22
soil solution
Mean 10.97 0.36 6.12
Minimum 2.20 0.10 3.54
Maximum 21.00 0.90 8.14
Standard deviation 5.22 0.25 1.84
water of the watercourse
Mean 24.08 0.54 12.60
Minimum 8.49 0.05 6.52
Maximum 35.87 1.09 17.98
Standard deviation 8.65 0.40 3.71
CONCLUSIONS
Buffer zones are areas that separate the ag
-ricultural land from surface water. Therefore, their function is to protect the aquatic ecosys
-tems against pollution from agricultural sources. However, in addition to the protective function performed mainly during the growing season, they can become a source of biogens in the early spring period. In North-Eastern Poland, this is a critical period for the quality of water in the agricultural landscape due to leaching from the catchment and increased migration [Krasowska 2018]. Research has shown that the soils of these zones can be a source of nitrogen compounds to the environment. In these places, organic and in
-organic matter accumulates from the catchment system. As a result of surface and subsurface run-off, biogenic substances are moved towards the watercourse and accumulated in the buffer areas. They can be released in the early spring period during the increased humidity of the basin. The obtained study results confirm the observations of other authors that the environmental pollution stems from the excessive nitrogen loads from ag
-ricultural sources. Many authors emphasize that the nitrogen from agricultural area sources is be
-coming the main objective in the measures to pro
-tect water in agricultural catchments [Dupas et al. 2015, Dąbrowska et al. 2016]. However, in order to effectively counteract the environmental deg
-radation, the processes taking place in the catch
-ment should be identified in detail.
Acknowledgements
This work was financially supported by the Ministry of Science and Higher Education as a part of the project S/WBiIS/02/15.
REFERENCES
1. Banaszuk P. 2007. Wodna migracja składników ro
-zpuszczonych do wód powierzchniowych w zlew
-ni górnej Narwi. Wyd. Polit. Białost.
2. Bekier-Jaworska E., Szostak B. 2006. Zawartość mineralnych form azotu w glebie na terenie ferm świń. Acta agrophysica, 8(2), 299–308.
3. Blank P.J., Dively G.P., Gill D.E., Rewa C.A. 2011. Bird community response to filter strips in Mary
-land. J. Wildl. Manage., 75, 116–125.
4. Brian M., Hickey C., Doran B. 2004. A Review of the efficiency of buffer strips for the maintenance
and enhancement of riparian ecosystems. Water Qual. Res. J. Canada 39(3), 311- 317.
5. Burczyk P., Miatkowski Z., Turbiak J. 2011. Wstępne rozpoznanie emisji N2O w wybranych siedliskach łąkowych w różnych regionach Polski. Woda Środ. Obsz. Wiej., 11, 4(36), 57–67.
6. Correll D.L. 2005. Principles of planning and estab
-lishment of buffer zones. Ecol. Eng., 24, 433–439. 7. Dąbrowska J., Moryl A., Kucharczak-Moryl E, Żmuda R., Lejcuś I. 2016 Zawartość związków azotu w wodach rzeki strzegomki powyżej zbiorni
-ka Dobromierz. Acta Sci. Pol. Formatio Circumi
-ectus, 15(3), 57–69.
8. Gabrielle B., Laville P., Duval B., Nicoullaud Ger
-mon J.C., Henault C. 2006. Process-based model
-ing of nitrous oxide emissions from wheat-cropped soils at the subregional scale, Global Biogeochem. Cycles., 20.
9. Haag D., Kaepenjohann M. 2001. Landscape fate of nitrate fluxes and emissions in Central Eurpoe. A critical review of concepts, data, and models for transport and retention. Agriculture, Ecosystems and Environment, 86, 1–21.
10. Hefting M.M., Clement J-C, Bienkowski P, Dow
-rick D., Guenat C., Butturini A., Topa S., Pinay G., Verhoeven J.T.A. 2005. The role of vegetation and litter in the nitrogen dynamics of riparian buffer zones in Europe. Ecol. Eng. 24, 465–482.
11. Hefting M.M., van den Heuvel RN., Verhoeven J.T.A. 2012. Wetlands in agricultural landscapes for nitrogen attenuation and biodiversity enhancement: Opportunities and limitations. Ecol. Eng., 1–9. 12. Krasowska M. 2018. The snowmelt as a critical pe
-riod for the quality of surface water in the agricul
-tural catchment. Web of Conferences 44.
13. Marcinowski T. 2010. Emisja gazowych związków azotu z rolnictwa. Woda Środ. Obsz. Wiej., 10, 3(31), 175–189.
14. Mitsch W.J., Jorgensen S.E. 2003. Ecological engi
-neering: A field whose time has come. Ecol. Eng., 20, 363–377.
15. Liu X., Zhang X., Zhang M. 2008. Major factors influencing the efficacy of vegetated buffers on sediment trapping: a review and analysis. J. Envi
-ron. Qual., 37, 1667–1674.
16. Ostrowska A., Gawliński S., Szczubiałka Z. 1991. Metody analizy i oceny właściwości gleb i roślin. Instytut Ochrony Środowiska, 95.
17. Pionke H.B., Gburek W.J., Sharpley A.N. 2000. Critical source area controls on water quality in an agricultural watershed located in the Chesepeake bay. Ecol. Eng., 14, 325–335.
18. Sapek A. 2008. Emisja tlenków azotu (NOX) z gleb uprawnych i ekosystemów naturalnych do at
19. Signor D., Pellegrino Cerri C.E. 2013. Nitrous ox
-ide emissions in agricultural soils: a review Pesq. Agropec. Trop., Goiânia, 43(3), 322–338.
20. Turbiak J., Miatkowski Z., Chrzanowski S., Gąsiewska A., Burczyk P. 2011. Emisja podtlenku azotu z gleby torfowo-murszowej w dolinie biebrzy w zależności od warunków wodnych. Woda Środ. Obsz. Wiej., 11, 4(36), 234–245.
21. Wesström I., Messing I., Linnér H., Jan Lindström J., 2001. Controlled drainage-effects on drain out
-flow and water quality. Agricultural Water Man
-agement 47, 85- 100.
22. Wysocka-Czubaszek A., Czubaszek R., Roj-Rojew
-ski S., Banaszuk P. 2018. Methane and Nitrous Ox