INTRODUCTION
Remote sensing of environment is a rapidly developing and valuable branch of modern sci-ence. Currently, remote sensing is used in the geo-information systems (GIS) technologies for map-ping, better management of land, water and other natural resources, ecological monitoring, modeling and forecasting and, of course, it is also an impor-tant constituent of modern systems of precise agri-culture, where remote sensing provides specialists with the data that is further used into the decision support systems for better management of the ag-ricultural land [Kustas and Norman, 1996; Herold et al., 2002; Rogan and Chen, 2004]. Remote sens-ing provides great opportunities for fast and pre-cise evaluation of crops vegetation status in order to make the required corrections to agrotechnol-ogy and reach the maximum productivity of the agricultural land [Liaghat and Balasundram, 2010; Mulla, 2013]. In order to perform these functions,
different vegetation indices, which are calculated on the basis of the reflectance features of different land surfaces, are applied.
One of the most widely implemented vegeta-tion indices is Normalized Difference Vegetavegeta-tion Index (NDVI), which was first mentioned by Rouse et al. (1974). This index was the first spatially derived one to be successfully applied for distin-guishing the vegetation cover and its conditions. The index values are calculated by the Eq. (1):
𝑁𝑁𝑁𝑁𝑁𝑁𝑁𝑁 =(𝑎𝑎(𝑎𝑎𝑛𝑛𝑛𝑛𝑛𝑛− 𝑎𝑎𝑣𝑣𝑛𝑛𝑣𝑣)
𝑛𝑛𝑛𝑛𝑛𝑛+ 𝑎𝑎𝑣𝑣𝑛𝑛𝑣𝑣) (1) where: anir is the reflective infrared range of the
spectrum,
avisis the visible red range of the spectrum
[Carlson and Ripley, 1997].
However, the modern implementation of NDVI is not just limited to the detection of vege-tation and description of its conditions. On the on the reflectance peculiarities of green leaves, it is Accepted: 2020.06.15 Available online: 2020.07.01 Volume 21, Issue 6, August 2020, pages 176–182
https://doi.org/10.12911/22998993/123473
Spring Row Crops Productivity Prediction Using Normalized
Difference Vegetation Index
Raisa Vozhehova
1, Mykola Maliarchuk
1, Iryna Biliaieva
1, Pavlo Lykhovyd
1*,
Anastasiia Maliarchuk
1, Anatoliy Tomnytskyi
11 Institute of Irrigated Agriculture of NAAS, Naddniprianske, 73483 Kherson, Ukraine
* Corresponding author’s e-mail: [email protected]
ABSTRACT
The results of statistical modelling for the yields prediction of spring row crops, namely, maize, sorghum and
soy-bean, depending on the values of the remotely sensed normalized difference vegetation index (NDVI) at critical stages of the crops growth and development were presented. The spatial NDVI data obtained from the Sentinel-2
satellite were used to create the models. Quadratic regression analysis was applied to develop the yielding models
based on true yield data of the crops obtained in the period of 2017 and 2018 at the experimental field of the In
-stitute of Irrigated Agriculture of NAAS, Ukraine. The results of statistical modelling revealed that the method is
suitable for precise yield prediction, and the best stages for NDVI screening and use in this purpose are different for the studied crops. The best accuracy of prediction could be obtained at the stage of tasselling (VT) or silking
(R1) for maize (the mean absolute percentage error MAPE is 8.75%); at the stage of second trifoliate (V2) for soy
-bean (MAPE is 3.75%), and at the stage of half bloom (S6) for sorghum (MAPE is 17.62%). The yield predictions
by NDVI are reliable at a probability level of 95% (p < 0.05).
an indirect index that testifies about the potential photosynthetic activity of vegetation, and, as a re-sult, it can be used to obtain reliable knowledge about the potential productivity of agrocenoses. The linkage between NDVI and the volumes of absorbed photosynthetically active radiation (PAR) is direct and almost linear [Gamon et al., 1995]. Therefore, a strong connection between NDVI and PAR enables to find out a link between NDVI and yielding capacity, as the latter is di-rectly dependent on the volumes of PAR, which is effectively used by crops [Zhu et al., 2010; Raines, 2011].
The goal of our study was to determine the connection between the values of remotely sensed NDVI and yields of the studied spring row crops in order to provide precise early predictions of their productivity.
MATERIALS AND METHODS
The definition of the connection between NDVI values and yields was performed using quadratic regression analysis under the imple-mentation of Cramer’s rule [Gong et al., 2002]. The inputs for the development of equations were true values of spring row crops (maize, sorghum and soybean) and corresponding values of spa-tial NDVI obtained from Sentinel-2 and Sen-tinel-1 combined imaginary at main stages of the crop growth, namely: V2 (second trifoliate) and R2 (full bloom) for soybean [McWilliams et al., 1999]; S3 (growing point differentiation) and S6 (half bloom) for sorghum [Roozeboom and Prasad, 2019]; VT (tasselling) and R1 (silk-ing) for maize [Nafziger, 2013]. The true yields of the studied crops were obtained through the entire combine harvesting of the plots located at the experimental field of the Institute of Irrigated Agriculture of NAAS (within the square built by the key points with coordinates: 46°44’36.5”N 32°42’07.0”E; 46°44’39.5”N 32°42’32.0”E; 46°44’33.3”N 32°42’33.7”E; 46°44’30.3”N 32°42’08.5”E) in 2017–2018. The yields were calculated at the standard moisture content in grain (14% for maize, 13.5% for sorghum and 12% for soybean). The coefficient of yields varia-tion (CV) was calculated as a ratio of standard deviation (SD) to mean value [Everitt and Skro-ndal, 2010]. The yields were linked to the corre-sponding values of NDVI and the data were pro-cessed using Microsoft Excel 365 software at the
probability level of 95% (p < 0.05) with further approximation and calculation of mean absolute percentage errors (MAPE) for yield predictions [De Myttenaere et al., 2016].
RESULTS AND DISCUSSION
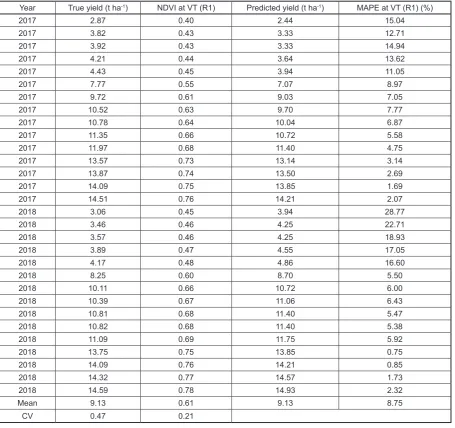
While analyzing the NDVI values at two stages of grain corn development a remarkable feature was observed: the values of index at both stages of the crop growth (VT and R1) were simi-lar, resulting in a comparable level of yield fore-casting accuracy (Table 1).
The regression analysis allowed determining the strength of the connection between the NDVI values and maize yields by the rule of thumb, which is very high and positive with a coefficient of correlation R = 0.9906, and coefficient of de-termination R2 = 0.9813 [Mukaka, 2012].
Qua-dratic Eq. (2) describing the linkage between the spatial index values and yields of the crop is:
𝑦𝑦 = 8.571 × 𝑥𝑥2+ 22.755 × 𝑥𝑥 − 8.035 (2)
where: y is the yield of maize in t ha-1, and x is
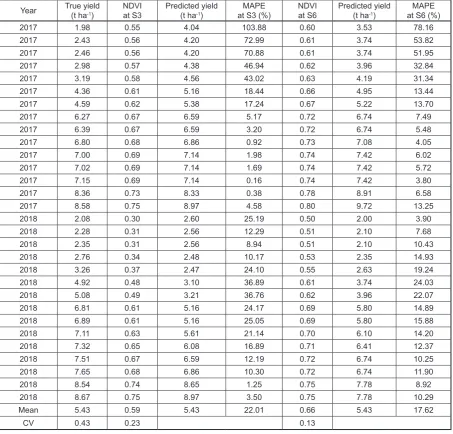
the value of NDVI at VT or R1 stage. Approximation of the regression model and calculation of MAPE that is less than 10%, proved the high accuracy and reli-ability of the forecasting grain corn yield by the NDVI values [Moreno et al., 2013]. As for other studied crops, the NDVI val-ues corresponding to the different stages of their growth differed, providing unequal accuracy of yield predictions. Thus, the least accuracy of qua-dratic regression model for yield forecasting was for sorghum (Table 2).
The greatest discrepancy between the pre-dicted and true yields was observed at the S3 stage – 22.01% on average. This makes the yield-ing model for this stage just a reasonable forecast-ing, which should not be implemented as a guid-ance and cannot be used in precision agriculture [Moreno et al., 2013]. Quadratic regression Eq. for S3 stage looks like (3):
𝑦𝑦 = 42.311 × 𝑥𝑥2− 30.065 × 𝑥𝑥 + 7.833 (3)
where: y is the yield of sorghum in t ha-1, and x is
the value of NDVI at S3 stage. The coef-ficient of correlation R for this model is 0.8809, R2 is 0.7760, which still is a high
The sorghum yield prediction using NDVI at S6 stage has higher accuracy with an aver-age MAPE of 17.62% that is a good forecasting [Moreno et al., 2013]. Quadratic regression Eq. of the model is (4):
𝑦𝑦 = 52.193 × 𝑥𝑥2− 42.126 × 𝑥𝑥 + 10.014 (4) where: y is the yield of sorghum in t ha-1, and x is the
value of NDVI at S6 stage. The coefficient of correlation for the model R is 0.9298, and R2 is 0.8645, respectively, testifying
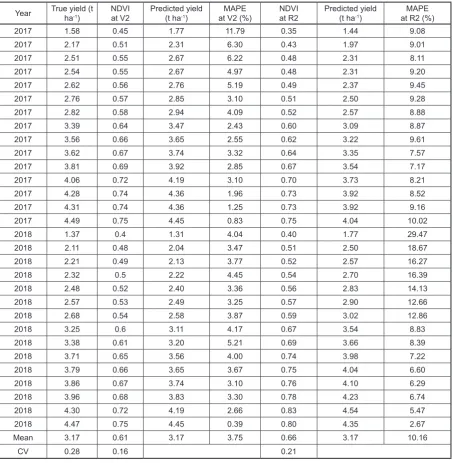
about a high positive correlation accord-ing to the rule of thumb [Mukaka, 2012]. The regression analysis of the relationship be-tween NDVI and soybean yields showed the high-est level of correspondence between these parame-ters at the V2 stage of the crop, when MAPE of the quadratic model averaged to 3.75% which testifies
about the very high accuracy of yield forecast ac-cording to Moreno et al. (2013) (Table 3).
The forecasting model could be expressed as Eq. (5):
𝑦𝑦 = −0.221 × 𝑥𝑥2+ 9.220 × 𝑥𝑥 − 2.338 (5) where: y is the yield of soybean in t ha-1, and x
is the value of NDVI at V2 stage. Coef-ficient of correlation R for this model is 0.9914, R2 is 0.9829, which is a very high
positive correlation according to the rule of thumb [Mukaka, 2012].
The quadratic regression model for soybean yields at R2 stage is less accurate with MAPE av-eraged to 10.16%, however, this value also certi-fies about the possibility of precise productivity prediction for the crop [Moreno et al., 2013]. The model could be described by the Eq. (6):
Table 1. True and predicted by the NDVI-based model yields of maize
Year True yield (t ha-1) NDVI at VT (R1) Predicted yield (t ha-1) MAPE at VT (R1) (%)
2017 2.87 0.40 2.44 15.04
2017 3.82 0.43 3.33 12.71
2017 3.92 0.43 3.33 14.94
2017 4.21 0.44 3.64 13.62
2017 4.43 0.45 3.94 11.05
2017 7.77 0.55 7.07 8.97
2017 9.72 0.61 9.03 7.05
2017 10.52 0.63 9.70 7.77
2017 10.78 0.64 10.04 6.87
2017 11.35 0.66 10.72 5.58
2017 11.97 0.68 11.40 4.75
2017 13.57 0.73 13.14 3.14
2017 13.87 0.74 13.50 2.69
2017 14.09 0.75 13.85 1.69
2017 14.51 0.76 14.21 2.07
2018 3.06 0.45 3.94 28.77
2018 3.46 0.46 4.25 22.71
2018 3.57 0.46 4.25 18.93
2018 3.89 0.47 4.55 17.05
2018 4.17 0.48 4.86 16.60
2018 8.25 0.60 8.70 5.50
2018 10.11 0.66 10.72 6.00
2018 10.39 0.67 11.06 6.43
2018 10.81 0.68 11.40 5.47
2018 10.82 0.68 11.40 5.38
2018 11.09 0.69 11.75 5.92
2018 13.75 0.75 13.85 0.75
2018 14.09 0.76 14.21 0.85
2018 14.32 0.77 14.57 1.73
2018 14.59 0.78 14.93 2.32
Mean 9.13 0.61 9.13 8.75
𝑦𝑦 = −0.221 × 𝑥𝑥2+ 9.220 × 𝑥𝑥 − 2.338 (6)
where: y is the yield of soybean in t ha-1, and x
is the value of NDVI at R2 stage. Coef-ficient of correlation R for this model is 0.9377, R2 is 0.8793, which is a very high
positive correlation according to the rule of thumb [Mukaka, 2012].
Our results testify that it is possible to pre-dict the crop yields by the NDVI values with a relatively high accuracy, which exceeds 90% for grain corn and soybean, and is just above 80% for sorghum. Lower accuracy of the sorghum yield forecasting was attributed to the higher variation of the input NDVI data used in our study: CV for S3 stage was the highest among the studied crops and reached 0.23, while the tendency towards an
increase of the forecasting model performance under lower NDVI fluctuations was observed (the closest prediction was obtained at the lowest CV of NDVI – 0.16 at V2 stage of soybean).
Another study on the soybean yield predic-tion by the NDVI values also claimed that there is a strong non-linear dependence of the crop pro-ductivity on NDVI that is proven by the value of adjusted R2 reaching 0.721 under the
implementa-tion of flexible Fourier transform modelling meth-od [Xu and Katchova, 2019]. The results obtained by Bolton and Friedl (2013), where the accuracy of soybean yield forecasting using MODIS NDVI data were very close to the above-mentioned soy-bean yield prediction, being slightly lesser than in our study (R2 reached 0.69). Another recent
study also found out that the NDVI values have a positive correlation with maize and soybean
Table 2. True and predicted by the NDVI-based model yields of sorghum
Year True yield (t ha-1) NDVI at S3 Predicted yield (t ha-1) at S3 (%)MAPE NDVI at S6 Predicted yield (t ha-1) at S6 (%)MAPE
2017 1.98 0.55 4.04 103.88 0.60 3.53 78.16
2017 2.43 0.56 4.20 72.99 0.61 3.74 53.82
2017 2.46 0.56 4.20 70.88 0.61 3.74 51.95
2017 2.98 0.57 4.38 46.94 0.62 3.96 32.84
2017 3.19 0.58 4.56 43.02 0.63 4.19 31.34
2017 4.36 0.61 5.16 18.44 0.66 4.95 13.44
2017 4.59 0.62 5.38 17.24 0.67 5.22 13.70
2017 6.27 0.67 6.59 5.17 0.72 6.74 7.49
2017 6.39 0.67 6.59 3.20 0.72 6.74 5.48
2017 6.80 0.68 6.86 0.92 0.73 7.08 4.05
2017 7.00 0.69 7.14 1.98 0.74 7.42 6.02
2017 7.02 0.69 7.14 1.69 0.74 7.42 5.72
2017 7.15 0.69 7.14 0.16 0.74 7.42 3.80
2017 8.36 0.73 8.33 0.38 0.78 8.91 6.58
2017 8.58 0.75 8.97 4.58 0.80 9.72 13.25
2018 2.08 0.30 2.60 25.19 0.50 2.00 3.90
2018 2.28 0.31 2.56 12.29 0.51 2.10 7.68
2018 2.35 0.31 2.56 8.94 0.51 2.10 10.43
2018 2.76 0.34 2.48 10.17 0.53 2.35 14.93
2018 3.26 0.37 2.47 24.10 0.55 2.63 19.24
2018 4.92 0.48 3.10 36.89 0.61 3.74 24.03
2018 5.08 0.49 3.21 36.76 0.62 3.96 22.07
2018 6.81 0.61 5.16 24.17 0.69 5.80 14.89
2018 6.89 0.61 5.16 25.05 0.69 5.80 15.88
2018 7.11 0.63 5.61 21.14 0.70 6.10 14.20
2018 7.32 0.65 6.08 16.89 0.71 6.41 12.37
2018 7.51 0.67 6.59 12.19 0.72 6.74 10.25
2018 7.65 0.68 6.86 10.30 0.72 6.74 11.90
2018 8.54 0.74 8.65 1.25 0.75 7.78 8.92
2018 8.67 0.75 8.97 3.50 0.75 7.78 10.29
Mean 5.43 0.59 5.43 22.01 0.66 5.43 17.62
yields and might be implemented as inputs for the yield prediction [Johnson, 2014]. The NDVI data has also been proven to be efficiently used for large-scale grain corn yield prediction using the regression models based on long-term datasets: the method provided reliable results 6–8 weeks in advance from the harvesting period [Nagy et al., 2018]. The regression analysis of corn yield linked to the NDVI time series values revealed a strong dependence of the crop on the NDVI at the pre-silking period, enabling to predict the possible yield losses due to unfavourable condi-tions in this period [Wang et al., 2016]. There is a study reporting about a very high accuracy of an empirical pair model “maize yield – NDVI at
flowering stage” that provided just 3% discrepan-cy from the true yields [Fernandez-Ordoñez and Soria-Ruiz, 2017]. The study devoted to the de-termination of the maize yields depending on the NDVI sensed by unmanned aerial vehicles at dif-ferent stages of the crop growth showed that the best yield prediction performance was obtained under the implementation of the R2 stage NDVI values as inputs [Maresma et al., 2020], while our study showed that the model performance is good at R1 stage. Some scientists also reported a strong dependence of the ‘NDVI – maize yield” prediction model on the plant density of the crop [de Olivera et al., 2019], while this factor was not taken into account in our research. As for
Table 3. True and predicted by the NDVI-based model yields of soybean
Year True yield (t ha-1) NDVI at V2 Predicted yield (t ha-1) at V2 (%)MAPE NDVI at R2 Predicted yield (t ha-1) at R2 (%)MAPE
2017 1.58 0.45 1.77 11.79 0.35 1.44 9.08
2017 2.17 0.51 2.31 6.30 0.43 1.97 9.01
2017 2.51 0.55 2.67 6.22 0.48 2.31 8.11
2017 2.54 0.55 2.67 4.97 0.48 2.31 9.20
2017 2.62 0.56 2.76 5.19 0.49 2.37 9.45
2017 2.76 0.57 2.85 3.10 0.51 2.50 9.28
2017 2.82 0.58 2.94 4.09 0.52 2.57 8.88
2017 3.39 0.64 3.47 2.43 0.60 3.09 8.87
2017 3.56 0.66 3.65 2.55 0.62 3.22 9.61
2017 3.62 0.67 3.74 3.32 0.64 3.35 7.57
2017 3.81 0.69 3.92 2.85 0.67 3.54 7.17
2017 4.06 0.72 4.19 3.10 0.70 3.73 8.21
2017 4.28 0.74 4.36 1.96 0.73 3.92 8.52
2017 4.31 0.74 4.36 1.25 0.73 3.92 9.16
2017 4.49 0.75 4.45 0.83 0.75 4.04 10.02
2018 1.37 0.4 1.31 4.04 0.40 1.77 29.47
2018 2.11 0.48 2.04 3.47 0.51 2.50 18.67
2018 2.21 0.49 2.13 3.77 0.52 2.57 16.27
2018 2.32 0.5 2.22 4.45 0.54 2.70 16.39
2018 2.48 0.52 2.40 3.36 0.56 2.83 14.13
2018 2.57 0.53 2.49 3.25 0.57 2.90 12.66
2018 2.68 0.54 2.58 3.87 0.59 3.02 12.86
2018 3.25 0.6 3.11 4.17 0.67 3.54 8.83
2018 3.38 0.61 3.20 5.21 0.69 3.66 8.39
2018 3.71 0.65 3.56 4.00 0.74 3.98 7.22
2018 3.79 0.66 3.65 3.67 0.75 4.04 6.60
2018 3.86 0.67 3.74 3.10 0.76 4.10 6.29
2018 3.96 0.68 3.83 3.30 0.78 4.23 6.74
2018 4.30 0.72 4.19 2.66 0.83 4.54 5.47
2018 4.47 0.75 4.45 0.39 0.80 4.35 2.67
Mean 3.17 0.61 3.17 3.75 0.66 3.17 10.16
sorghum, there are a few findings related to the NDVI-based grain yield prediction. There is a re-port stated about high accuracy (MAPE < 0.2) of the sorghum biomass prediction using NDVI data up to 6 months in advance [Zinke-Wehlmann et al., 2019]. A comprehensive large-scale study con-ducted in the US with various crops, including sor-ghum, maize, soybean, on the relationship between the crop yields and MODIS NDVI showed a posi-tive correlation between these figures for all the mentioned crops considering the possibility of the use of spatial vegetation indices in the yield predic-tion [Johnson, 2016]. Another large study devoted to the derivation of maize, soybean and sorghum yielding potential through the multivariate regres-sion analysing the sets of satellite imaginary and calculated vegetation indices testified about a rea-sonable correlation between the vegetation indices and yields (the coefficient R values were 0.86, 0.74 and 0.65 for maize, soybean and sorghum, respec-tively) [Petersen, 2018]. These results agree with ours in that the least inter-connection with R2 of
0.42 was observed for sorghum, as in our study. Besides the individual NDVI-yield models, other scientists provided combined models with other indices related to the crop productivity, name-ly, PAR, leaf area index (LAI), enhanced vegetation index (EVI), etc. [Báez-González et al., 2002; Fang and Hoogenboom, 2011; Lykhovyd, 2020]. We consider this approach reasonable in some cases, in particular, when it is difficult to obtain highly reli-able prediction using single vegetation index as for sorghum in our study, because the introduction of additional crop indices may significantly improve the modelling performance. Besides, implementa-tion of modern better computaimplementa-tion techniques can also be useful for the enhancement of the yielding prediction models [Stas et al., 2016; Tiwari and Shukla, 2020]. However, complicated computa-tions through artificial neural networks (ANN) sometimes do not show performance, which is much better than of regression analysis: the ANN NDVI-based model of sugarcane yield prediction had R2 of 0.61 that cannot be considered as a highly
reliable forecast [Fernandes et al., 2017].
CONCLUSIONS
The statistical analysis of the yields of three spring row crops, namely, grain corn, sorghum and soybean, in the connection to the NDVI val-ues obtained from the Sentinel-2 remote sensing
imaginary at critical stages of the studied crops growth proved a high positive correlation between the spatial vegetation index and their productivity. By means of the quadratic regression analysis per-formed under the implementation of Cramer’s rule, it was determined that the NDVI-based models for early yield prediction are suitable for precise yield forecasting at the probability level of 95% (p < 0.05). The values of MAPE for the best prediction models are: 8.75% for grain corn, 17.62% for sor-ghum, 3.75% for soybean, respectively. Therefore, NDVI should be used as a tool for early yield fore-casting both for the scientific and practical needs.
Considering the results of our study and the above-mentioned reports of other scientific groups, it was concluded that notwithstanding the fact of a huge number of studies devoted to the yield simulation by spatial vegetation indices, greater knowledge on the technique of their appli-cation in precision agriculture is required to pro-vide the scientifically substantiated recommenda-tions for practitioners.
REFERENCES
1. Báez-González, A.D., Chen, P.Y., Tiscareño-López,
M., Srinivasan, R. 2002. Using satellite and field data
with crop growth modeling to monitor and estimate corn yield in Mexico. Crop Science, 42, 1943–1949.
2. Bolton, D.K., Friedl, M.A. 2013. Forecasting crop
yield using remotely sensed vegetation indices and
crop phenology metrics. Agricultural and Forest
Meteorology, 173, 74–84.
3. Carlson, T.N., Ripley, D.A. 1997. On the relation
be-tween NDVI, fractional vegetation cover, and leaf area
index. Remote sensing of Environment, 62, 241–252. 4. De Myttenaere, A., Golden, B., Le Grand, B., Rossi,
F. 2016. Mean absolute percentage error for regres
-sion models. Neurocomputing, 192, 38–48.
5. de Oliveira, M.F., Ormond, A.T.S., de Frei
-tas Noronha, R.H., dos Santos, A.F., Zerbato, C., Furlani, C.E.A. 2019. Prediction Models of Corn
Yield by NDVI in Function of the Spacing Arrange
-ment. Journal of Agricultural Science, 11, 493–500. 6. Everitt, B.S., Skrondal, A. 2010. The Cambridge
Dictionary of Statistics. Cambridge Univ Press, Cambridge, UK.
7. Fang, H., Liang, S., Hoogenboom, G. 2011. Integra
-tion of MODIS LAI and vegeta-tion index products with the CSM–CERES–Maize model for corn yield estimation. International Journal of Remote Sens-ing, 32, 1039–1065.
J.C.D.M. 2017. Sugarcane yield prediction in
Bra-zil using NDVI time series and neural networks
ensemble. International Journal of Remote Sens-ing, 38(16), 4631–4644.
9. Fernandez-Ordoñez, Y.M. and Soria-Ruiz, J. 2017.
Maize crop yield estimation with remote sensing and empirical models. In 2017 IEEE Internation-al Geoscience and Remote Sensing Symposium (IGARSS). IEEE, pp. 3035–3038.
10. Gamon, J.A., Field, C.B., Goulden, M.L., Griffin,
K.L., Hartley, A.E., Joel, G., Penuelas, J., Valen
-tini, R. 1995. Relationships between NDVI, canopy
structure, and photosynthesis in three Californian vegetation types. Ecological Applications, 5, 28–41.
11. Gong, Z., Aldeen, M., & Elsner, L. 2002. A note on
a generalized Cramer’s rule. Linear algebra and its applications, 340, 253–254.
12. Herold, M., Scepan, J., Clarke, K.C. 2002. The use of remote sensing and landscape metrics to describe structures and changes in urban land uses. Environ-ment and Planning A, 34, 1443–1458.
13. Johnson, D.M. 2014. An assessment of pre-and with-in-season remotely sensed variables for forecasting corn and soybean yields in the United States. Re-mote Sensing of Environment, 141, 116–128. 14. Johnson, D.M. 2016. A comprehensive assessment
of the correlations between field crop yields and
commonly used MODIS products. International
journal of applied earth observation and geoinfor
-mation, 52, 65–81.
15. Kustas, W.P. and Norman, J.M. 1996. Use of remote sensing for evapotranspiration monitoring over land surfaces. Hydrological Sciences Journal, 41, 495–516. 16. Liaghat, S. and Balasundram, S.K. 2010. A review:
The role of remote sensing in precision
agricul-ture. American journal of agricultural and biological
sciences, 5, 50–55.
17. Lykhovyd, P.V. 2020. Sweet corn yield simulation
using normalized difference vegetation index and
leaf area index. Journal of Ecological Engineer-ing, 21, 228–236.
18. Maresma, A., Chamberlain, L., Tagarakis, A., Kharel, T., Godwin, G., Czymmek, K.J., Shields, E.,
Ketter-ings, Q.M. 2020. Accuracy of NDVI-derived corn
yield predictions is impacted by time of sensing. Com-puters and Electronics in Agriculture, 169, 105236. 19. McWilliams, D.A., Berglund, D.R., Endres, G.J.
1999. Soybean growth and management quick guide. 20. Moreno, J.J.M., Pol, A.P., Abad, A.S., Blasco, B.C.
2013. Using the R-MAPE index as a resistant mea-sure of forecast accuracy. Psicothema, 25, 500–506. 21. Mukaka, M. 2012. Statistics Corner: A guide to ap-propriate use of. Malawi Medical Journal, 24, 69–71.
22. Mulla, D.J. 2013. Twenty five years of remote
sensing in precision agriculture: Key advances and
remaining knowledge gaps. Biosystems engineer-ing, 114, 358–371.
23. Nafziger, E. 2013. Corn. Illinois Agronomy Hand-book. Crop Science Extension and Outreach, Ur-bana IL, USA.
24. Nagy, A., Fehér, J., Tamás, J. 2018. Wheat and
maize yield forecasting for the Tisza river
catch-ment using MODIS NDVI time series and reported
crop statistics. Computers and Electronics in Agri-culture, 151, 41–49.
25. Petersen, L.K. 2018. Real-time prediction of crop yields from MODIS relative vegetation health: A continent-wide analysis of Africa. Remote Sens-ing, 10, 1726.
26. Raines, C.A. 2011. Increasing photosynthetic carbon assimilation in C3 plants to improve crop yield: current and future strategies. Plant physiology, 155, 36–42. 27. Rogan, J. and Chen, D. 2004. Remote sensing
tech-nology for mapping and monitoring land-cover and land-use change. Progress in planning, 61, 301–325.
28. Roozeboom, K.L. and Prasad, P.V. 2019. Sorghum
growth and development. In: Sorghum: State of the
Art and Future Perspectives. American Society of
Agronomy and Crop Science Society of America, Inc. 29. Rouse, J.W., Haas, R.H., Schell, J.A., Deering, D.W. 1974. Monitoring vegetation systems in the Great Plains with ERTS. NASA special publication, 351, 309.
30. Stas, M., Van Orshoven, J., Dong, Q., Heremans, S.,
Zhang, B. 2016. A comparison of machine learning
algorithms for regional wheat yield prediction
us-ing NDVI time series of SPOT-VGT. In 2016 Fifth
International Conference on Agro-Geoinformatics (Agro-Geoinformatics) (pp. 1–5). IEEE.
31. Zhu, X.G., Long, S.P., Ort, D.R. 2010. Improving
photosynthetic efficiency for greater yield. Annual
review of plant biology, 61, 235–261.
32. Zinke-Wehlmann, C., De Franceschi, P., Catel
-lani, M., Dall’Agata, M. 2019. Early within-season yield prediction and disease detection using Sentinel satellite imageries and machine learning technolo-gies in biomass sorghum. In Software Technology: Methods and Tools: 51st International Conference, TOOLS 2019, Innopolis, Russia, October 15–17, 2019, Proceedings. Springer Nature, pp. 227–234.
33. Tiwari, P. and Shukla, P. 2020. Artificial neural net
-work-based crop yield prediction using NDVI, SPI,
VCI feature vectors. In: Information and Commu
-nication Technology for Sustainable Development. Springer, Singapore, pp. 585–594.
34. Wang, R., Cherkauer, K., Bowling, L. 2016. Corn response to climate stress detected with
satellite-based NDVI time series. Remote Sensing, 8, 269.
35. Xu, C. and Katchova, A.L. 2019. Predicting soybean
yield with NDVI using a flexible Fourier transform