ISSN 0000 ©2014 WEJ Journal
Achieving Food security through Efficient Small
Holders Farming System in Jebel Eldair
Mechanized farms in North kordofan State, Sudan.
Maruod Elno Maruod
1, Elrashied Elimam Elkhidir
2, Tarig Elsheikh Mahmoud
3, Sayed
Ali Zareba
41. University of Kordofan, Dept. of Agricultural Economics
2. Sudan University for Science and Technology, Dept. of Agric. Economics 3. University of Kordofan, Gum Arabic Research Centre
4. University of West Kordofan, Dept of Rural Development
Corresponding author: Maruod Elno Maruod
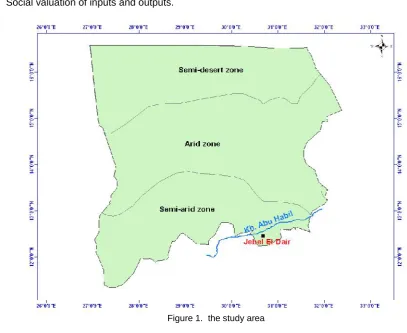
ABSTRACT:The current study was conducted in North Kordofan State, in Jebel Eldair Mechanized farms, covering two consecutive cropping seasons (2007/08 and 2008/09). Was considered for mechanized farming system. The main objectives were to determine the optimum crop combination that maximizes small- holders' profitability in the area, to access food security status in terms of food intake and net income in the area. In order to estimate the contribution of different production factors to the variation of different crop yield in the area and to calculate the international competitiveness and comparative advantage for economic efficiency of resource allocation of different farming system for groundnuts, millet, sesame, sorghum, and other minor crops grown in the study area. The primary data were collected via structured questionnaire. A multi-stage random sampling technique was employed to select 120 householders. Linear programming (L.P), partial crop budget, robust regression, household economy approach (HEA) and policy analysis matrix (PAM) as empirical approaches were used. 0.648 and 2.886 feddan (one feddan = 0.42 ha.) of millet and sesame were grown, though a total of SDG 1097.122 as gross margin was obtained by the optimal solution. Partial crop budget results indicated that all crops gave positive net returns and the highest profit was 259 and SDG 322 attained by millet and sesame respectively. The households' income and food security situation was found to be positive and the weekly food intake for households was 2601 Kcal, due to, this area is food secured. Resource use indicated that, land, labor and capital for millet and sesame were positive and highly significant at ten and one percent level, however farm potentiality increased by 90.5 and 88%, respectively. The DRC and CIC results obtained in such respect revealed that sesame production in the area has a very high comparative advantage and international competitiveness, since the DRC ratio is far less than one (0.02) and the CIC is also less (SDG 0.03) , the CIC expresses that only SDG 0.03 is invested to gain one US$. The study concluded that food security in the area can be realized by following the optimum cropping combinations, mitigating factors affecting comparative advantages and competitiveness, allocating production resources efficiently and improving nutritional status of people by using recommended energy intake.
Key words:Linear programming, Food security, Policy analysis matrix
INTRODUCTION
stated that Africa is still most seriously affected by food shortages, this situation is more critical in East Africa and famine conditions are emerging in several parts of the Horn of Africa. Food problem has occurred in Latin American such as Argentina and Brazil, and Asia such as China, India, Pakistan and others. As a result of recurrent droughts and food shortages, many initiatives have emerged over the years (Maxwell, 1992). These initiatives range from addressing the problem to mitigation efforts. Food security seems to improve gradually from the north towards the south, with northern households having much-less-favorable consumption indicators. This appeared to be due to the generally drier conditions in the north, which limited the livelihood options of the people in the area (ANLA - WFP Sudan - May 2007). According to Squire et al, (1979) in the household production, profit maximization can be answered by comparing the estimated increase in output accompanying an increase in factor input with the factor price. It is well-known result of the theory of the firm that, if a firm is making optimum use of productive inputs (Land, Labor and Capital) output will be carried to the point at which the costs of additional inputs are equal to the value of additional output. Hazell (1986) reported that linear programming model is a method of determining a profit maximization combination of farm enterprises that is feasible with respect to a set of farm constraints. Partial budgeting is a method of organizing experimental data and information about the cost and benefits of the various alternative treatments (Cimmyt, 1988). Cafiero, 2003 stated that, PAM is best organized in terms of commodity systems, which are defined as the vertically integrated chains of production activities that go from the farm production to the retail market for consumption, including any processing and marketing activity that may exist in between. Robust regression provides an alternative to least squares regression that works with less restrictive assumptions. Specifically, it provides much better regression coefficient estimates when outliers are present in the data (Hamilton, 1991).
METHODOLOGY
To accomplish the objectives of the study, both secondary and primary data were collected using various tools .Due to the large size of the study area, along with the homogeneity exhibited in the socio-economic characteristics of rural population in the area under the study random sampling technique was used.
linear programming models
Hazell (1986) reported that linear programming model is a method of determining a profit maximization combination of farm enterprises that is feasible with respect to a set of farm constraints. Linear programming model has been developed to determine the area to be used for different crops for maximum contribution and for improving farmers' income. The model expressed as follows:
* Objective equation Maximize Z = ∑cjxj
j = 1 Subject to:
∑aijxj ≤ bi = 1 to n
Xj ≥ 0 all j = 1 to m non-negativity constraint activities Where:
Z = Gross margin
cj = Price of production activities xj = level of jth production activity
aij = the ith resource required for a unit of jth activity bi = the resource available with the sample farmers j = refers to number of activities from 1 to n
i = refers to number of resources from 1 to m * Constraints
(i) Land
∑aijxj≤ OL and ∑aijxj≤ RL,
Where: OL and RL are the size of owned land and rented land holding, respectively. (ii) Family labour
∑atj-htxj ≤ Lt, htxj ≤ At Where:
Lt and at = available family labor and hired labor in the t th period. ht = is the amount of hired labor required in the t th period for jth* activity. Atj = is the amount of labor required in the t th period for jth activity. (iii) Working capital
∑kijxj ≤ WK Where:
Kij = is the amount of working capital required for production and non production activities. *The objective function: maximize z.
Z = ax1+ bx2+ cx3+ dx4+ ex5+ fx6
Where a, b, c, d, e, f are coefficients of objective function. The general formula of the inequalities:
Ax1+ Bx2+Cx3+ Dx4+ Ex5+ Fx6≤ H
Where A, B, C, D, E, F are the coefficient of the constraints inequalities and H is the right hand side.
Model specifications
Six crops were grown in this area, x1= Sorghum, x2= millet, x3= groundnut, x4= sesame, x5= Roselle
and x6= cowpea. Production of one feddan requires 9, 9, 8, 7, 6, 6, and 144, 147, 118, 143, 128 and 124 man
hours of labor and SDG of working capital for the above crops, respectively. A total of 45 man hours of labor was needed for the entire farm crops. Gross margin had the same unit of Feddan and cowpea was the most profitable one with gross margin of SDG 361.The optimality in this area came with cultivation of 3.375 feddan of groundnut and 3.00 feddan of cowpea to get a total gross margin SDG 1596, Table (1)
Table 1. linear programming table, for Jebel Eldair Mechanized farms, in rain-fed
Row name X1 X2 X3 X4 RHS
Obj. function 116 259 78 322 Max
Land/ha 1 1 1 1 982
Labor/MH 54 77 66 78 275
W. capital/SD 247 493 122 213 675
Av. cult. area/ha 18 4 6 9
Source: Field survey 2009. Where, RHS = right hand side, OBj. = objective function, RES. = Resource, W= working capital and AV. = average.
Partial crop budgeting
Partial budgeting is a method of organizing experimental data and information about the cost and benefits of the various alternative treatments (Cimmyt, 1988). Partial budgeting is concerned with limited change in farm plan, whereas complete or whole farm budgeting covers a wide range of change (Eldukheri, 1997).
Food Security Situation for the Households Households Income
The main sources of income for household were agricultural production (crop production and animal production), and off –farm activities.
Households Expenditure
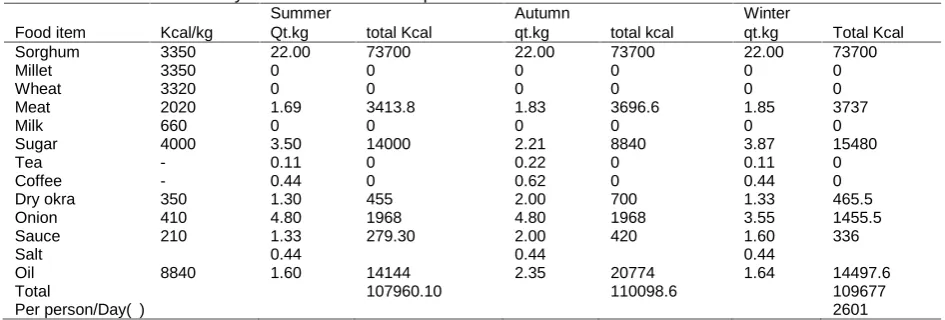
The food needed by households classified into three categories which are the food consumed in summer, autumn and winter as it is expected that people consumed different quantities of food among the different seasons. When the quantities of food consumed by households in the different seasons summed together and the average is calculated. As mentioned by Stephen (2006), the calorie consumption estimates may be used directly to categorize the degree of severity of food insecurity as: Above 2100Kcal/person/day is food secured, between 1800 and 2100 Kcal is marginally food insecure, between 1500 and 1800Kcal is moderately food insecure and less than 1500 Kcal/person/day is severely food insecure.
Robust Regression
Robust regression techniques are iterative procedures that seek to identify the outliers and minimize their impact on the coefficient estimates. The amount of weighting assigned to each observation in robust regression is controlled by a special curve called an influence function. There are three influence functions available. Outliers not only influence the estimation of the regression coefficients, they can also have an even larger effect on standard errors, t-tests, F-tests, R2, and other regression statistics. Ordinary Least Squares analysis does not perform well when outliers occur. We say that it is not resistant to changes in one or two observations. A robust estimate is one that is resistant to even drastic changes in one or two observations. (Hamilton, 1991).
Policy Analysis Matrix (PAM)
The aim of PAM is to ascertain whether these products are efficient in terms of international competitiveness and comparative advantage, and whether these products deserve continuing government support. The coefficients of the PAM models that measure the economic efficiency and policy distortions are: 1. Nominal Protection Coefficient on Output (NPCO).
3. Profitability Coefficient (PC). 4. Subsidy Ratio to Producer (SRP). 5. Domestic Resource Costs (DRC).
According to Mahmud (2004) there are two main activities in a constructing a PAM database: 1. Establishing the production system budget at private prices.
2. Social valuation of inputs and outputs. 3.
Figure 1. the study area
RESULTS AND DISCUSSIONS
Millet and sesame were emerged with an area of 0.648 and 2.886 feddan and a total of SDG 1128 of gross margin were gained, respectively by optimal solution of linear programming model, Table 2.
Partial crop budget founded that all crops have positive returns such result can be used to make tentative recommendations, which can be refined through multi-location testing over a wide area, Table 3.
According to food security situation and households' annual income and expenditure, the optimal solution adjusted final value incremented by 76% while the adjusted gross margin on food item costs was found to be positive and the daily energy received per person was 2601 Kcal. This result gives indication to the balanced food intake by households in terms of energy need and in term of net income and accordingly the area is food secured, Table 4, 5, and 6, respectively.Resource use indicated that, land, labor and capital for millet and sesame were positive and highly significant at ten and one percent level, however farm potentiality increased by 90.5 and 88%, respectively, Table 7.
Table 2. Optimal solution for farm plan or base model for Jebel Eldair Mechanized Farms in North Kordofan State in SDG/Feddan
Crop Value/SDG.
Sorghum 0
Millet 168
G/nut 0
Sesame 929
Source: field survey (2009)
Table 3. Partial crop budget for Jebel Eldair Rain-fed Mechanized Farms in N. K. State by kg and SDG. /Feddan
Cultural practices Crops
Sorghum Millet G/nut sodari Sesame
Bush cleaning 15 14 17 16
Sowing 19 23 29 22
Seeds 20 40 30 40
Total costs 54 77 76 78
Yield 136 236.44 160 248
Field price 1.25 1.42 1.013 1.25
Gross field benefits 170.00 336 162 310
Net benefits 116.00 259 86 322
Source: field survey (2009)
Table 4. the optimal solution adjusted final value and the effect on gross Margin in Jebel Eldair Rain-fed Mechanized Farms in N. K. State
Area crops area Final value Average Cultivated area
Adjusted final value
Existing gross margin
Increment in gross margin% Mech. X2 0.648 1097.22 37 11487.6 6490 76
X4 2.886
Source: field survey (2009)
Table 5. Effects of adjusted gross margin on food items cost- cluster Existing gross margin
Adjusted gross margin Cost of food items SDG. Net income
11487.6 7071 4416.6
Source: field survey (2009)
Table 6. Household Weekly Food Need and the equivalent K.cal: In Jebel Eldair Mechanized Farms in N. K. State
Food item Kcal/kg
Summer Autumn Winter
Qt.kg total Kcal qt.kg total kcal qt.kg Total Kcal Sorghum 3350 22.00 73700 22.00 73700 22.00 73700
Millet 3350 0 0 0 0 0 0
Wheat 3320 0 0 0 0 0 0
Meat 2020 1.69 3413.8 1.83 3696.6 1.85 3737
Milk 660 0 0 0 0 0 0
Sugar 4000 3.50 14000 2.21 8840 3.87 15480
Tea - 0.11 0 0.22 0 0.11 0
Coffee - 0.44 0 0.62 0 0.44 0
Dry okra 350 1.30 455 2.00 700 1.33 465.5
Onion 410 4.80 1968 4.80 1968 3.55 1455.5
Sauce 210 1.33 279.30 2.00 420 1.60 336
Salt 0.44 0.44 0.44
Oil 8840 1.60 14144 2.35 20774 1.64 14497.6
Total 107960.10 110098.6 109677
Per person/Day( )٦ 2601
Source: Field Survey (2009).
Table 7. Resource use of estimates of robust regression for Mechanized Farming in North Kordofan State
Coefficients Millet Sesame
Intercept 93.9*(15.1) -22.4(18)
Land (x1) 19.7*(3.2) -5.42(4.1)
Family labor(x2) -11.3*(2.4) 4.1(4.0) Hired labor(x3) -1.3*(0.3) -0.12(0.57)
Capital (x4) -5.8*(1.2) 2.17(0.58)
Adj. R squire 90.5 88
F value 22.4* 13.11***
Table 8. PAM indicators for millet by kg and SDG/feddan Mechanized Farming in North Kordofan State
Contents of PAM Variables
Revenue
(SDG) Tradable inputs (SDG)
Cost of domestic
resources (SDG) Profitability (SDG)
Financial prices 336 25.41 51.59 259
Economic prices 410.86 18.10 36.75 356.01
Transfers -74.86 7.31 14.84 -97.01
PAM Indicators/feddan):
FP in SDG/feddan = 259
EP rin SDG/feddan = 356.01
PC= 0.730
NPC= 0.818
EPC 0.791
DRC= 0.094
CIC= 0.197
Table 9. PAM indicators for sesame by kg and SDG/feddan in Mechanized Farming in North Kordofan State
Contents of PAM
Variables Revenue (SDG) Tradable inputs (SDG)
Cost of domestic resources
(SDG) Profitability (SDG)
Financial prices 322 25.74 52.26 244
Economic prices 2463.10 18.33 37.22 2407.54
Transfers -2141.10 7.41 15.04 -2163.54
PAM Indicators/feddan):
FP in SDG/feddan = 244
EP rin SDG/feddan = 2407.54
PC= 0.101
NPC= 0.131
EPC 0.121
DRC= 0.015
CIC= 0.032
CONCLUSION
North Kordofan is bestowed with several cash crops in which the state is having comparative advantages and high national and international competitiveness. Each locality of the state, in turn, is characterized by producing specific cash crop/crops. The current study is attempting to figure out the best crop combination that maximizes yield and profit for smallholder farmers. This may also assist and pave the way for large scale investment in agricultural production in the state.
In this study, several crops were tested for optimality. In this area optimality showed two crops to be grown, 0.648 feddan of millet and 2.886 feddan of sesame to get gross margin of SDG 1097.122. For partial crop budgeting showed that, sesame and millet with gross margin equal SDG 322 and 259 per feddan, respectively. The entire abovementioned partial budget results were validated with linear programming results. According to the annual income and expenditures, the net household income found to be positive and equal SDG 423.2. Also, the daily energy received per person per day exceeded the recommended energy intake stated by WHO and Stephen (2006). This result explicitly conferred evidence to the balanced food intake by households in terms of energy need and in terms of net income for the area. When taking into account the newly adjusted optimal solution and compared it with the previous annual average cost for food items requirement, the gross margin for the area found to be SDG 11485. This makes an increment in gross margin by 76% for the area. This increment in gross will be having positive effect in increasing the amounts of food items and hence increase the security situation in all the area. Also the increment in the gross margin makes the net income to be SDG 4416.6 for the area respectively. This makes the secured clusters three (B2, C2 and C4), and will reduce the insecurity in the other clusters.
When taking resource use under consideration; robust regression was used for crops grown in the area. In the case of millet production, the highest measure of fit (R2) was estimated to be 90%. For sesame production, which was grown in area (R2), was estimated to be 88%. These results pointed out that all coefficients were statistically efficient and important inputs.
REFERENCES
ANLA-WFP Sudan.2007. Rapid Food Security Assessment of IDP.
Cimmyt.1988. From agronomic data to farmer recommendation: An economic training manual PP 8-37.
Eldukheri IAA.1997. Past Changes and Future Prospects of Traditional Rain fed Farming in North Kordofan, Sudan, PhD. Thesis, and University of Minchin, Germany.
FAO.1994. The State of Food and Agriculture, Food and Agriculture Organization. Agricultural series No 27, ISBN 92 – 5 – 103550-4, Rome.
FAO.1996. Policy Statement and Plan of Action of the World Food Summit, Draft Working Paper at Inter-seasonal Working Group of the Committee of World Food Security, Rome, July 29-August 2.
FAO.1997. Assessment of the Household Food Security Situation, Based on the Aggregate Household Food Security Index and the Sixth World Food Survey, Document CFS: 97/4 SUP.1 at 23rd Session of the Committee on World Food Security, Rome, and April 14-18 Hamilton L. 1991. Regression with Graphics: A Second Course in Applied Statistics. Brooks/Cole Publishing Company. Pacific Grove,
California Nations.
Hazell PBR, Norton RD.1986. Mathematical programming for economic analysis in agriculture. Macmillan publishing company, University of New Mexico press, New York, USA. PP 1-77
Mahmoud TE. 2004. The Adequacy of price incentive on Production, Processing and Marketing of Gum Arabic In Sudan. Case of North and West Kordofan. Ph.D. Dissertation, Technical University of Dresden, Germany.
Maxwell S.1992. Food Insecurity in North Sudan, Discussion Paper no 262, IDS, University of Sussex, Brighton.
Squire L, Barnum HN. 1979. Household production. A model of an Agricultural Household, Theory and Evidence. World Bank Occasional Papers No. 27. The johns Hopkins University Press, Baltimore and London. PP 7-8.