INTRODUCTION
Excessive impact of the anthropogenic activi-ty causes a degradation of the aquatic ecosystems productivity and a disturbance of the ecologi-cal balance. The organization of qualitative and quantitative status of the surface and groundwater (aquatic and hydro-ecological monitoring) stud-ies system in order to predict the risks of river ecosystem functioning in the future is relevant.
The Western Bug River is one of the 5 most polluted rivers in Ukraine. Numerous scientific studies on the ecological status of the transbound-ary river have been undertaken through the cre-ation of the Euroregion Bug Cross-Border Asso-ciation. The status of the surface water quality of the river basin, the analysis of natural and anthro-pogenic sources of surface water pollution, and the need for joint transboundary monitoring were investigated by IB Koynova, MR Zabokritskaya, N.M. Wozniuk and others [Bilyk et al. 2009; Ko-jnowa 2007; Koynova et al. 2012; Khilchevskyi et al. 2016a; Nina Hagemann et al. 2014]. The monitoring studies of the hydro-ecological sta-tus of the river basin continue to this day, already
with the use of GIS technologies. They help not only to reflect the dynamics of the water quality changes on maps, but also to track the cause and effect of anthropogenic pollutants on the aquatic ecosystem in order to predict quality in the future [Gopchak et al. 2019].
The necessity of transition of Ukraine to the European standards and norms in the field of use and protection of the surface waters, harmoniza-tion of the monitoring methods, assessment of the water quality and typology of the study on the hy-drographic network is presented in [Khilchevskyi et al. 2016b]. The abiotic typology of surface wa-ters takes into account the main features of the natural conditions of the catchments, due to their physical, geographical and altitude position, geo-logical structure and morphometric features.
Owing to the National Security Strategy of Ukraine [Stratehiia… 2015], it is planned to bring national legislation into line with EU envi-ronmental policy, in particular the Water Frame-work Directive [Dyrektyva 2000/60/ EU]. The WFD defines an integrated basin model of the water management in the EU countries in order to achieve the “good” ecological status of the
Accepted: 2020.02.15 Available online: 2020.03.16
Volume 21, Issue 3, April 2020, pages 18–26 https://doi.org/10.12911/22998993/118303
Results of Surface Water Quality Monitoring of the Western Bug
River Basin in Lviv Region
Zoriana Odnorih
1*, Roman Manko
1, Myroslav Malovanyy
1, Khrystyna Soloviy
11 Viacheslav Chornovil Institute of Sustainable Development, Lviv Polytechnic National University, S. Bandera
Str. 12, Lviv, 79013, Ukraine
* Corresponding author’s e-mail: odnorigzor@gmail.com
ABSTRACT
The article describes the steps for organizing and conducting the ecological monitoring of surface water in order
to shift Ukraine to the European standards in the field of water use and protection. The main water users-pollutants of the Western Bug River basin in the Lviv region were identified. The results of the water samples taken from the
control bodies in 2018 were analyzed. A promising way to improve the work of the water basin management of the Western Bug River was proposed.
surface and groundwater masses. An integrated approach to water management is a water man-agement system that guarantees environmental safety and accessibility of water for the popula-tion and natural objects, based on the consider-ation of all water sources, the balance of sectoral interests and all levels of water use, widespread involvement of all water users, as well as ratio-nal use of water resources [Klymchyk 2018]. It is implemented through the hydrographic and wa-ter management of the wa-territory of Ukraine, the development of river basin management plans, the development of water management balances, the determination of the powers of central and lo-cal authorities [Upravlinnia dovkilliam... 2014]. For Ukraine, the introduction of the Basin Prin-ciple is, first of all, decentralization in the field of water management, since the Basin Councils involve both representatives of state authorities and local governments, as well as water users (at least 30%) and environmental NGOs. The Basin council decisions are taken into account when de-veloping the basin management plans and imple-menting the measures for the rational use of water resources and water protection.
In order to comply with the provisions of the WFD, Ukraine adopted [Zakon Ukrainy 2016], according to which nine areas of river basins were formed. According to [Postanova KMU № 758 2018], the new monitoring system for surface water, groundwater and marine water is a step to-wards the implementation of EU standards in the field of water quality and water management. The State Agency of Ukraine plans to implement the following 5 steps in 2019 to develop a river basin management plan:
• Step 1. Determination of water masses, their typology – till 01.07.2019;
• Step 2. Analysis of anthropogenic impacts, quantitative and qualitative status of waters – till 01.11.2019;
• Step 3. Description of the river basin district – till 01.09.2019;
• Step 4. Register of protected areas – till 01.12.2019;
• Step 5. Development of the monitoring pro-gram – by 31.12.2019.
According to [Nakaz № 4, 2019], the main criteria for determining the surface water mass in-clude: ecoregion; surface water category; typol-ogy; geographical and hydromorphological dif-ferences; change of ecological status; the zones (territories) to be protected.
According to [Nakaz № 5, 2019], the ecologi-cal status of the surface water mass class should be determined by biological, hydromorphologi-cal, chemical and physicochemical parameters:
• for the biological indicators – for the five classes corresponding to the environmental statuses “excellent”, “good”, “satisfactory”, “bad” and “very bad”;
• for chemical and physicochemical indica-tors – for the three classes corresponding to the ecological states “excellent”, “good” and “satisfactory”;
• for specific synthetic and non-synthetic con-taminants within the chemical and physico-chemical parameters – for the two classes cor-responding to the ecological states “good” and “satisfactory”.
The purpose of the work was to analyze the results of the monitoring studies of surface waters of the Western Bug River, conducted quarterly by the Water resources basin management of West-ern Bug and Syan, during 2018 in control bodies within the Lviv region.
MATERIALS AND METHODS
The flow of the river basin of the transbound-ary Western Bug River is formed on the territo-ry of three states – Poland (49.2% of the area), Ukraine (27.4%) and Belarus (23.4%). The West-ern Bug River is a left tributary of the Narew River (the Vistula River Basin). The length of the territory of Ukraine is 404 km, 363 km of which is the natural border between the Republic of Po-land, Ukraine and the Republic of Belarus, i.e. it is a transboundary watercourse. The Western Bug River is a mixed-type river that feeds from the melted spring and summer rainfall with little groundwater. The highest water level is observed in March and April during snowmelt, as well as in the first half of summer, when the highest rain-fall occurs. The lowest water level is in August-September and December-February. The main tributaries are: right-bank – Solotvyna, Bilyy Stik, Spasivka; left bank – Zolochivka, Poltva, Kam`yanka, Rata, Solokiya. A common feature of the tributaries is their small basins (from 240 to 570 km2) and wide wetlands [Zabokrytska et
al. 2006]. There is a well-developed hydrological network in the Western Bug basin. The average density of the river network is 0.35 km2 [Еdited
A surface water monitoring system was es-tablished in the 1980s to control the discharges of industrial enterprises in the coal, energy and alcohol industries. Currently, most businesses have ceased to exist, so utilities are the main pol-lutants of the Western-Bug River Basin. The wa-ter resources of this river are first and foremost a source of the technical water supply for the in-dustrial power, heat, fishery and agricultural en-terprises. The largest water users are [Baseinove upravlinnia… 2019]:
• industrial enterprises – SE «Dobrotvirskaya TPS» (PJSC DTEK «Westenergy»), LLC «Radekhivsky cukor», PJSC «Company «Enzym», PJSC «Lviv Coal Company», SE «Lvivvugillya» (separate subdivisions of the mine: «Velykomostivska», «Stepova», «Chervonogradska»), SE «Ukrspirt» («Vu-zlivske», «Stronibabske», «Strutinske», «Ra-va-Ruske»), SE «Danish Textile»;
• agricultural enterprises – LLC «Kunin», LLC «Yakymiv Fish», Private agricultural firm «Bilyy Stik», tenant Fedorchak R. V., PJSC «Lviv Regional Fish Production Plant» (WG «Krasne», WG «Yaniv»);
• housing and communal enterpris-es – MCC «Zolochivvodokanal», CE «Kam’yankavodokanal», CE «Zhovkivske VUVKG», CE «Chervonogradvodokanal», Sokalsk MCC WSE, LMCC «Lvivvodokanal»;
• transport industry – enterprises of PJSC «Ukrainian Railways».
Only groundwater is used for the drinking and sanitary needs of the Lviv region population, as the water from the Western Bug is not suitable for drinking.
There are two types of sources of water pol-lution: point (wastewater from enterprises and water utilities / municipal wastewater treatment plants) and diffuse sources (pesticides and min-eral fertilizers of farmland, livestock farms, land-scape transformation, bank unauthorized waste landfills).
The total wastewater discharge in the Lviv region is 135.31 million m3 of volume (192.7%
of the intake). This is explained by the presence of water intakes at the Lvivvodokanal LCM in the Dniester River basin, and all the wastewater is discharged into the Poltva River. Out of the total discharge: 93.33 million m3 – waste
wa-ter, normatively purified at treatment facilities; 35.48 million m3 – contaminated effluents (when
the discharges have exceeded at least one indi-cator of the approved MPD standards individu-ally for each enterprise); 3.3 million m3 –
norma-tively clean without treatment at treatment plants; 3.2 million m3 are uncategorized, mine waters.
In 2018, contaminated water was discharged by: Lvivvodokanal – 33.0 million m3 into the Poltva
River (which accounts for 93.1% of the volume of all polluted effluent); Sokal MCC WSE – 0.88 million m3 into the Western Bug River;
Cher-vonogradvodokanal – 0.7 million m3 into the
Western Bug River and Rata River; Rava-Ruskа MSE «SE Ukrspirt» – 0.25 million m3 into the
Rata River; CE Kamyankavodokanal – 0.18 mil-lion m3 in Kamianka River, Lviv National
Acad-emy of Sciences – 0.16 million m3 in the
Yar-ichevskyi River tributary, CE «Rava-Ruska BU №2» – 0.1 million m3 in Rata River [Baseinove
upravlinnia… 2019].
The state water quality monitoring network of the Lviv region in 2018 consisted of approved ob-servation points (ranges) according to [Nakaz № 14, 2015]. The water samples in the Western Bug River basin in the Lviv region were collected in 6 ranges (see Figure 1 and Table 1).
The program [Nakaz № 6, 2018] provides the definition of the hydrochemical parameters per-taining to the quality of the Western Bug River, the analysis of the existing monitoring system and its adaptation to the requirements of the Wa-ter Framework Directive. The measurements of the water quality indicators at the points of state monitoring are carried out quarterly by the labo-ratory of the Lviv hydro-geological and reclama-tion expedireclama-tion (now, the laboratory of the Water resources basin management of Western Bug and Syan). However, from the year 2019 [Nakaz №6, 2018], the observation points of the Western Bug River in the town of Dobrotvir and Stargorod vil-lage as well as the observation point on the Rata River in the Great Bridges have been excluded (see Table 2).
RESULTS AND DISCUSSION
The water quality assessment was made according to the pollution factor [KND 211.1.1.106–2003, Table 7], compared with the MPC for fisheries water bodies, according to [Postanova KMU № 552, 1996, Table. 6]. Con-tamination coefficient (CC) is determined by the formulas. The obtained numerical values of the CP allow estimating the water status by pollution levels by the following values:
• AC = 1 (uncontaminated (clean));
• CC = 1.01–2.50 (slightly contaminated);
• CC = 2.51–5.00 (moderately contaminated);
• AC = 5.01–10.00 (dirty);
• AC > 10 (very dirty).
In accordance with the Procedure for regula-tory monetary valuation of non-agricultural lands (except for settlements), the coefficients that con-sider the qualitative status of water bodies are taken into account (QWO2). The results are pre-sented in Table 2.
The data of radiological characteristics (ce-sium-137 and strontium-90) during 2016–2018 in all control establishments do not exceed the max-imum permissible norms, which indicates a stable radiation status of the surface waters of the Lviv region. When comparing long-term data, there is a tendency to decrease the activity of cesium and strontium, which is associated with their decay.
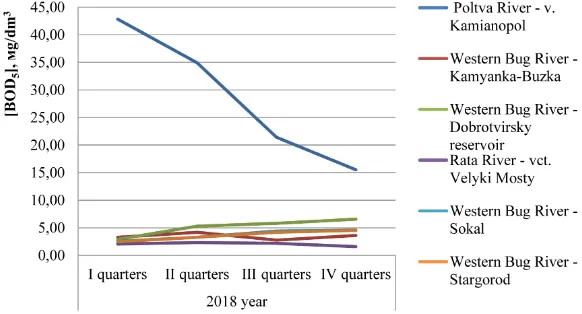
The results of the quarterly 2018 studies on the most pollutants in the controls – ammonium nitrogen, phosphate, BOD5 and iron (I) – are pre-sented in Figures 2–5.
The Poltva River (the left tributary of the West-ern Bug) is the most polluted river in the basin as it acts as a wastewater collector in Lviv. In 2018, ac-cording to [KND 211.1.1.106–2003], its water was characterized as «very dirty» (see Table 2).
Fig. 1. Map-diagram of the location of the control bodies in the Lviv region
Table 1. Surveillance points at the surface waters in the Western Bug river basin in the Lviv region
No. Name of the river Іtem observation Distance from the
mouth, кm
1. Western Bug c. Kamianka-Buzka 704
2. Western Bug Dobrotvirsky reservoir, lower
beef 689
3. Western Bug v. Stargorod 669
4. Western Bug c. Sokal 637
5.
Poltva River,
left tributary Western Bug
River
v. Kamyanopil 30
6.
Rata River,
left tributary Western Bug
River
uts. the Great
In the range of Poltva river in the Kamyanop-ol village of Pustomitivskiy district (below treat-ment facilities), low content of dissolved oxygen (0.78–2.78 mgO2/dm3 at MPC ≥ 4 mgO
2/dm3) as
well as the exceedance of the BOD5 limit values (5.17–19.68 times), COD (2.82–7.37 times), sus-pended solids (from 2.72 to 6.96 times), ammo-nium (6.1–50.9 times), nitrites up to 37, 25 times, phosphates (1.49–7.76 times), iron (2.8–8.4 times) and sulfates (up to 1.72 times) were observed.
The excessively high content of ammonia-cal nitrogen, phosphates, suspended solids, COD and BOD5 can be explained by the inflow of these pollutants from the sludge sites of the Lviv treat-ment plants with an area of 22 ha (2 million tons of sediment) (see Fig. 2). The wastewater collec-tion for settlements not connected to the sewage network is carried out in individual septic tanks or sinkhole, the sewage of which is not treated and can be one of the potential sources of pol-lution of aquifers and surface waters. In 2018, as compared to 2017, the discharge of pollutants BOD5, COD and suspended matter has reduced due to the reduction of the discharges volume and
improvement of the CBS-2 LMCC «Lvivvodo-kanal» operation.
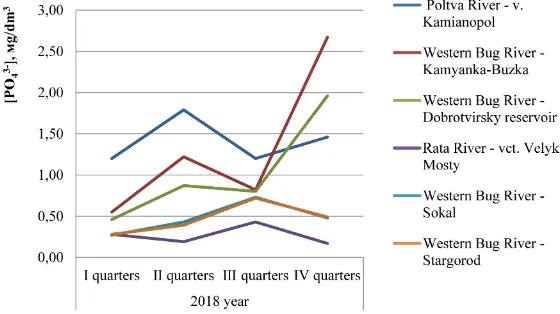
According to the nature of pollution, prelimi-nary conclusions about the source of the pollu-tion were drawn. If NH4+ ammonium ions are
found in the water but no NO2- and NO3- nitrates
are present, it indicates fresh contamination with faecal effluents. The water content of nitrites and nitrates demonstrates the contamination of the reservoir with organic substances. The high con-tent of nitrites and phosphates is explained by the highly concentrated domestic effluent containing detergents and cleanser items, as well as by the use of excessive fertilizers by agricultural farms in the spring (see Fig. 3). Such pollutants cause the active development of algae and plants (eu-trophication), as a consequence – a decrease in the concentration of dissolved oxygen in the hot period. Oxygen is known to be spent on breathing aquatic creatures and decomposing organic com-pounds. The dissolved oxygen deficiency causes destructive processes in any river ecosystem, and for the Poltva River it means that fish and other aquatic organisms cannot exist.
Table 2. Assessment of the surface water quality of the Lviv region according to the pollution factors
Range title The value of the pollution factor, quarterly QWO2
І, 2018 ІІ, 2018 ІІІ, 2018 ІV, 2018 І, 2019 ІІ, 2019 ІІІ, 2019
r. Western Bug –
c. Kamianka-Buzka 2.61 3.12 3.0 2.66 1.96 1.77 2.7 0.9
r. Western Bug –
c. Dobrotvir 1.88 2.16 2.26 2.70 0.9
r. Western Bug –
с. Starhorod 1.30 1.49 1.75 2.17 1.2
r. Western Bug –
c. Sokal 1.20 1.43 1.76 2.05 1.38 1.84 1.85 1.2
r. Poltva –
с. Kamyanopil 12.86 22.37 17.75 10.58 5.03 8.94 13.15 0.5
r. Rata –
uts. the Great Bridges 1.27 1.45 1.53 1.38 1.2
Fluctuations in the concentration of iron are clearly seasonal, which depends on the changes in nutrition (see Fig.4). During spring floods the concentration of iron increases along with the water content, while the mineralization of water (sulphates and suspended matter) decreases. Con-versely, in a limited period, mineralization sharp-ly increases to the maximum due to underground feeding, and the dissolved oxygen concentration decreases to a minimum.
In the range of «R. Western Bug – Kamian-ka-Buzka», the water was «moderately contami-nated», exceeded the maximum allowable levels of phosphates (up to 3.82 times) (see Fig.5), am-monium (from 5.42 to 11.72 times), BOD5 (up to 1.86 times), iron (from 1.6 to 5.9 times), nitrites (from 6.75 to 27.5 times), suspended solids (up to 2.64 times) and sulfates (up to 1.34 times). The water quality of the facility is influenced by the wastewater of the CE «Lvivvodokanal» through the Poltava River, as well as the wastewater of the Busk WSE.
At the «r. Western Bug – Dobrotvir town»
point of observation, the water was characterized
as «moderately polluted», the exceedance of the maximum allowable BOD5 standards (up to 2.62 times), ammonium (up to 13.16 times), ni-trites (from 4.25 to 19.75 times), phosphates (up to 4.53 times), iron (up to 3.3 times), suspended solids (up to 2.04 times) was recorded, as well as a slight excess in sulfates and COD. The compar-atively low water quality at the observation point is caused by the stagnation of water in the Do-brotvir reservoir and the impact of effluents from CE «Lvivvodokanal» across the river Poltva. The water quality at the range is affected by the waste-water of PJSC «Zakhidenergo», CE «Kamyanka-vodokanal» and unauthorized effluents.
In the left tributary of the Western Bug River,
r. Rata (uts. the Great Bridges), the water was «slightly polluted», its quality was better than that of other basins. The exceedance of the maximum permissible norms of nitrites (up to 4.25 times), iron (up to 7.4 times), nitrogen (up to 2.12 times) and minor excess of phosphates were found. The quality of water at the range is affected by the wastewater of Zhovkva through the r. Svynya and c. Rava-Ruska.
Fig. 3. Dynamics of changes in the concentrations of NH4+.
At the «r. Western Bug – Sokal city» point of observation, the water was characterized as «poorly polluted», the exceedance of maximum permissible norms of BOD5 (up to 1.55 times), am-monium (up to 3.38 times), nitrites (from 1.75 to 9.75 times), iron (from 1.3 to 3.7 times) and small increases in the concentrations of the suspended solids, sulfates, phosphates, COD were detected. The quality of water at the range is affected by the wastewater of CE «Chervonogradvodokanal».
At the «r. Western Bug – Stargorod village»
point of observation, the water was «slightly pol-luted». The exceedance of the maximum allowable BOD5 standards (up to 1.51 times), ammonium (up to 3.88 times), nitrites (from 1.25 to 10.25 times), iron (from 1.2 to 5.0 times) and (to a small extent) sulfates, phosphates, suspended solids were found. The quality of water at the point of observation is affected by the wastewater of c. Sokal.
It should be noted that in comparison with 2013–2015, the quality of water has deteriorated. In 2018, water intake in the basin from natural sources amounted to 70.22 million m3, but only
8.65 million m3 (only 12.3%) was collected from
surface water bodies.
According to the results of the monitor-ing studies, compared to the previous years (2013–2017), the water quality in the control bodies of the basin is deteriorating; therefore, it is necessary to urgently take measures to im-prove the ecological status of the Western Bug River basins. The author [Bezsonnyi 2019] refers to the main disadvantages of the existing surface water monitoring system, in particular, the inabil-ity of fast registration of water bodies or streams emergency contamination due to the lack of sys-tems for continuous control of the water quality characteristics.
Creating a web-based integrated system of real-time surface water quality monitoring us-ing mathematical simulation models, mappus-ing, GIS technologies, satellite remote sensing based on a stationary monitoring network is the main goal of ensuring the ecological safety of the aquatic ecosystem [Gunatilaka et al.; Qiaoling Chen et al. 2007].
In our opinion, one of the most effective mea-sures for the improvement of operation is to equip the control facilities with automated remote hy-drological posts (ARGP) and complexes (AGC) with autonomously operating equipment (contin-uously analysis of water, or with a given periodic-ity by 2–6 parameters) and the use of mobile lab-oratories (with the equipment for sampling and analysis of water in the field by 5 – 15 indicators).
CONCLUSIONS
1. The work of the State Agency of Ukraine for the implementation of EU standards in the field of water quality and water management during 2018–2019 has been analyzed.
2. The results of the analyses of the water sam-ples from the control structures of the Western Bug River in the Lviv region, conducted by the laboratory of the Lviv hydro-geological-recla-mation expedition on a quarterly basis during 2018, were presented. The Poltva River, after leaking from Lviv, is the most polluted river in the basin and is characterized as «very dirty». 3. Exceedance of the MPC in relation to BOD5
– 1.72 times. The main source of contamina-tion involves outdated Lvivvodokanal treat-ment plants and their sludge sites. The waters of all other years are classified as «moderately polluted» and «slightly polluted”. One of the ways to improve the work of the water basin management of the Western Bug River is to equip the control facilities with automated re-mote hydrological posts.
REFERENCES
1. Bilyk G., Koynova I. 2009. Impact of the munici-pal waste dumps on the ecosystem of the Western Bug river within Lviv district. Problems of water protection in the Bug and Narew river catchments. Monograph, Warszawa, 107–114.
2. Kojnowa I. 2007. Stan ekologiczny oraz
wykorzysta-nie zasobуw wodnych Bugu Zachodwykorzysta-niego. Zlewni
rzek Bugu i Narwi zasoby wodne i przyrodnicze:
Monografia, Warszawa, 27–34.
3. I. Koynova, I. Rozhko, N. Blazhko. 2012. Ecologi-cal threats to the valley of the Bug river (Lviv re-gion). Natural Human Environment. Dangers, pro-tection, education. Monograph, edited by Kazimierz H. Dygus. – Warszawa. 55–64.
4. Khilchevskyi V., Hrebin V., Zabokrytska M. 2016.
Otsinka hidrohrafichnoi merezhi raionu richkovoho
baseinu Visly (Zakhidnoho Buhu ta Sanu) na tery-torii Ukrainy zghidno typolohii Vodnoi Ramkovoi Dyrektyvy YeS [Assessment of the hydrographic network of the Vistula river basin (Western Bug and San) in the territory of Ukraine according to the typology of the EU Water Framework Direc-tive]. Hidrolohiia, hidrokhimiia i hidroekolohiia. T. 1 (40), 29–41. (in Ukrainian).
5. Nina Hagemann, Bernd Klauer, Ruby M. Moynihan, Marco Leidel, Nicole Scheifhacken. 2014. The role of institutional and legal constraints on river water quality monitoring in Ukraine. Environ Earth Sci DOI 10.1007/s12665–014–3307–5 Springer-Verlag Berlin Heidelberg. 72: 4745–4756.
6. Gopchak I., Basiuk T., Bialyk I., Pinchuk O., Ger-asimov I. 2019. Dynamics of changes in surface water quality indicators of the Western Bug River basin within Ukraine using GIS technologies. PAN in Warsaw; Journal of Water and Land Develop-ment. No. 42 (VII–IX), 67–75.
7. Khilchevskyi V., Hrebin V., Zabokrytska M., So-lovei T. 2016.Typolohiia richok y ozer ukrains-koi chastyny baseinu Zakhidnoho Buhu zghidno z vymohamy Vodnoi ramkovoi dyrektyvy YeS ta yii uzghodzhennia z doslidzhenniamy v Polshchi. Naukovyi visnyk Skhidnoievropeiskoho natsion-alnoho universytetu imeni Lesi Ukrainky. Zahalna
teoretychna, fizychna i konstruktyvna heohrafiia. № 14 (339), 16–24. (in Ukrainian).
8. Stratehiia natsionalnoi bezpeky Ukrainy (Тhe Na -tional Security Strategy of Ukraine). 2015. (Ukaz
Prezydenta Ukrainy № 287/2015 vid 26.05.2015 r.).
(in Ukrainian).
9. Dyrektyva 2000/60/EU (WFD). 2000. Pro vstanov-lennia ramok diialnosti Spivtovarystva v haluzi vod-noi polityky. URL: http://zakon5.rada.gov.ua/laws/ show/994_962. (in Ukrainian).
10. O. M. Klymchyk, T. V. Pinkina, A. A. Pinkin. 2018. Vprovadzhennia systemy intehrovanoho upravlin-nia vodnymy resursamy za baseinovym
pryntsy-pom. Scientific Journal «Science Rise» №4(45).
36–40. (in Ukrainian).
11. Upravlinnia dovkilliam ta intehratsiia ekolohichnoi polityky do inshykh haluzevykh polityk: korotkyi
opys Dyrektyv EU ta hrafiku yikh vprovadzhennia.
2014. K.: Yevropeiskyi Soiuz, URL: http://www.
if.gov.ua/files/uploads/Upravlinnya_ brochure_fi -nal.pdf. (in Ukrainian).
12. Zakon Ukrainy «Pro vnesennia zmin do de-iakykh zakonodavchykh aktiv Ukrainy shchodo vprovadzhennia intehrovanykh pidkhodiv v uprav-linni vodnymy resursamy za baseinovym
pryntsy-pom». 2016. Vidomosti Verkhovnoi Rady, № 46,
p.780. (in Ukrainian).
13. Postanova KMU № 758, 19.09.2018. Pro zat -verdzhennia Poriadku zdiisnennia derzhavnoho monitorynhu vod. (in Ukrainian).
14. Nakaz Minekolohii Ukrainy № 4, 19.01.2019.
Metodyka vyznachennia masyviv poverkhnevykh ta pryrodnykh vod. (in Ukrainian).
15. Nakaz Minekolohii Ukrainy № 5, 19.01.2019.
Metodyka vidnesennia masyvu poverkhnevykh vod do odnoho z klasiv ekolohichnoho ta khimichnoho staniv masyvu poverkhnevykh vod, a takozh vidne-sennia shtuchnoho abo istotno zminenoho masyvu poverkhnevykh vod do odnoho z klasiv ekolohich-noho potentsialu shtuchekolohich-noho abo istotno zmineekolohich-noho masyvu poverkhnevykh vod. (in Ukrainian). 16. Zabokrytska M.R., Khylchevskyi V.K., Manchenko
A.P., 2006. Hidroekolohichnyi stan baseinu richky Zakhidnyi Buh na terytorii Ukrainy. Monograph.
Kyiv. 184 р. (in Ukrainian).
17. Еdited by K. I. Herenchuk. 1972. Pryroda Lvivs -koi oblasti: Vydavnytstvo Lviv un-tu, 151 p. (in Ukrainian).
18. Baseinove upravlinnia vodnykh resursiv Zakhid-noho Buhu ta Sianu. Lviv. 2019. Richnyi zvit z py-tan upravlinnia vodnymy resursamy v subbasein-akh richok Zsubbasein-akhidnoho Buhu ta Sianu za 2018 rik. 75 p. (in Ukrainian).
19. Nakaz Derzhvodahentstva № 14, 10.02.2015.
Derzhvodahenstva Ukrainy kontroliu yakosti pover-khnevykh vod Lvivskoi oblasti. (in Ukrainian). 20. Nakaz Derzhvodahentstva № 6, 11.01.2018. Prohra
-ma provedennia derzhavnoho monitorynhu dovkillia richok Zakhidnoho Buhu ta Sianu v chastyni zdi-isnennia BUVR kontroliu yakosti poverkhnevykh vod Lvivskoi oblasti. (in Ukrainian).
21. KND 211.1.1.106–2003. Orhanizatsiia ta zdiisnen-nia sposterezhen za zabrudnenzdiisnen-niam poverkhnevykh vod v systemi Minekoresursiv. (in Ukrainian). 22. Postanova KMU № 552, 22.05.1996. Pro perelik
promyslovykh dilianok rybohospodarskykh vod-nykh obiektiv (ikh chastyn). (in Ukrainian). 23. V.L. Bezsonnyi. 2019. Monitorynh poverkhnevykh
dzherel vodopostachannia v umovakh vprovadzhen-nia Vodnoi Ramkovoi Dyrektyvy YeS. Komunalne
hospodarstvo mist, Tom 3, vypusk 149, 69–76. (in Ukrainian).
24. Amara Gunatilaka, Pompeo Moscetta, Luca
San-filippo. Recent Advancements in Water Quality
Monitoring – the use of miniaturized sensors and novel analytical measuring techniques for in-situ and on-line real time measurements. http://www. systea.it/Papers/Projects-systems/Gunatilaka%20 et%20al.%20%20Recent%20advance%20in%20
water%20monit%20sensors%20-%20final.pdf