Volume-6 Issue-2
International Journal of Intellectual Advancements
and Research in Engineering Computations
Land information system using geospatial technology (Essential
work flow QZGIS)
T.Revand
1, V.Nandhini
2, V.Santha Rubini
3, Mr.V.Sampath Kumar
4, Ms.N.Jothi Lakshmi
5 [email protected], [email protected], [email protected],[email protected], [email protected] UG Scholars1,2,3, Assistant Professors4,5
Department of Civil Engineering
Kongu Engineering College (Autonomous), Perundurai-638060.
Abstract: Nowadays, if we want to know details about any particular land then we need to approach government office to get the details which will take more time to identify the documents about that particular land. And it also consumes more time to calculate the tax for that land. GIS can help us in this issue. If we use GIS in Land information there is no need to approach the government officers. We can get details about that land within few minutes. The data in GIS will be more accurate than other documents. It is very much user friendly to get the details. It helps to make better coastal management. GIS also include decision making, data sourcing, data quality management, etc. Increase in efficiency of work. The locations can be accurately marked. The illegal acquisitions can be identified. Ground water table can be easily found. It is very easy application. Details can be easily included. Maps made are accurate. The tax will become easy. The zones can be separated by using old data. In military, it is used to identify the locations of terrorist camp and other country military camp. The GIS which is used by military will have lesser errors when compared to which we are using. In future, all countries will practice with GIS to mark the boundaries.
I. INTRODUCTION TO GIS
GIS is a collection of information which is used for viewing, analyzing, managing and displaying geographical data.GIS is a broad term that can refer toa number of different technologies, processes, and methods.It attached to many operations and has many applications related to engineering, planning,
management, transport/logistics, insurance, telecommunications, and business. In general, GIS allows users to search for information about specific geographical areas, analyze spatial information, edit the data and create
maps, charts and reports that show users the results in visual forms. GIS helps users to find answers to their questions and solve the problems by presenting data in simple visual ways. GIS can be the foundation for many location-enabled services that rely on analysis and visualization. GIS can relateunrelated information by using location as the key index variable. Locations or extents in the Earth space–time may be recorded as dates/times of occurance and x, y and z coordinates representing, longititude, latitude and elevation respectively. All Earth-based spatial–temporal location and extent references should be relatable to one another and ultimately to a ―real‖ physical location or extent. This key characteristic of GIS has begun to open new avenues of scientific inquiry. Modern GIS technologies use digital information, for which various digitized data creation methods are used. The most common method of data creation is digitization, where a hard copy map or survey plan is transferred into a digital medium through the use of a CAD program, and geo-referencing capabilities. With the wide availability of ortho-rectified imagery (from satellites, aircraft, Helikites and UAVs), heads-up digitizing is becoming the main avenue through which geographic data is extracted. Heads-up digitizing involves the tracing of geographic data directly on top of the aerial imagery instead of by the traditional method of tracing the geographic form on a separate digitizing tablet (heads-down digitizing).
II. STUDY AREA
We choose to do a project on ―Land Information System using GIS‖.
For this project we took ―Kongu Institution (Kongu Polytechnic College)‖ as a study area.
We feed some details about that institution which can easily editable.
The details which were provided are the following
Name of the Block
Principal Name
Area of the Block
Departments on that block
Head of Departments Name
Achievements on the academic side
Achievements on the sports side
No. of faculties
No. of laboratories
Bus Routes, etc,
III. LITREATURE REVIEW
We researched about the problems which can be changed by using the GIS and we referred many articles in internet about the GIS. We found this site http://gismaps.co.sangamon.il.us/tpv/ which is used by the foreign nations for providing detail of the particular parcel number, parcel address, parcel owner, etc, the parcels are done by using layout of that locality. In India, we can use the layout with survey number to do the parcels. Which will make easier to get the details of land.
Fig. 1. Details of a particular property
A. SOFTWARE USED
We used ―QGIS‖ software for marking the boundary of the institution, feeding the details about that institution, analyzing the area of the institution, etc,.
QGIS is open source software which is easy to work on it when compared to other paid software.
It consists of many plugins to analyze the study area.
It also used to measure length of the road, depth of the canal, contour of the terrain, etc,.
IV. METHODOLOGY
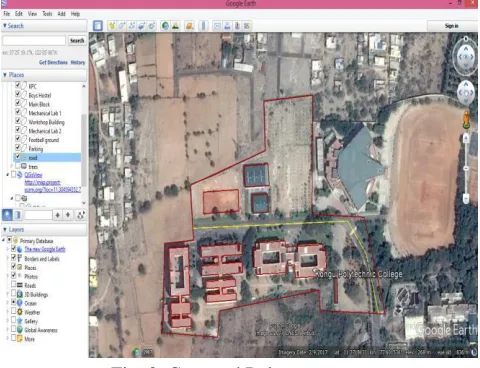
Use google earth view to locate the study site
Fig. 2. Kongu Polytechnic College in Google Earth
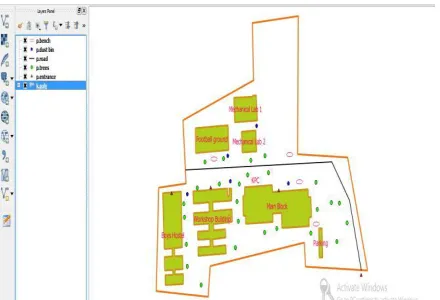
Use the following tools to mark the boundary of the study area and objects present in the study area Polygon (for Boundary & Buildings)
Line (for Roads)
Points (for Trees, Dustbins & Benches)
Click on Add Polygon tool to open the Google Earth – New Polygon window
For Name, type Building and click on the Style, Colour Tab
Start digitizing the polygon by clicking over it and once it is done click on OK to complete Similarly digitize the roads and point features
Save the markings within that folder. Then it will looks like
Save the folder in ―.kml‖ file.
Fig. 4.Saving the .kml file from Google Earth
Open the new QGIS. Add the marking which is in .kml format by using ―Add Vector Layer‖ option. Now change the .kml file to .shp file for further including & editing the details in attribute table & properties of the marking. By setting the CRS & choosing the folder where it wants to be saved. Now add the converted .shp file by using the Add Vector Layer option.
Open the attribute table.
Remove or Add required fields on the attribute table like Name, Area, etc,.
Add the names of the each building & boundary at Attribute table.
After adding the fields and names in the attribute table, it looks like
Fig. 5. Attribute table showing all the fields
Set the ―Label with‖ field as Name.
Fig. 6. Label property for .shp file Change the Style of the boundary markings. Give separate Style for buildings & whole boundary Then the Marking will be looks like as follows.
Fig. 7. After changed the style and label property
V. CARTOGRAPHY IN QGIS
A. OBJECTIVE
Map production is the process of arranging map elements on a sheet of paper in a way that, even without many words, the average person can understand what it is all about. Maps are usually produced for presentations and reports where the audience or reader is a politician, citizen or a learner with no professional background in GIS. Because of this, a map has to be effective in communicating spatial information. Common elements of a map are the title, map body, legend, north arrow, scale bar, acknowledgement, and map border
B. MAP LAYOUT
Open QGIS. Click on Project Menu ‣ Open Project
From the project menu click on New print composer to open the Composer title
Name the new composer as Template A8 and click on OK button to open the composer window
The new print composer will be look as follows
In the Print Composer window, click on Zoom full to display the full extent of the Layout
Click on the Add new map button
Once the Add Map button is active, hold the left mouse button and drag a rectangle where you want to insert the map
Rectangle box will be created to the map layout, adjust the rectangle box accordingly
Use the move item content tool and adjust the map accordingly, Map size can be increased by
making changes in the scale (don’t use the zoom in button)
A.ADDING NORTH ARROW
Map composer has got fine collection of images; we will add the north arrow by using it
From the Layout menu, select Add Image tool holding your left mouse button, draw a rectangle on the top-right corner of the map canvas
After adding the box, under item properties you can see under directories have been loaded with images
From the image a select North arrow of your choice by clicking on it.
B.ADDING SCALE BAR
Similarly under the layout menu, select the Add scale bar tool and Click on the layout where you want the scale bar to seem. From the Item Properties tab, choose the Style that fit your requirement
Modify the units as Map units and label it
‘Degree’ since the map units are in degrees. Uncheck the Background option, so that it is transparent
C.ADD LEGEND
From the layout menu, select add legend tool and click anywhere on the map to add the legend
Select the added legend by clicking on it, drag it to the bottom right of the map
Customize the legend using the options that are available under item properties
D.ADD MAP TITLE
Let us add the title of the map, by using the layout menu and use the add label tool Using the skills that you have acquired so far,
add it and Name the Map.
Also set up a frame for the map by clicking on the Map canvas and under item properties, check the option for frame
E.ADDING GRIDS
Adding Grids with Longitudes and Longitudes to the map make readers to understand more about the location
Select the map canvas by clicking on it, under item properties scroll down and expand the Grids
Click on the + sign button to add a new Grid and by default it will be name it as Grid 1
Scroll down for more options and assign the following
For Grid Type select Cross, Set the Interval units to map unit
Assign the intervals for X and Y as 2
Scroll down and check the option for Draw coordinates
Once you are gratified with the map, you can export it as Image, PDF or SVG. Here we can export it as an image
From the composer window, select export as image option and navigate.
Name your map and select JPEG as output format and click on save
Once complete click on save option for the QGIS map document and exit QGIS
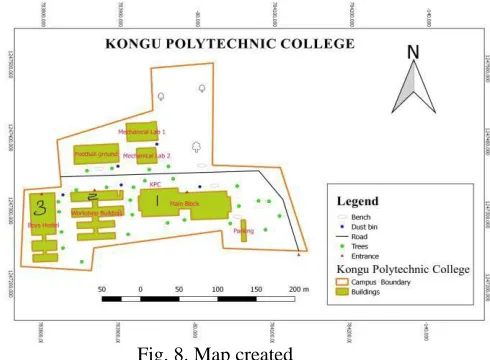
F.Created Map
The map has been created for Kongu Polytechnic College with the scale ratio, direction, longitude and latitude & legend showing the details of the map objects. The map for KPC is as follows
VI. ANALYSIS A. AREA
Calculate the Area of each Building & whole Boundary by using the field calculator.
Fig. 9. Calculating the Area of the Boundaries
B. LENGTH
And also calculate the length of the roads by using same field calculator.
Fig. 10. Calculating the Length of the Roads
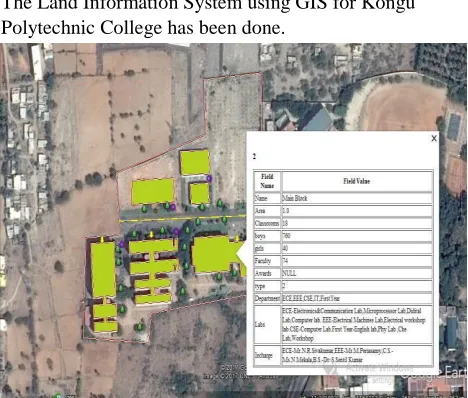
RESULT
The Land Information System using GIS for Kongu Polytechnic College has been done.
Fig. 11. The final view of KPC
References
http://gismaps.co.sangamon.il.us/tpv/
http://gisgeography.com/what-gis-geographic- information-systems/
http://researchguides.library.vanderbilt.edu/gis Working with Google EarthUsing Quantum GIS-ID: IGET_GIS_012