The Cryosphere, 6, 891–899, 2012 www.the-cryosphere.net/6/891/2012/ doi:10.5194/tc-6-891-2012
© Author(s) 2012. CC Attribution 3.0 License.
The Cryosphere
Drifting snow climate of the Greenland ice sheet:
a study with a regional climate model
J. T. M. Lenaerts1, M. R. van den Broeke1, J. H. van Angelen1, E. van Meijgaard2, and S. J. Déry3 1Institute for Marine and Atmospheric research Utrecht, Utrecht University, Utrecht, The Netherlands 2Royal Netherlands Meteorological Institute, De Bilt, The Netherlands
3University of Northern British Columbia, Prince George, Canada
Correspondence to: J. T. M. Lenaerts ([email protected])
Received: 20 March 2012 – Published in The Cryosphere Discuss.: 3 May 2012 Revised: 18 July 2012 – Accepted: 3 August 2012 – Published: 15 August 2012
Abstract. This paper presents the drifting snow climate of the Greenland ice sheet, using output from a high-resolution (∼11 km) regional climate model. Because reliable direct observations of drifting snow do not exist, we evaluate the modeled near-surface climate instead, using automatic weather station (AWS) observations from the K-transect and find that RACMO2 realistically simulates near-surface wind speed and relative humidity, two variables that are impor-tant for drifting snow. Integrated over the ice sheet, drifting snow sublimation (SUds) equals 24±3 Gt yr−1, and is signif-icantly larger than surface sublimation (SUs, 16±2 Gt yr−1). SUdsstrongly varies between seasons, and is only important in winter, when surface sublimation and runoff are small. A rapid transition exists between the winter season, when snowfall and SUds are important, and the summer season, when snowmelt is significant, which increases surface snow density and thereby limits drifting snow processes. Drifting snow erosion (ERds) is only important on a regional scale. In recent decades, following decreasing wind speed and ris-ing near-surface temperatures, SUdsexhibits a negative trend (0.1±0.1 Gt yr−1), which is compensated by an increase in SUsof similar magnitude.
1 Introduction
The Greenland ice sheet (GrIS) is the largest body of ice in the Northern Hemisphere, containing approximately 7 m sea level equivalent (IPCC AR4). In the last two decades, nu-merous Greenland outlet glaciers have accelerated and sur-face mass balance (SMB) has declined (Rignot et al., 2011),
both contributing about equally to recent Greenland mass loss (Van den Broeke et al., 2009). The volume loss of out-let glaciers may be primarily related to oceanic warming (Holland et al., 2008), but the interaction between ocean and outlet glaciers is complex (Nick et al., 2009; Straneo et al., 2011). At the same time, Greenland has experienced signif-icant atmospheric warming in the recent two decades (Box and Cohen, 2006), increasing surface meltwater production and subsequent runoff (Ettema et al., 2009), extending the length of the melt season (Fettweis et al., 2011) and trigger-ing the melt-albedo feedback (Tedesco et al., 2010).
892 J. T. M. Lenaerts et al.: Greenland drifting snow climate
Here we present the drifting snow climate (1960–2011) of the Greenland ice sheet using a regional atmospheric cli-mate model (RACMO2) at relatively high horizontal resolu-tion (11 km). RACMO2 includes an interactive drifting snow routine (Lenaerts et al., 2012a). We discuss the spatial and temporal variability of SUds and ERds and their impact on the SMB of the GrIS.
2 Methods
2.1 Numerical setup
The Regional Atmospheric Climate MOdel version 2 (RACMO2 hereafter; Van Meijgaard et al., 2008) com-bines the dynamical parameterizations from the HIgh Reso-lution Limited Area Model (HIRLAM) (Undén et al., 2002) with the physical schemes from the European Centre for Medium-Range Weather Forecasts model (ECMWF cycle 23r4, White, 2001). In recent years, RACMO2 has been used to estimate the SMB of Antarctica (Van de Berg et al., 2005; Lenaerts et al., 2012b) and Greenland (Ettema et al., 2009). Modeled precipitation and surface mass balance have been extensively evaluated using available in-situ observa-tions (Ettema et al., 2009). Moreover, Ettema et al. (2010b) showed that RACMO2 provides a realistic simulation of the near-surface climate of the GrIS, although several deficien-cies were detected, especially in the snow albedo scheme. To resolve this, we included a snow albedo parameteriza-tion based on the growth of snow during dry and wet meta-morphosis, so that snow albedo can be physically coupled to snow grain size (Flanner and Zender, 2006). This signif-icantly improved net shortwave radiation in RACMO2 over the Antarctic ice sheet (Kuipers Munneke et al., 2011) and the length of the melt season in Greenland (Van Angelen et al., 2012). In addition, a remote sensing-derived back-ground albedo (from the Moderate Resolution Imaging Spec-troradiometer, MODIS) is prescribed for ice (Van Angelen et al., 2012) to capture the spatial variability of albedo in the ablation area when the winter snow has melted (Van den Broeke et al., 2008). Finally, the drifting snow scheme derived from Déry and Yau (1999) has been included in RACMO2. It calculates drifting snow transport and subli-mation, and accounts for interactions between the drifting snow layer with both the overlying atmosphere and the un-derlying snow surface (Lenaerts et al., 2010). Furthermore, we use an empirically derived parameterization for surface snow density. This was derived by Lenaerts et al. (2012a) for Antarctica, such that modeled drifting snow frequency and horizontal transport agree well with available in-situ and re-mote sensing observations (Lenaerts et al., 2012a).
For the GrIS, RACMO2 has 40 levels in the vertical and the model grid has a horizontal spacing of ∼11 km. It is forced at its lateral boundaries by ECMWF reanaly-ses, ERA-40 (1960–1988) and ERA-Interim (1989–2011), at
8 J. T. M. Lenaerts et al.: Greenland drifting snow climate
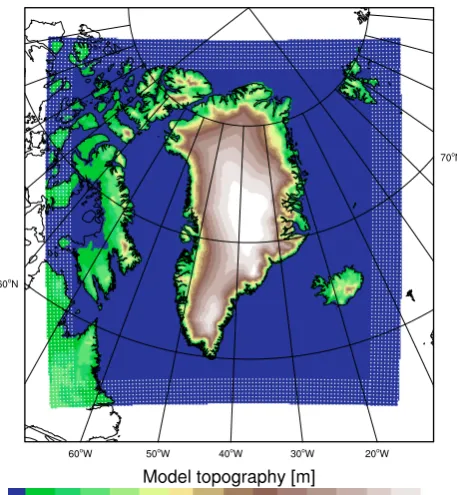
Fig. 1.Overview of model domain. Model topography is shown in colors, blue represents ocean. The white dotted boundary represents the model relaxation zone (24 grid points).
Fig. 1. Overview of model domain. Model topography is shown in colors; blue represents ocean. The white dotted boundary represents the model relaxation zone (24 grid points).
a 6-hourly resolution. The atmospheric fields from the re-analyses are relaxed towards true model resolution (11 km) in the relaxation zone (see Fig. 1). Sea surface temperature (SST) and sea ice extent are prescribed as a surface bound-ary condition by the reanalyses. Within the interior model domain, RACMO2 evolves freely.
2.2 Model evaluation
J. T. M. Lenaerts et al.: Greenland drifting snow climate 893
J. T. M. Lenaerts et al.: Greenland drifting snow climate 9
Fig. 2. (B–D)Comparison of 10mwind speed frequency distribu-tions from RACMO2 (red) and from observadistribu-tions (black), based on daily averages from the period 2003-2010 at 3 AWS stations along the K-transect. AWS locations are shown in panel(A), including the mean modeled (background) and observed (dots) 10mwind speed.
Fig. 2. (B–D) Comparison of 10 m wind speed frequency distribu-tions from RACMO2 (red) and from observadistribu-tions (black), based on daily averages from the period 2003–2010 at 3 AWS stations along the K-transect. AWS locations are shown in panel (A), including the mean modeled (background) and observed (dots) 10 m wind speed.
Table 1. Comparison statistics between RACMO2 and observations presented by Ettema et al. (2010a). Shown are annual mean 2 m temperature (T2m), 10 m wind speed (U10m) and 2 m specific hu-midity (q2m).
Units R Bias RMSE
T2ma K 0.97 −0.8 2.3 U10ma m s−1 0.74 0.3 1.9 q2mb g kg−1 0.98 −0.1 0.3
aComparison based on 68 stations (GC-net: 15 stations, IMAU: 3 stations and DMI: 51 stations (Ettema et al., 2010a)).bBased on daily averages of the year 2004 at IMAU station S6 (67◦040N, 49◦240W).
these determine relative humidity, which in turn determines the potential for drifting snow sublimation (Lenaerts et al., 2010). The model evaluation is presented in the next section.
3 Results
3.1 Near-surface climate
Ettema et al. (2010a) thoroughly evaluated the near-surface climate of RACMO2, and found good agreement between model and observations. Their results are summarized in Ta-ble 1. A high correlation between modeled and observed
10 J. T. M. Lenaerts et al.: Greenland drifting snow climate
Fig. 3. Relative humidity with respect to ice at 2 m in January and February 2009 at the location of AWS S9. ObservedRHice
is drawn in black, the RACMO2 simulation without drifting snow (from Ettema et al., 2010a) in green and RACMO2 with drifting snow in red. The red crosses at the top indicate whenSUdsoccurs
in RACMO2.
Fig. 3. Relative humidity with respect to ice at 2 m in January and February 2009 at the location of AWS S9. Observed RHiceis drawn in black, the RACMO2 simulation without drifting snow (from Et-tema et al., 2010a) in green and RACMO2 with drifting snow in red. The red crosses at the top indicate when SUdsoccurs in RACMO2.
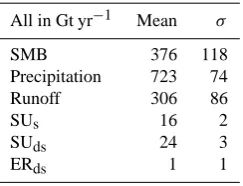
Table 2. Mean (1960–2011) and standard deviation (square root of the interannual variability) of ice sheet-integrated values (Gt yr−1) of the SMB and its components.
All in Gt yr−1 Mean σ
SMB 376 118
Precipitation 723 74
Runoff 306 86
SUs 16 2
SUds 24 3
ERds 1 1
near-surface temperature (T2m) is found. The negative bias, which is mainly confined to the winter season, is attributed to an underestimation of downward longwave radiation (Et-tema et al., 2010a). Considering that, especially for coastal stations, 10 m wind speed is greatly influenced by local to-pography that may not always be properly represented by RACMO2, the agreement between model and observations is good. High wind speeds that drive drifting snow are also well represented by RACMO2 and no clear underestimation is seen, so the model resolution appears sufficient to rep-resent local wind climates on the ice sheet (Ettema et al., 2010a).
894 J. T. M. Lenaerts et al.: Greenland drifting snow climate
J. T. M. Lenaerts et al.: Greenland drifting snow climate 11
Fig. 4. Mean (1960–2011) modeled(A)surface mass balance (mmw.e.yr−1),(B)surface snow density (kgm−3),(C)friction
velocity (ms−1),(D)2 m temperature (K) and(E)2 m relative
hu-midity w.r.t. ice (–).
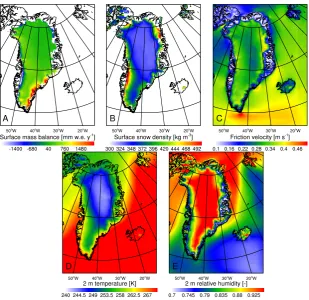
Fig. 4. Mean (1960–2011) modeled (A) surface mass balance (mm w.e.yr−1), (B) surface snow density (kg m−3), (C) friction velocity (m s−1), (D) 2 m temperature (K) and (E) 2 m relative humidity w.r.t. ice (–).
slopes in rough topography that are not fully resolved by the model.
Daily mean near-surface specific humidity at S6 (Ta-ble 1) is well represented in RACMO2. At S9, however, where drifting snow occurs frequently, relative humidity is found to be underestimated in RACMO2 simulations with-out the drifting snow rwith-outine (Fig. 3). Including drifting snow physics strongly reduces the negative bias (Fig. 3), especially during drifting snow sublimation events. The mean bias dur-ing the period shown in Fig. 3 decreases from 13 % to 7 %, and the RMSE reduces from 15 % to 9 %. The reason for this improvement is that water vapor is added to the surface layer in response to SUds, increasing relative humidity in the sur-face layer. We conclude that it is currently hard to evaluate drifting snow in the absence of reliable direct measurements. However, indirect evidence suggests that the occurrence of drifting snow and its effect on the near-surface atmosphere are well captured.
Figure 4a–f present the mean fields of the (near-surface) climate parameters that are important for drifting snow (sub-limation). The surface mass balance (SMB, Fig. 4a) is nega-tive (<−500 mm w.e.) along major portions of the margins, indicating that, on an annual basis, surface runoff from snow-and icemelt exceeds the input of precipitation. This results in the exposure of bare glacier ice during a part of the year. On
the other hand, the southeastern marginal zones are charac-terized by strong precipitation, and have a positive annual SMB of>1 m w.e. The inland regions of the ice sheet are drier, but also exhibit less or no snowmelt; hence SMB>0. The occurrence of surface melt is also reflected in the sur-face snow density (ρs, Fig. 4b). Melt strongly increases the densification rate of the snowpack (Wakahama, 1975). This, in turn, limits the onset of drifting snow. Lenaerts et al. (2012a) show that, for a surface snow density increasing from 300 to 500 kg m−3, the associated threshold friction velocity for drifting snow (u∗,t) increases from 0.4 to 1.2 m s−1, the latter which, for a typical surface roughnessz0of 1 mm, rep-resents a 10 m wind speed of>30 m s−1.
J. T. M. Lenaerts et al.: Greenland drifting snow climate12 J. T. M. Lenaerts et al.: Greenland drifting snow climate 895
Fig. 5. Mean drifting snow frequency(A), transport(B), subli-mation(C)and erosion(D). Drifting snow frequency is defined as the fraction of days with accumulatedTRdsof 3kgm−1. Dashed-dotted lines represent the topography with 500mintervals.
Fig. 5. Mean drifting snow frequency (A), transport (B), sublima-tion (C) and erosion (D). Drifting snow frequency is defined as the fraction of days with accumulated TRdsof 3 kg m−1. Dashed-dotted lines represent the topography with 500 m intervals.
density of 332 kg m−3 (Zwally and Li, 2002). RACMO2 agrees very well with these observations, and gives a mean
ρs in July of 330 kg m−3 in this region (Fig. 4b). Another way to assess model performance is to investigate how well the model captures the transition from winter (no melt) and summer (melt) season, as melt-induced densification limits the occurrence of drifting snow. Fettweis et al. (2011) and Van Angelen et al. (2012) show that RACMO2 is able to well simulate the onset, duration and extent of melt on the Green-land ice sheet. Although indirect evidence, this indicates that the timing and phase of the drifting snow season is well cap-tured by the model.
Figure 4c shows the mean friction velocity, the parame-ter that combines the near-surface wind speed and surface roughness (Schmidt, 1981), (Li and Pomeroy, 1997). When the friction velocity exceeds the threshold friction velocity (u∗,t), drifting snow is initiated. The highest average fric-tion velocities are found in the northeastern part of the ice sheet, where katabatic forcing is largest (Van Angelen et al., 2011), along the western coast, where katabatic and synop-tic forcing lead to a persistent southerly jet (Van Angelen et al., 2011), and in southern Greenland, which is under the frequent influence of midlatitude cyclones. The near-surface temperature and relative humidity are shown in Fig. 4d and
Fig. 6. Mean (1960–2011) SUds and TRds on all ice sheet grid points (∼14 000 points) as a function of mean 10 m wind speed (red), 2 m relative humidity with respect to ice (blue) and surface snow density (green).
e, respectively. Evidently, near-surface temperature is largely determined by elevation. The highest temperatures are found along the coastline, where above-zero temperatures occur regularly in summer. Due to the low temperatures, RHi is very high (>95 %) on higher portions of the ice sheet (>
2000 m), limiting the potential for SUds, whereas the near-surface air is less saturated at lower altitudes, where kata-batic (downslope) winds give rise to adiakata-batic warming and subsequent drying of the near-surface air.
3.2 Drifting snow climate 3.2.1 Spatial variability
Figure 5a–d present the mean annual drifting snow fre-quency, transport, SUds, and ERds. Drifting snow occurs on the entire ice sheet (Fig. 5a), with frequencies ranging from<20 % in highly elevated regions, where calm condi-tions prevail, up to 50 % and more in coastal areas. High-est drifting snow frequencies are found along the north-eastern, southeastern and western margins, where the sur-face snow density is relatively low (Fig. 4b) and mean wind speeds are highest (Fig. 4c). Horizontal transport of drifting snow (shown as a scalar in Fig. 5a) varies from less than 0.5×10⁶kg m−1yr−1 on the ice sheet plateau to
896 J. T. M. Lenaerts et al.: Greenland drifting snow climate
14 J. T. M. Lenaerts et al.: Greenland drifting snow climate
Fig. 7.Mean (1960–2011) annual cycle (January–December) of snowfall (left axis) andSUds,SUsand runoff (right axis), all in (Gtyr−1
) and their temporal standard deviation (square root of in-terannual variability, vertical bars denote2σ). The horizontal black line represents 0Gtyr−1on the right axis.
Fig. 7. Mean (1960–2011) annual cycle (January–December) of snowfall (left axis) and SUds, SUs and runoff (right axis), all in Gt yr−1 and their temporal standard deviation (square root of in-terannual variability; vertical bars denote 2σ). The horizontal black line represents 0 Gt yr−1on the right axis.
(Van Angelen et al., 2011), leading to drifting snow erosion (10–40 mm yr−1; see Fig. 5b), whereas net snow deposition occurs closer to the coast, where near-surface winds gener-ally slow down. Patterns of alternating erosion/deposition oc-cur where regional topography is strongly concave/convex, for example in the northwest (82◦N, 50–60◦W). The non-linear nature of drifting snow is evident from Fig. 6. Both SUdsand TRdsstrongly depend on wind speed, but SUdsis limited when the surface layer becomes saturated. Drifting snow sublimation is therefore most active in relatively warm, windy and dry (in terms of relative humidity) regions.
Table 2 shows the ice-sheet integrated values of the SMB and its components. The 1960–2011 mean SMB of the Greenland ice sheet is estimated at 376±118 Gt yr−1. This estimate is comparable to other recent GrIS SMB es-timates that are assembled by Rae et al. (2012), which are mostly in the range 320–450 Gt yr−1. Surface mass bal-ance is largely determined by the mass input from pre-cipitation (732±74 Gt yr−1) and the mass loss via runoff (306±86 Gt yr−1). The mass loss through sublimation is of secondary importance on Greenland. The total sublima-tion (SUds+SUs) equals 40±4 Gt yr−1. SUds is responsi-ble for 60 % of the total sublimation (24±3 Gt yr−1), and 16±2 Gt yr−1is lost via surface sublimation. Compared to a simulation without drifting snow (Ettema et al., 2009), total sublimation has increased by more than 40 %, although SUs is 40 % lower; hence, including SUds reduces SUs, but in-creases total sublimation. Integrated over the ice sheet, SUds is clearly smaller than runoff, and contributes 7 % to the to-tal ablation on Greenland. In comparison, SUds is estimated to be responsible for∼75 % of the ablation in Antarctica (Lenaerts et al., 2012b), which highlights the large difference
J. T. M. Lenaerts et al.: Greenland drifting snow climate 15
Fig. 8. Number of drifting snow days (withSUds>0) per year and number of days with snow density of the upper 5 cm of the snowpack (ρs) greater than 400kgm−3. White dashes indicate
ar-eas with a standard deviation>30days.
Fig. 8. Number of drifting snow days (with SUds>0) per year and number of days with snow density of the upper 5 cm of the snow-pack (ρs) greater than 400 kg m−3. White dashes indicate areas with a standard deviation>30 days.
in near-surface climate between the two ice sheets. The in-fluence of ERds on the Greenland surface mass balance is small (1±1 Gt yr−1). Despite their relatively small effect on ice sheet integrated SMB, drifting snow processes (SUdsand ERds) attribute largely to the local surface mass balance in relatively dry, windy regions of the Greenland ice sheet. Lo-cally, they remove up to 50 % of the precipitated snow (not shown).
3.2.2 Seasonal variability
All SMB components, apart from snowfall, show a clear seasonal cycle (Fig. 7). Snowfall is on average largest in early winter (September–November). Runoff and SUs peak in summer, whereas SUdsis most significant in winter. It is larger than runoff during 7 months and larger than SUs dur-ing 8 months of the year. In the winter months (December– February), SUdsremoves∼6 % of the snowfall.
Figure 8 shows the mean number of drifting snow days per year. Drifting snow occurs on 120–180 days in the west-ern katabatic wind zone, and locally on>200 days in the north-east. The latter region not only experiences the highest katabatic wind speeds (Van Angelen et al., 2011), but also has a relatively short melt season (see Fig. 8), keepingρsand
u∗,t relatively low.
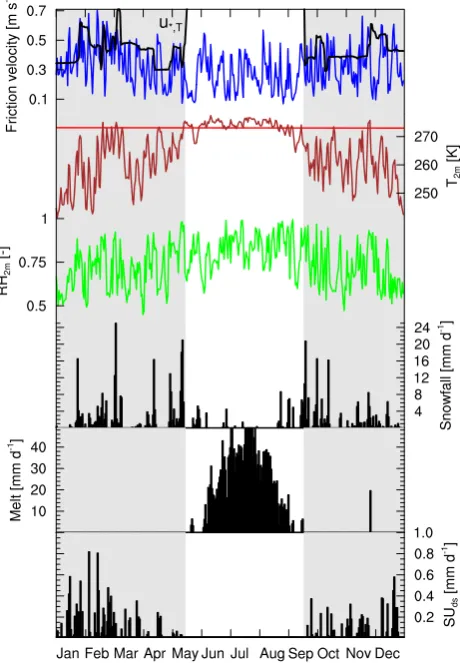
An example of the transition from drifting snow sea-son to melt seasea-son is shown in Fig. 9. It shows the an-nual cycle (year 2005) of drifting snow-related variables at S6, located in the ablation zone of the western ice sheet (Van den Broeke et al., 2008). In winter (January–May and October–December), the friction velocity (u∗) often exceeds
the threshold (u∗,t, which depends on the density of the top snow layer, Gallée et al., 2001). The top snow layer is fre-quently refreshed by lower-density fresh snow, which keeps
J. T. M. Lenaerts et al.: Greenland drifting snow climate 897
16 J. T. M. Lenaerts et al.: Greenland drifting snow climate
Fig. 9.Modeled annual cycle (2005) at S6 (67◦50N, 49◦230W)
of daily mean friction velocity (blue) and its threshold (black, see text), 2 m temperature (the freezing point is illustrated by the hori-zontal red line) and relative humidity, daily accumulated snowfall, snowmelt and drifting snow sublimation. The grey areas represent the drifting snow season (see text).
Fig. 9. Modeled annual cycle (2005) at S6 (67◦50N, 49◦230W) of daily mean friction velocity (blue) and its threshold (black, see text), 2 m temperature (the freezing point is illustrated by the hori-zontal red line) and relative humidity, daily accumulated snowfall, snowmelt and drifting snow sublimation. The grey areas represent the drifting snow season (see text).
warm episodes in winter,u∗,tincreases because of snowmelt. This strongly enhancesρs, preventing drifting snow to occur. This illustrates the strong feedback between the length of the melt season, snow surface conditions and length of the drift-ing snow season in Greenland.
3.2.3 Interannual variability and trends
Interannual variability in SUds is clearly related to interan-nual variability in near-surface wind speed (correlation coef-ficientr=0.91). Years with high SUds (for example 1996) are characterized by a anomalously high near-surface wind speed and, to a lesser extent, temperature. Interestingly, the areas with the largest inter-annual variability of drifting snow frequency (Fig. 8, white dashed areas) coincide with regions where year-to-year variations in the extent of the ablation season are also largest.
J. T. M. Lenaerts et al.: Greenland drifting snow climate 17
Fig. 10. Interannual variability (1960–2011) of GrIS integrated SUds(blue bars) andSUs(black bars), combined with the normal-ized anomaly of GRis averaged 10mwind speed (U10m, green) and 2 m temperature (T2m, red). The 1990–2011 linear trends are depicted by the dashed lines.
Fig. 10. Interannual variability (1960–2011) of GrIS integrated SUds(blue bars) and SUs(black bars), combined with the normal-ized anomaly of GRis averaged 10 m wind speed (U10m, green) and 2 m temperature (T2m, red). The 1990–2011 linear trends are depicted by the dashed lines.
RACMO2 suggests that, in the period 1960–1990, near-surface temperature (−0.03±0.02 K yr−1) and wind speed (0±0.003 m s−1yr−1) trends were insignificant. Since 1990, however, following a rise in atmospheric temperatures, melt-water runoff has been increasing (Ettema et al., 2009), only partly compensated by increased snowfall (Van den Broeke et al., 2009), which led to a strong decline in SMB. Fig-ure 9 shows the recent trend of SUdsand SUs. Since 1990, SUdshas decreased at a rate of−0.1±0.1 Gt yr−2, following a 10 m wind speed decrease of−0.009±0.005 m s−1yr−1 (Fig. 10) and the increased length of the summer season over Greenland (0.6±0.9 days yr−2). The large uncertainty in the trend of SUds is due to strong interannual variabil-ity, and a longer time series is required to reach signif-icance at a 95 % level. The decline in SUds is compen-sated by a significant increase in SUs(+0.09±0.09 Gt yr−2), which is related to the less frequent occurrence of drifting snow in combination with the higher near-surface tempera-ture (+0.09±0.03 K yr−1).
4 Conclusions
898 J. T. M. Lenaerts et al.: Greenland drifting snow climate
We evaluated the results in terms of the near-surface cli-mate in further detail, because a direct evaluation of the drifting snow climate is not feasible. RACMO2 shows re-alistic wind speed spectra along the K-transect. Further-more, we showed that, during drifting snow, SUdsenhances near-surface relative humidity, which improves the agree-ment with observations. Unfortunately, because no reliable direct observations of drifting snow transport or frequency are available for Greenland, we are presently unable to ex-plicitly/directly evaluate and/or further improve the drifting snow model.
The results show that drifting snow in Greenland is not significant during summer, when near-surface wind speeds are lower and surface snow density and associated thresh-old friction velocity increase due to melt, which suppresses drifting snow to occur. In winter, during 7 months of the year, SUds is the only important ablation mechanism, re-moving ∼6 % of the precipitation during this period. In summer, SUds is negligible, and meltwater runoff becomes the primary ablation component. Integrated over the Green-land ice sheet, SUdsequals 24 Gt yr−1, 50 % larger than SUs (16 Gt yr−1). Although the contribution of drifting snow ero-sion (ERds) to the surface mass balance is negligible on the ice sheet, it is locally of importance, especially in areas where topographic features induce strong wind field diver-gence/convergence. An abrupt transition occurs between the melting season in summer, when drifting snow is strongly suppressed, and the drifting snow season, when light, fresh snow is prone to drifting.
Acknowledgements. We thank the editor, R. Dadic and an
anonymous reviewer for their helpful comments. This work was supported by funding from the ice2sea programme from the Eu-ropean Union 7th Framework Programme, grant number 226375. Ice2sea contribution number 092.
Edited by: V. Radic
References
Bintanja, R.: Modelling snowdrift sublimation and its effect on the moisture budget of the atmospheric boundary layer, Tellus A, 53, 215–232, 2001.
Bolzan, J. F. and Strobel, M.: Accumulation-rate variations around Summit, Greenland, J. Glaciol., 40, 56–66, 1994.
Box, J. E. and Cohen, A. E.: Upper-air temperatures around Greenland: 1964–2005, Geophys. Res. Lett., 33, L12706, doi:10.1029/2006GL025723, 2006.
Box, J. E., Bromwich, D. H., Veenhuis, B. A., Bai, L. S., Stroeve, J. C., Rogers, J. C., Steffen, K., Haran, T., and Wang, S. H.: Greenland ice sheet surface mass balance variabil-ity (1988–2004) from calibrated polar MM5 output, J. Climate, 19, 2783–2800, 2006.
Cierco, F.-X., Naaim-Bouvet, F., and Bellot, H.: Acoustic sen-sors for snowdrift measurements: how should they be used
for research purposes?, Cold Reg. Sci. Technol., 49, 74–87, doi:10.1016/j.coldregions.2007.01.002, 2007.
Déry, S. J. and Yau, M. K.: A bulk blowing snow model, Bound.-Lay. Meteorol., 93, 237–251, 1999.
Déry, S. J. and Yau, M. K.: Large-scale mass balance effects of blowing snow and surface sublimation, J. Geophys. Res., 107, 4679, doi:10.1029/2001JD001251, 2002.
Ettema, J., van den Broeke, M. R., van Meijgaard, E., van de Berg, W. J., Bamber, J. L., Box, J. E., and Bales, R. C.: Higher surface mass balance of the Greenland ice sheet revealed by high-resolution climate modeling, Geophys. Res. Lett., 36, L12501, doi:10.1029/2009GL038110, 2009.
Ettema, J., van den Broeke, M. R., van Meijgaard, E., van de Berg, W. J., Box, J. E., and Steffen, K.: Climate of the Greenland ice sheet using a high-resolution climate model – Part 1: Evaluation, The Cryosphere, 4, 511–527, doi:10.5194/tc-4-511-2010, 2010a.
Ettema, J., van den Broeke, M. R., van Meijgaard, E., and van de Berg, W. J.: Climate of the Greenland ice sheet using a high-resolution climate model – Part 2: Near-surface climate and energy balance, The Cryosphere, 4, 529–544, doi:10.5194/tc-4-529-2010, 2010b.
Fettweis, X.: Reconstruction of the 1979–2006 Greenland ice sheet surface mass balance using the regional climate model MAR, The Cryosphere, 1, 21–40, doi:10.5194/tc-1-21-2007, 2007. Fettweis, X., Tedesco, M., van den Broeke, M., and Ettema, J.:
Melting trends over the Greenland ice sheet (1958–2009) from spaceborne microwave data and regional climate models, The Cryosphere, 5, 359–375, doi:10.5194/tc-5-359-2011, 2011. Flanner, M. and Zender, C.: Linking snowpack microphysics
and albedo evolution, J. Geophys. Res., 111, D12208, doi:10.1029/2005JD006834, 2006.
Gallée, H., Guyomarch, G., and Brun, E.: Impact of snow drift on the Antarctic Ice Sheet surface mass balance: possible sensitiv-ity to snow-surface properties, Bound.-Lay. Meteorol., 99, 1–19, 2001.
Hanna, E., Huybrechts, P., Janssens, I., Cappelen, J., Steffen, K., and Stephens, A.: Runoff and mass balance of the Green-land Ice Sheet: 1958–2003, J. Geophys. Res., 110, D13108, doi:10.1029/2004JD005641, 2005.
Holland, D. M., Thomas, R. H., de Young, B., Ribergaard, M. H., and Lyberth, B.: Acceleration of Jacobshavn Isbrae triggered by warm subsurface ocean waters, Nat. Geosci., 1, 659–664, doi:10.1038/ngeo316, 2008.
Kuipers Munneke, P., van den Broeke, M. R., Lenaerts, J. T. M., Flanner, M. G., Gardner, A., and van de Berg, W. J.: A new albedo scheme for use in climate models over the Antarctic ice sheet, J. Geophys. Res., 116, D05114, doi:10.1029/2010JD015113, 2011.
Lenaerts, J. T. M. and van den Broeke, M. R.: Regional climate modeling of drifting snow in Antarctica, Part 2: Results, J. Geo-phys. Res., 117, D05109, doi:10.1029/2010JD015419, 2012. Lenaerts, J. T. M., van den Broeke, M. R., Déry, S. J.,
König-Langlo, G., Ettema, J., and Munneke, P. K.: Modelling snowdrift sublimation on an Antarctic ice shelf, The Cryosphere, 4, 179-190, doi:10.5194/tc-4-179-2010, 2010.
J. T. M. Lenaerts et al.: Greenland drifting snow climate 899
Methods and model evaluation, J. Geophys. Res., 117, D05108, doi:10.1029/2011JD016145, 2012a.
Lenaerts, J. T. M., van den Broeke, M. R., van de Berg, W. J., van Meijgaard, E., and Kuipers Munneke, P.: A new, high-resolution surface mass balance map of Antarctica (1979–2010) based on regional atmospheric climate modeling, Geophys. Res. Lett., 39, L04501, doi:10.1029/2011GL050713, 2012b.
Li, L. and Pomeroy, J. W.: Estimates of threshold wind speeds for snow transport using meteorological data, J. Appl. Meteorol., 36, 205–213, 1997.
Nick, F. M., Vieli, A., Howat, I. M., and Joughin, I.: Large-scale changes in Greenland outlet glacier dynamics triggered at the ter-minus, Nat. Geosci., 2, 110–114, doi:10.1038/ngeo394, 2009. Palm, S. P., Yang, Y., Spinhirne, J., and Marshak, A.: Satellite
re-mote sensing of blowing snow properties over Antarctica, J. Geo-phys. Res., 116, D16123, doi:10.1029/2011JD015828, 2011. Rae, J. G. L., Aðalgeirsdóttir, G., Edwards, T. L., Fettweis, X.,
Gre-gory, J. M., Hewitt, H. T., Lowe, J. A., Lucas-Picher, P., Mottram, R. H., Payne, A. J., Ridley, J. K., Shannon, S. R., van de Berg, W. J., van de Wal, R. S. W., and van den Broeke, M. R.: Greenland ice sheet surface mass balance: evaluating simulations and mak-ing projections with regional climate models, The Cryosphere Discuss., 6, 2059–2113, doi:10.5194/tcd-6-2059-2012, 2012. Rignot, E., Velicogna, I., van den Broeke, M. R., Monaghan, A., and
Lenaerts, J. T. M.: Acceleration of the contribution of Greenland and Antarctic ice sheets to sea level rise, Geophys. Res. Lett., 38, L05503, doi:10.1029/2011GL046583, 2011.
Schmidt, R.: Estimates of threshold windspeed from particle sizes in blowing snow, Cold Reg. Sci. Technol., 4, 187–193, doi:10.1016/0165-232X(81)90003-3, 1981.
Straneo, F., Curry, R. G., Sutherland, D. A., Hamilton, G. S., Cenedese, C., Våge, K., and Stearns, L. A.: Impact of of fjords dynamics and glacial runoff on the circulation near Helheim glacier, Nat. Geosci., 4, 322–327, doi:10.1038/ngeo1109, 2011. Tedesco, M., Fettweis, X., van den Broeke, M. R., van de
Wal, R. S. W., Smeets, C. J. P. P., van de Berg, W. J., Ser-reze, M. C., and Box, J. E.: The role of albedo and accumulation in the 2010 melting record in Greenland, Environ. Res. Lett., 6, 014005, doi:10.1088/1748-9326/6/1/014005, 2010.
Undén, P., Rontu, L., Järvinen, H., Lynch, P., Calvo, J., Cats, G., Cuxart, J., Eerola, K., Fortelius, C., Garcia-Moya, J., Jones, C., Lenderlink, G., McDonald, A., McGrath, R., Navascues, B., Nielsen, N. W., Ødegaard, V., Rodriguez, E., Rummukainen, M., Rˇoˇom, R., Sattler, K., Sass, B. H., Savijärvi, H., Schreur, B. W., Sigg, R., The, H., and Tijm, A.: HIRLAM-5 Scientific Docu-mentation, Tech. rep., Swed. Meteorol. and Hydrol. Inst., Nor-rköping, Sweden, 2002.
van Angelen, J. H., van den Broeke, M. R., and van de Berg, W. J.: Momentum budget of the atmospheric boundary layer over the Greenland ice sheet and its surrounding seas, J. Geophys. Res., 115, D10101, doi:10.1029/2010JD015485, 2011.
van Angelen, J. H., Lenaerts, J. T. M., Lhermitte, S., Fettweis, X., Kuipers Munneke, P., van den Broeke, M. R., and van Meij-gaard, E.: Sensitivity of Greenland Ice Sheet surface mass bal-ance to surface albedo parameterization: a study with a re-gional climate model, The Cryosphere Discuss., 6, 1531–1562, doi:10.5194/tcd-6-1531-2012, 2012.
van de Berg, W. J., van den Broeke, M. R., Reijmer, C. H., and van Meijgaard, E.: Characteristics of the Antarctic surface mass bal-ance (1958–2002) using a regional atmospheric climate model, Ann. Glaciol., 41, 97–104, 2005.
van de Wal, R., Greuell, W., van den Broeke, M., Reijmer, C., and Oerlemans, J.: Surface mass-balance observations and automatic weather station data along a transect near Kangerlussuaq, West Greenland, Ann. Glaciol., 42, 311–316, 2005.
van den Broeke, M. R., Smeets, C. J. P. P., Ettema, J., and Kuipers Munneke, P.: Surface radiation balance in the ablation zone of the west Greenland ice sheet, J. Geophys. Res., 113, D13105, doi:10.1029/2007JD009283, 2008.
van den Broeke, M. R., Bamber, J. L., Ettema, J., Rignot, E., Schrama, E., van de Berg, W. J., van Meijgaard, E., Velicogna, I., and Wouters, B.: Partitioning recent Greenland mass loss, Sci-ence, 326, 984–986, doi:10.1126/science.1178176, 2009. van Meijgaard, E., van Ulft, L. H., van de Berg, W. J., Bosvelt, F. C.,
van den Hurk, B. J. J. M., Lenderink, G., and Siebesma, A. P.: The KNMI regional atmospheric model RACMO version 2.1, Tech. Rep. 302, KNMI, De Bilt, The Netherlands, 2008. Wakahama, G.: The Role of Meltwater in Densification Processes
of Snow and Firn, in: Snow Mechanics Symposium; Proceedings of the Grindelwald Symposium, Grindelwald, Bernese Oberland (Switzerland), April 1974, 114, International Association of Hy-drological Sciences, 1975.
White, P.: Physical processes (CY23R4), Tech. rep., European Cen-tre for Medium-Range Weather Forecasts (ECMWF), 2001. Zwally, H. and Li, J.: Seasonal and interannual variations of firn