www.atmos-meas-tech.net/3/1667/2010/ doi:10.5194/amt-3-1667-2010
© Author(s) 2010. CC Attribution 3.0 License.
Measurement
Techniques
Possible shift of spectral response function of the MODIS 6.8 µm
water vapor channel causing a cold bias of 2–3 K
B. J. Sohn, B.-R. Kim, and S.-S. Lee
School of Earth and Environmental Sciences, Seoul National University, Seoul, 151–747, Korea Received: 23 June 2010 – Published in Atmos. Meas. Tech. Discuss.: 4 August 2010
Revised: 15 November 2010 – Accepted: 25 November 2010 – Published: 3 December 2010
Abstract. The calibration of the Moderate-resolution
Imag-ing Spectroradiometer (MODIS) 6.8 µm water vapor (WV) channel was assessed by comparing Terra/MODIS measure-ments with the WV channel brightness temperatures equiva-lent to Infrared Atmospheric Sounding Interferometer (IASI) measurements for June 2007 and December 2007. IASI spectral information was transferred to the Japanese Mul-tifunctional Transport Satellite (MTSAT)-1R WV channel and then to the MODIS WV channel. Results indicate that the MODIS WV channel is biased low by 2–3 K, possibly caused by the shift of the spectral response function by about +11 cm−1. This finding is particularly important because the bias of−3 K can cause about +30% relative errors in the re-trieval of upper tropospheric humidity (UTH) over the trop-ics. In other words, the current MODIS measurements may result in higher UTH values, showing relative errors up to +30%.
1 Introduction
Accurate measurements of meteorological/geophysical pa-rameters from satellites rely critically on radiometric cali-bration of the sensors. In principle, radiometric character-istics determined before launch can be used for calibration during the flight, with the use of an onboard calibration sys-tem. However, because of various undetected performance anomalies and sensitivity changes of the detector due to ag-ing processes, vicarious calibrations are necessary for both monitoring and absolute calibration purposes.
With well-calibrated Moderate-resolution Imaging Spec-troradiometer (MODIS) measurements, there has been great success in utilizing the MODIS products of various
geo-Correspondence to: B. J. Sohn ([email protected])
physical parameters to understand the global climate system. Among 36 MODIS channels, the 6.8 µm water vapor (WV) channel is of particular interest because of its relationship with the upper tropospheric humidity (UTH) (e.g., Soden and Bretherton, 1993) that is often used for the water vapor feed-back studies. As part of the MODIS calibration efforts, it has been reported that onboard calibration provides 6.8 µm WV channel measurements with the same accuracy as the prelaunch radiometric value of 0.27 K (Xiong and Barnes, 2006). The intercalibration of Terra/MODIS channel mea-surements against contemporaneous meamea-surements made by NASA ER-2 underflights have also indicated that the abso-lute accuracies of MODIS measurements are not worse than the claimed prelaunch radiometric uncertainty (Moeller et al., 2003).
Despite such expected accuracies from the presumably well-calibrated MODIS sensor, recent studies on compar-ing WV channel brightness temperatures reveal an inconsis-tency in the results. Sohn et al. (2008) evaluated measure-ments of the Japanese Multi-functional Transport Satellite-1R (MTSAT-Satellite-1R) 6.8 µm WV channel by collocating with the Terra/MODIS and transforming the brightness temperature (TB) of the MODIS 6.8 µm WV channel into the MODIS-equivalent MTSAT-1R TB. Their results suggested that the MTSAT-1R WV channel has a warm bias up to 2 K.
Wavenumber (cm-1
)
1400 1420 1440 1460 1480 1500 1520 1540 1560
T
B
(
K
)
200 220 240 260 280
Wavelength (µm)
6.3 6.4 6.5 6.6 6.7 6.8 6.9 7.0 7.1 7.2
S
p
e
c
tr
a
l
R
e
s
p
o
n
s
e
0.0 0.2 0.4 0.6 0.8 1.0 IASI
MODIS/TERRA JAMI/MTSAT-1R
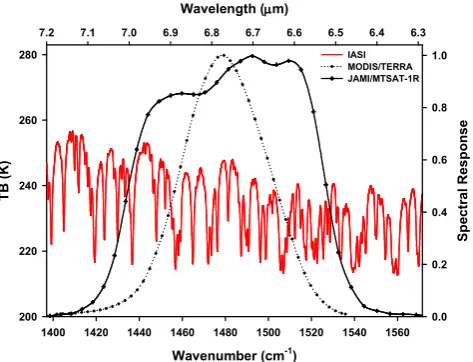
Figure 1: The normalized spectral response functions of the MODIS and MTSAT-1R 6.8 µm water vapor channels. The IASI spectrum collected at 00:30 UTC 16 June 2007 at the location (3.22°N, 140.06°E) is overlaid.
Fig. 1. The normalized spectral response functions of the MODIS
and MTSAT-1R 6.8 µm water vapor channels. The IASI
spec-trum collected at 00:30 UTC 16 June 2007 at the location (3.22◦N,
140.06◦E) is overlaid.
In addition, Tobin et al. (2006) noted that uncertainties of other MODIS infrared channels except temperature sound-ing channels range from near 0 K to 0.2 K. Although a direct comparison between IASI and MODIS is desirable, it may be available only over the polar regions, based on the so-called Simultaneous Nadir Overpasses (SNO) method (Cao et al., 2005). The equatorial crossing time of the IASI is 09:30 UTC, whereas it is 10:30 UTC for Terra/MODIS and 13:30 UTC for Aqua/MODIS. However, it is thought be dif-ficult to apply the SNO technique for the water vapor chan-nel under extremely dry conditions such as in polar regions, because the WV channel is mostly affected by surface sig-nals, similar to window channels. In other words, it may be difficult to diagnose the effect caused by any shift of the WV spectral response function using the SNO technique. Further-more, the SNO-driven results represent only a small portion of the dynamic ranges of water vapor channel TB, leaving difficulties in interpreting results (e.g. Shi et al., 2008).
In this paper, by taking the IASI observations as a ref-erence, we have investigated the calibration status of the MODIS 6.8 µm WV channel over the tropical low latitude regions where dynamic ranges are large enough to assess the calibration status. Because direct comparison between IASI and MODIS is difficult, we used the MTSAT-1R WV channel as a surrogate IASI to intercalibrate the MODIS WV channel; that is, accurate spectral information from IASI is transferred to the MODIS water vapor channel through the MTSAT-1R. Here we provide strong evidence that the Terra/MODIS 6.8 µm WV channel is biased cold by 2–3 K.
2 Data used
In this investigation, WV channel images from the MTSAT-1R and Terra/MODIS and hyperspectral images from IASI over the 6.8 µm water vapor absorption band for June and December 2007 (a total of two months) are taken over the MTSAT-1R observation area of 30◦N–30◦S and 110◦E– 170◦E. Their respective spectral response functions for the 6.8 µm strong water vapor absorption band are given in Fig. 1. Hereafter, the 6.8 µm absorption band is referred to as the WV channel.
IASI is a passive infrared sensing instrument based on the Michelson Interferometer onboard the Meteorological Op-erational Satellite/EUMETSAT (MetOp/EUMETSAT). Its spectral coverage is from 3.63 to 15.5 µm (or 645 to 2760 cm−1) with 8461 spectral samples at a 0.5 cm−1
spectral resolution (EUMETSAT, 2008). The IASI Level 1C (IASI L1C) data with a 12 km spatial reso-lution at the sub-satellite point were downloaded from the NOAA/CLASS Website (http://www.nsof.class.noaa. gov/saa/products/welcome). After the launch in Octo-ber 2006, IASI has shown good in-flight performance, es-pecially regarding its radiometric and spectral accuracy, for which the calibration accuracy is claimed to be well below 0.15 K (Blumstein et al., 2007) and within about 0.1 K (Larar et al., 2010).
The geostationary MTSAT-1R satellite located at 140◦E carries an IR imager to measure IR radiances at four spec-tral bands (centered at 10.8, 12.0, 6.8, and 3.8 µm) with a 4.0 km pixel resolution at the sub-satellite point. In this study, we used MTSAT/High Rate Information Transmis-sion (MTSAT/HRIT) data from the Japan Meteorological Agency (JMA). The HRIT count values for the WV channel were converted into TB using the calibration table provided by the JMA Web site (http://mscweb.kishou.go.jp/operation/ calibration/mt1r/HRIT/mt1r hrit.htm). For the MTSAT-1R infrared channel calibrations, an onboard calibration system is built into the imager, combining the blackbody source with the cold space view (Puschell et al., 2003). In addition, an intercalibration method utilizing collocated IASI informa-tion has been employed for monitoring the calibrainforma-tion sta-tus of MTSAT-1R infrared channels. The calibration perfor-mance of MTSAT WV channel has been stable with a bias of 0.117 K at 250 K and with an RMSE of 0.003 K for 26 month period from May 2008 to June 2010 (http://mscweb.kishou. go.jp/monitoring/gsics/ir/techinfo mt1r.htm).
3 Methodology
This examination includes the following steps: (1) devel-opment of a theoretical relationship of TB between the MODIS and MTSAT-1R WV channels, (2) bias correction of the MTSAT-1R WV channel TB, (3) estimation of IASI-equivalent MODIS WV channel TB from the collocated MTSAT-1R WV channel TB, and (4) comparison of IASI-equivalent MODIS TBs with measured TBs. A detailed de-scription of the method is as follows.
Because the IASI provides spectral signatures with a 0.5 cm−1 resolution, the expected relationship of TB be-tween MTSAT-1R and MODIS can be theoretically calcu-lated by applying their respective spectral response functions (SRFs). Once an IASI-based pseudo-channel corresponding to any target channel is selected (here, the WV channel of the MTSAT-1R or the MODIS), the radiance measured by the pseudo-channel (Nwv)can be inferred as follows:
NWV≡ Z ν2
ν1
8(ν)Nνdν
Z ν2
ν1
8(ν)dν (1)
where8(ν) is the SRF of the target channel at the wave number ν, and Nν is the IASI-measured radiance at the
wave numberν. The calculated synthetic radiance is then converted into TB for the WV channels of MTSAT-1R and MODIS to obtain the TB relationship between the two WV channels. The regression equation may be expressed as:
IETBMODIS=a+b IETBMTSAT (2)
In Eq. (2), IETBMODISand IETBMTSAT are brightness
tem-peratures of the MODIS and MTSAT-1R WV channels in-ferred from IASI spectral measurements, rein-ferred to as “IASI-equivalent” MODIS and MTSAT-1R WV channel TBs, respectively. The coefficients of Eq. (2) are obtained by regressing two sets of TBs only from clear-sky scenes.
Because IETBMTSATin Eq. (2) is theoretically calculated
with IASI spectral signatures, bias correction should be made before applying Eq. (2) to infer IETBMODISfrom measured
MTSAT-1R WV TB. The bias is determined by comparing measured MTSAT-1R TB with IETBMTSATfrom collocated
IASI pixels. Finally, the bias-corrected MTSAT-1R WV TB is inserted into Eq. (2) to infer “IASI-equivalent” MODIS WV channel TB (i.e. IETBMODIS), which is then compared
with collocated and measured MODIS WV channel TBs. Collocated match-up data are constructed using MTSAT-1R vs. IASI images as well as MTSAT-MTSAT-1R vs. MODIS im-ages. Since the instruments being considered are onboard different satellite platforms, their time–space resolutions and viewing geometries are quite different. For example, the spatial resolution at nadir is 12 km for IASI and 4 km for MTSAT-1R. In order to remove the effects of different spatial and temporal resolutions, and viewing geometry differences, we projected measurements from different sensors onto a common reference. Images were selected when observation
MTSAT-1R TB from IASI (K)
230 235 240 245 250 255 260 265
M
O
D
IS
T
B
f
ro
m
I
A
S
I
(K
)
230 235 240 245 250 255 260 265
Correlation coefficient: 0.99 Mean bias: 0.64 Slope: 1.03 Intercept point: -5.83 RMSE: 0.20 # of points: 171
June 2007
MTSAT-1R TB from IASI (K)
230 235 240 245 250 255 260 265
M
O
D
IS
T
B
f
ro
m
I
A
S
I
(K
)
230 235 240 245 250 255 260 265
Correlation coefficient: 0.99 Mean bias: 0.60 Slope: 1.02 Intercept point: -4.78 RMSE: 0.18 # of points: 220
December 2007
Figure 2: Brightness temperatures inferred from IASI measurements for the MODIS and MTSAT-1R 6.8 µm water vapor channels in June 2007 (left) and December 2007 (right).
Fig. 2. Brightness temperatures inferred from IASI measurements for the MODIS and MTSAT-1R 6.8 µm water vapor channels in June 2007 (left) and December 2007 (right).
time differences were within±5 min. The analysis domain of 30◦N–30◦S and 110◦E–170◦ further confines the col-located pixels within relatively low viewing angles smaller than about 30◦. Data were further processed for the construc-tion of match-up data when an absolute difference in viewing angle between two observations is less than 5◦. Then, bright-ness temperatures from each satellite were averaged and re-formatted into a 0.2◦×0.2◦ grid to mitigate the effects of different spatial resolutions as well as geolocation errors.
Brightness temperatures were averaged only when the 0.2◦ grid was entirely filled with clear pixels, at least in the mid-dle to upper tropospheric layer, to remove the effect of cloud contamination in the 6.8 µm channel TB, whose weighting function is generally located in the upper troposphere. For the IASI and MTSAT-1R collocation, the pixel was con-sidered to be cloud-free for the water vapor channel if the MTSAT-1R window channel TB (around the 11 µm band) is larger than 275 K (Sohn and Schmetz, 2004) and the TB difference between the window and water vapor channels is larger than 25 K (Soden, 1998). These thresholds elimi-nate pixels contamielimi-nated by high or middle clouds, because the weighting function of the water vapor channel is located mainly between 200 hPa and 500 hPa. The grid remains if the standard deviation of TB11 within the grid is less than 0.8 K for the spatial homogeneity check.
For the MODIS and MTSAT-1R pair, the MODIS level 2 cloud mask products (MOD35 L2) were used to ensure the removal of cloud-contaminated scenes. The homogene-ity criterion was also applied to remove targets contaminated by clouds or coastal lines. The 0.8 K standard deviation of TB11 within a grid was also used as a criterion for the spatial homogeneity check.
4 Results
MTSAT-1R TB from IASI (K)
230 235 240 245 250 255 260 265
M e a s u re d M T S A T -1 R T B ( K ) 230 235 240 245 250 255 260 265
Correlation coefficient: 0.98 Mean bias: 0.12 Slope: 0.99 Intercept point: 3.66 RMSE: 0.43 # of points: 171
June 2007
MTSAT-1R TB from IASI (K)
230 235 240 245 250 255 260 265
M e a s u re d M T S A T -1 R T B ( K ) 230 235 240 245 250 255 260 265
Correlation coefficient: 0.99 Mean bias: 0.09 Slope: 0.99 Intercept point: 3.58 RMSE: 0.47 # of points: 220
December 2007
(a) (b)
MTSAT-1R TB from MODIS (K)
230 235 240 245 250 255 260 265
M e a s u re d M T S A T -1 R T B ( K ) 230 235 240 245 250 255 260 265
Correlation coefficient: 0.99 Mean bias: 2.22 Slope: 0.97 Intercept point: 8.90 RMSE: 0.47 # of points: 610
June 2007
MTSAT-1R TB from MODIS (K)
230 235 240 245 250 255 260 265
M e a s u re d M T S A T -1 R T B ( K ) 230 235 240 245 250 255 260 265
Correlation coefficient: 0.99 Mean bias: 2.48 Slope: 0.98 Intercept point: 8.16 RMSE: 0.43 # of points: 840
December 2007
(c) (d)
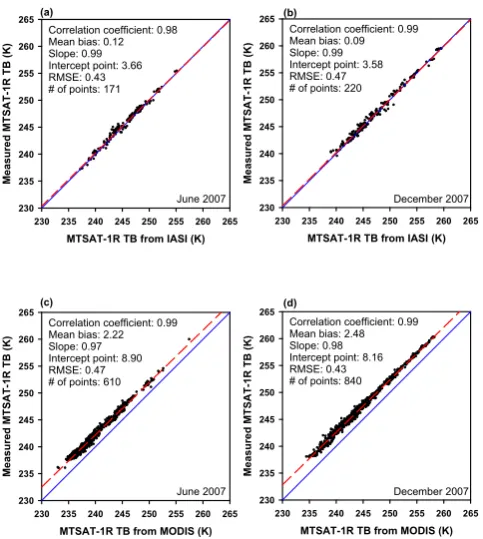
Figure 3: Scatter plots of IASI equivalent MTSAT-1R and measured MTSAT-1R water vapor channel brightness temperatures for June 2007 (a) and December 2007 (b), and of MODIS equivalent MTSAT-1R and measured MTSAT-1R water vapor channel brightness temperatures for June 2007 (c) and December 2007 (d).
Fig. 3. Scatter plots of IASI equivalent MTSAT-1R and
mea-sured MTSAT-1R water vapor channel brightness temperatures for June 2007 (a) and December 2007 (b), and of MODIS equivalent MTSAT-1R and measured MTSAT-1R water vapor channel bright-ness temperatures for June 2007 (c) and December 2007 (d).
of MTSAT-1R and MODIS WV channel TBs inferred from IASI measurements. Regression lines are represented by dashed lines, and solid diagonal lines represent one-to-one matches. These show the MODIS and MTSAT-1R WV chan-nel measurements to be well behaved, with a correlation co-efficient of 0.99 for both the summer month and the win-ter month, indicating that MODIS TB can be predicted by MTSAT-1R measurement or vice-versa, if calibrations are accurate. The regression equations obtained for June and De-cember 2007 were as follows:
For June 2007: IETBMODIS= −5.83+1.03 IETBMTSAT (3)
For December 2007: IETBMODIS= −4.78+1.02 IETBMTSAT (4)
In Eqs. (3) and (4), the IASI-equivalent MTSAT-1R TB (i.e. IETBMTSAT)is used as a predictor to estimate the
IASI-equivalent MODIS TB (i.e. IETBMODIS). Since the
mea-sured MODIS TB is compared with the IASI-equivalent MODIS TB estimated from the collocated MTSAT-1R TB, the bias between IETBMTSAT and the measured MTSAT-1R
TB should be evaluated and taken into account before pre-dicting IETBMODIS.
In order to assess the bias, measured MTSAT-1R TBs were compared with IASI-equivalent MTSAT-1R TBs using the
IASI equivalent MODIS TB (K) 230 235 240 245 250 255 260 265
M e a s u re d M O D IS T B ( K ) 230 235 240 245 250 255 260 265
Correlation coefficient: 0.99 Mean bias: -3.06 Slope: 1.01 Intercept point: -6.40 RMSE: 0.47 # of points: 610
June 2007
IASI equivalent MODIS TB (K) 230 235 240 245 250 255 260 265
M e a s u re d M O D IS T B ( K ) 230 235 240 245 250 255 260 265
Correlation coefficient: 0.99 Mean bias: -2.02 Slope: 1.02 Intercept point: -6.92 RMSE: 0.43 # of points: 840
December 2007
Figure 4: Scatter plots of IASI equivalent MODIS and measured MODIS brightness temperatures for June 2007 (left) and December 2007 (right).
Fig. 4. Scatter plots of measured MODIS and IASI equivalent MODIS brightness temperatures for June 2007 (left) and Decem-ber 2007 (right).
collocated IASI-MTSAT data – Fig. 3a–b. The scatter plots indicate an almost one-to-one correspondence between the two sets of TB data for both the winter month and the sum-mer month. The mean biases of 0.12 K and 0.09 K appear insignificant; nevertheless, those values were taken into ac-count for correcting the bias of the measured MTSAT-1R TBs.
At the same time, the IASI-based relationship between
IETBMODIS and IETBMTSAT expressed in Eqs. (3) and (4)
can be applied to predict MTSAT-1R TBs from MODIS TB measurements. The predicted MTSAT-1R TBs (or MODIS-equivalent MTSAT-1R TBs) can be compared with collo-cated measured MTSAT-1R TBs, which can be used as a way to assess the calibration status of MTSAT-1R WV chan-nel measurements based on the MODIS measurements as a reference. It is similar to the approach used by Sohn et al. (2008). Comparison results given in Fig. 3(c–d) suggest that MTSAT-1R WV channel overestimates TBs by 2.2 to 2.5 K when MODIS measurements are used as a reference. This overestimate is significantly different from the near agreement shown between IASI-equivalent TBs and mea-sured TBs in Fig. 3(a–b, leading to a conjecture that MODIS WV channel calibration may be problematic if IASI mea-surements are assumed to be true. Taking results shown in Fig. 3 as a working hypothesis, we further proceed to assess the calibration status of MODIS WV measurements and ex-amine possible causes of the calibration bias if any.
Using Eqs. (3) and (4), the IETBMODIS were estimated
from collocated MTSAT-1R TBs with a bias adjustment. Figure 4 shows the scatter plots of observed versus IASI-equivalent MODIS WV channel TBs for June and December 2007. The dashed lines represent regression lines, while the solid lines represent perfect matches. In Fig. 4, it can be seen that the measured MODIS WV channel TBs are strongly correlated with IASI-equivalent TBs (correlation coefficient 0.99); however, biases of−2.9±0.96 K for June 2007, and
IASI equivalent MODIS TB (K)
230 235 240 245 250 255 260 265
M
e
a
s
u
re
d
M
O
D
IS
T
B
(
K
)
230 235 240 245 250 255 260 265
Correlation coefficient: 0.99 Mean bias: 0.07 Slope: 1.03 Intercept point: -7.68 RMSE: 0.48 # of points: 610
June 2007
IASI equivalent MODIS TB (K)
230 235 240 245 250 255 260 265
M
O
D
IS
T
B
f
ro
m
I
A
S
I
(K
)
230 235 240 245 250 255 260 265
Correlation coefficient: 0.99 Mean bias: -0.10 Slope: 1.03 Intercept point: -8.24 RMSE: 0.44 # of points: 840
December 2007
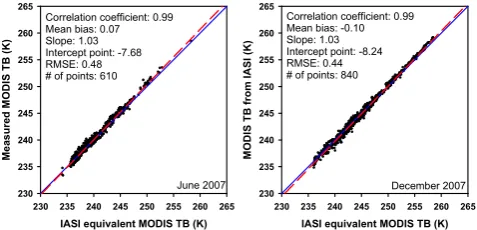
Figure 5: Scatter plots of measured MODIS and IASI equivalent MODIS brightness temperatures for June 2007 (left) and December 2007 (right) after the spectral shift of the response function by +11cm-1.
Fig. 5. Scatter plots of measured MODIS and IASI equivalent MODIS brightness temperatures for June 2007 (left) and Decem-ber 2007 (right) after the spectral shift of the response function by
+11 cm−1.
appears to be related to the degree of wetness of the up-per troposphere (e.g. Wu et al., 1993). Considering that the water vapor absorption signal is stronger (weaker) for moister (drier) condition, we may expect a smaller difference in TB for the drier atmosphere if all other calibration factors remain unchanged, as also expressed in Eqs. (3) and (4). It is also of interest to note that the bias seems to be larger for the colder scenes. Again, considering that higher UTH is often depicted by a colder WV channel TB, the temperature de-pendence of bias is consistent with the seasonal dede-pendence. We assume that the discrepancies between measured and inferred MODIS WV channel TBs are due to the error in the MODIS SRF position. The cold bias of TB and its depen-dence on season and scene temperature were found to be al-most cancelled by introducing a spectral shift for the MODIS 6.8 µm WV channel (Fig. 5). The analysis was repeated with convolutions of IASI spectra with an SRF of the MODIS WV channel shifted by +11 cm−1, which yields the least RMSE. This result is consistent with the suggested cold bias around 1 K in the MODIS water vapor channel, based on compar-ison with the brightness temperature inferred from Atmo-spheric Infrared Sounder (AIRS), which has previously been attributed to an SRF shift of +5.0 cm−1(Tobin et al., 2006).
Considering that the AIRS has spectral gaps over the 6.8 µm WV absorption band, the Tobin et al. (2006) WV channel re-sults should not be definite, our result of an +11 cm−1 SRF shift causing a cold bias of 2–3 K should be counted as sig-nificant for MODIS data processing. The simple bias correc-tion may be possible if measured MODIS TB is converted to IASI equivalent TB using the obtained regression equations in Fig. 4, although they are only applicable to corresponding months over the tropical and subtropical area.
5 Conclusions
We assessed the calibration performance of the Terra/MODIS 6.8 µm WV absorption channel by using collocated MTSAT-1R as a surrogate of IASI. In so doing, IASI spectral measurements were convolved into the bright-ness temperatures of 6.8 µm WV absorption channels of MODIS and MTSAT-1R, and then a theoretical relationship between two channels was deduced. After adjusting the mean bias between the IASI-equivalent MTSAT-1R TBs and observed values, the IASI-equivalent MODIS WV channel TB was calculated from the measured MTSAT-1R TB by applying the obtained TB relationship. For this intercom-parison, spatially uniform and cloud-free IASI, MODIS and MTSAT-1R WV channel data were collected for June and December 2007, over the 30◦N–30◦S, 110◦E–170◦ analysis domain.
Comparison of measured MODIS WV channel TBs with IASI-equivalent TBs strongly indicates that MODIS WV channel TBs are biased low: −2.9±0.96 K for June 2007, and−1.9±0.86 K for December 2007 at a reference tem-perature of TB=250 K. While the causes of these differences are not conclusive, the fact that the SRF spectral shift of +11 cm−1almost cancels both the seasonally dependent and scene temperature-dependent biases strongly indicates that the shift of SRF of the MODIS WV channel by +11 cm−1 could be a major reason for the 2–3 K low bias of TB. This bias is significant for the reason that the 3 K bias in TB can lead to relative errors of up to 30% in the retrieved UTH val-ues (Sohn et al., 2000). The MODIS water vapor channel should be recalibrated when the channel measurements are used for UTH-related studies. However, despite the better agreement of MODIS 6.8 µm channel with IASI through the spectral shift of SRF, it should be pointed out that the pro-posed explanation may not be conclusive because other phys-ical error sources are not known. Further investigation into other possible error sources such as blackbody emissivity, detector nonlinearity, SRF out-of-band response, and spec-tral shape is necessary before reaching a firm conclusion.
Acknowledgements. This work was supported by the NSL (National Space Lab) program through the Korea Science and Engineering Foundation funded by the Ministry of Education, Science and Technology (S10801000184-08A0100-18410) and by the BK21 Project of the Korean Government.
References
Blumstein, D., Tournier, B., Cayla, F. R., Phulpin, T., Fjortoft, R., Buil, C., and Ponce, G.: In-flight performance of the Infrared At-mospheric Sounding Interferometer (IASI) on METOP-A, Proc. SPIE, 66840H, 1–12, 2007.
Cao, C., Xu, H., Sullivan, J., McMillin, L., Ciren, P., and Hou, Y.: Intersatellite radiance biases for the High Resolution Infrared Ra-diation Sounders (HIRS) onboard NOAA-15, -16, and -17 from simultaneous nadir observations, J. Atmos. Oceanic Technol., 22, 381–395, 2005.
EUMETSAT: IASI Level 1 product guide,
EUM/OPS-EPS/MAN/04/0032, V2E. EUMETSAT, Darmstadt,
Ger-many, (http://oiswww.eumetsat.org/WEBOPS/eps-pg/IASI-L1/ IASIL1-PG-0TOC.htm), 2010.
Larar, A. M., Smith, W. L., Zhou, D. K., Liu, X., Revercomb, H., Taylor, J. P., Newman, S. M., and Schl¨ussel, P.: IASI spectral ra-diance validation inter-comparisons: case study assessment from the JAIVEx field campaign, Atmos. Chem. Phys., 10, 411–430, doi:10.5194/acp-10-411-2010, 2010.
Moeller, C. C., Revercomb, H. E., Ackerman, S. A., Menzel, W. P., and Knuteson, R. O: Evaluation of MODIS thermal IR band L1B radiances during SAFARI 2000, J. Geophys. Res., 108, 8494, doi:10.1029/2002JD002323, 2003.
Puschell, J., Lowe, J. A., Jeter, J., Kus, S., Osgood, R., Hurt, W. T., Gilman, D., Rogers, D., and Hoelter, R.: Japanese Ad-vanced Meteorological Imager (JAMI); Design, characterization and expected on-orbit performance, Proceedings of the 13th International TOVS Study Conference, Sainte Adele, Canada, 29 October–4 November, 2003.
Shi, L., Bates, J. J., and Cao, C.: Scene radiance-dependent
intersatellite biases of HIRS longwave channels, J.
At-mos. Oceanic. Technol., 25(12), 2219–2229, doi:10.1175/2008 JTECHA1058.1, 2008.
Soden, B. J. and Bretherton, F. P.: Upper-tropospheric relative hu-midity from the GOES 6.7 µm channel: Method and climatology for July 1987, J. Geophys. Res., 98, 16669–16688, 1993. Soden, B. J.: Tracking upper tropospheric water vapor radiances: A
satellite perspective, J. Geophys. Res., 103, 17069–17081, 1998. Sohn, B. J., Schmetz, J., Tjemkes, S., Koenig, M., Lutz, H., Arriage, A., and Chung, E. S.: Intercalibration of the Meteosat 7 water va-por channel with SSM/T-2, J. Geophys. Res., 105, 16673–16680, 2000.
Sohn, B. J. and Schmetz, J.: Water Vapor-induced OLR variations associated with high cloud changes over the tropics: A study from Meteosat-5 observations, J. Climate, 17, 1987–1996, 2004. Sohn, B. J., Park, H. S., Han, H. J., and Ahn, M. H.: Evaluating the calibration of MTSAT-1R infrared channels using collocated Terra MODIS measurements, Int. J. Remote. Sens., 29, 3033– 3042, 2008.
Tobin, D. C., Revercomb, H. E., Moeller, C. C., and Pagano, T. S.: Use of Atmospheric Infrared Sounder high–spectral reso-lution spectra to assess the calibration of Moderate resoreso-lution Imaging Spectroradiometer on EOS Aqua, J. Geophys. Res., 111, D09S05, doi:10.1029/2005JD006095, 2006.
Wu, X., Bates, J., and Khalsa, S.: A Climatology of the water vapor band brightness temperatures from NOAA operational satellites, J. Climate, 6, 1282–1300, 1993.