R E S E A R C H A R T I C L E
Open Access
Network-driven plasma proteomics expose
molecular changes in the Alzheimer
’
s brain
Philipp A. Jaeger
1,2,3*, Kurt M. Lucin
1,17, Markus Britschgi
1,18, Badri Vardarajan
4, Ruo-Pan Huang
5,6,
Elizabeth D. Kirby
1, Rachelle Abbey
1, Bradley F. Boeve
7, Adam L. Boxer
8, Lindsay A. Farrer
4,9, NiCole Finch
10,
Neill R. Graff-Radford
11, Elizabeth Head
12, Matan Hofree
13, Ruochun Huang
5,6, Hudson Johns
1, Anna Karydas
8,
David S. Knopman
7, Andrey Loboda
14, Eliezer Masliah
15, Ramya Narasimhan
1, Ronald C. Petersen
7,
Alexei Podtelezhnikov
14, Suraj Pradhan
1, Rosa Rademakers
10, Chung-Huan Sun
1, Steven G. Younkin
10,
Bruce L. Miller
8, Trey Ideker
3and Tony Wyss-Coray
1,16*Abstract
Background:Biological pathways that significantly contribute to sporadic Alzheimer’s disease are largely unknown and cannot be observed directly. Cognitive symptoms appear only decades after the molecular disease onset, further complicating analyses. As a consequence, molecular research is often restricted to late-stage post-mortem studies of brain tissue. However, the disease process is expected to trigger numerous cellular signaling pathways and modulate the local and systemic environment, and resulting changes in secreted signaling molecules carry information about otherwise inaccessible pathological processes.
Results:To access this information we probed relative levels of close to 600 secreted signaling proteins from patients’blood samples using antibody microarrays and mapped disease-specific molecular networks. Using these networks as seeds we then employed independent genome and transcriptome data sets to corroborate potential pathogenic pathways.
Conclusions:We identified Growth-Differentiation Factor (GDF) signaling as a novel Alzheimer’s disease-relevant pathway supported by in vivo and in vitro follow-up experiments, demonstrating the existence of a highly informative link between cellular pathology and changes in circulatory signaling proteins.
Background
Plasma proteins provide a sampling of biological pro-cesses throughout the organism and have been applied to diagnose or monitor human disease. However, in neu-rodegenerative disorders it has so far been more difficult to use unbiased large-scale proteomic approaches to discover blood-based biomarkers for diagnostics [1–3]. While individual patient samples might be insufficient for reliable classification tasks based on plasma pro-teins alone, patient populations could instead be used to smoothen variability and identify underlying common changes linked to disease mechanisms. To achieve this, we
propose a medium-scale proteomic strategy that concen-trates on secreted signaling proteins involved in cellular communication. Changes in these signaling proteins may result from pathogenic processes or indicate cellular re-sponses to disease. A screen focused on these proteins may not only reduce the proteome test space dramatically but also provide mechanistic insight [4]. Here, we exam-ined whether this approach can robustly identify proteins and biological pathways linked to sporadic late-onset Alzheimer’s disease dementia (AD).
Results
To monitor the secreted signaling proteome in plasma, we manufactured glass-based microarrays with commer-cially available antibodies to measure the relative levels of close to 600 distinct secreted signaling proteins. Using these arrays, we obtained quantifiable results for 582
* Correspondence:[email protected];[email protected] 1
Department of Neurology and Neurological Sciences, Stanford University School of Medicine, Stanford, CA, USA
16Center for Tissue Regeneration, Repair and Restoration, VA Palo Alto Health
Care System, Palo Alto, CA, USA
Full list of author information is available at the end of the article
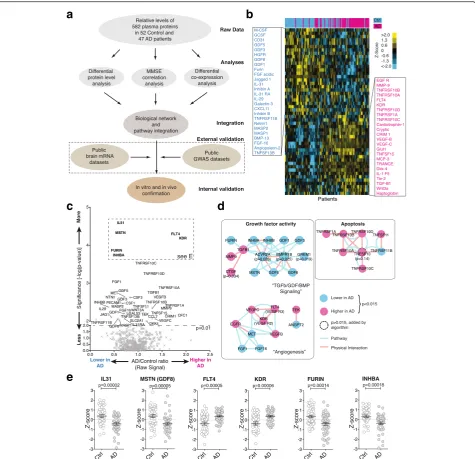
signaling proteins (Additional file 1: Figure S1A to D and Additional file 2) in archived blood plasma from 47 sporadic, cognitively impaired AD patients and 52 non-demented, closely age- and sex-matched controls ob-tained from two clinical centers (Additional file 1: Table S1). While these proteins do not encompass all secreted signaling proteins, they do provide a strong representa-tion of all major signaling pathways and represent the largest dataset of this kind available today (Additional file 1: Figure S1A). Raw data were processed, normalized (Additional file 1: Figure S2), and then subjected to three parallel analyses, aimed at integrating both molecular and clinical data, followed by external and internal valid-ation steps (Fig. 1a).
To identify signaling proteins with significantly changed plasma levels in AD we calculated corrected p-values for the quality controlled, centered, and normalized array data. Principal component analysis showed that our data were relatively free of obvious batch effects or confound-ing factors (Additional file 1: Figure S3). Clusterconfound-ing of the top 50 most different proteins illustrated clear differences between AD and control samples (Fig. 1b and c). Using the most significant proteins (FDR < 0.05, corresponding topcorr< 0.015) as a starting point, we then queried known
pathway or physical interaction databases to test the hy-pothesis that the signaling proteome could be mined to identify pathologically disturbed pathways (i.e., deregu-lated pathways should reveal themselves through changes in multiple receptors and/or ligands). This approach greatly reduces the chance of false-positive discoveries in contrast to following individually significant but uncon-nected leads. Using this methodology we identified highly interconnected clusters of receptors and ligands with growth factor activity (“TGFβ/GDF/BMP signaling” and “Angiogenesis”) or with activity linked to apoptosis (Fig. 1d). Reassuringly, the direction of changes was often coherent within each cluster/sub-cluster (Fig. 1d). Individ-ual proteins can show highly significant differences between cohorts and, at the same time, exhibit large overlaps in the observed protein level ranges, highlighting the need for suf-ficient sample sizes and cohort stratification (Fig. 1e and Additional file 1: Figure S4).
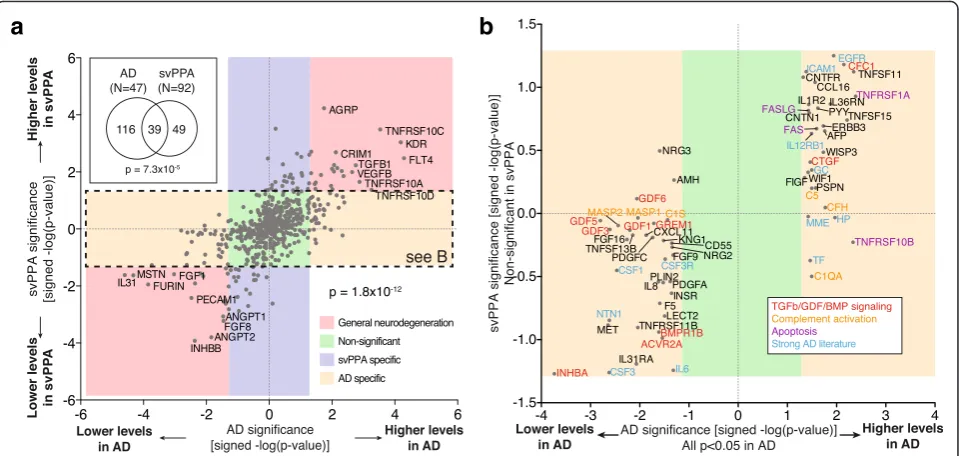
To determine to what extent the observed changes in the AD signaling proteome are AD specific or the result of general neurodegeneration or other unrelated pro-cesses, we collected plasma samples from an additional 92 patients (Additional file 1: Table S2) suffering from semantic-variant primary progressive aphasia (svPPA), a sub-type of frontotemporal lobar degeneration (FTLD). SvPPA is almost always associated with Trans-activation response element (TAR) DNA-binding protein 43 (TDP-43)-aggregate pathology and appears to have weak gen-etic linkage [5–7]. This makes svPPA an ideal candidate to compare distinct neurological pathologies between
two unrelated, sporadic, progressive dementias (svPPA
vs. AD) via signaling proteome analysis [8]. The svPPA samples were prepared, handled, and analyzed in parallel to the AD samples to minimize experimental variations.
We found 39 proteins with significant changes in both AD and svPPA (Fig. 2a, inset; p= 7.3×10⁻⁵by hypergeo-metric test). Intriguingly, when we compared signifi-cance and direction of protein changes between the two pathologies, we found a perfect correlative trend of up/ up or down/down amongst the 39 overlapping proteins (p< 1.8×10⁻¹²by binominal test), indicating that a more general disease-profile does exist (Fig. 2a, red boxes). Additionally, we were able to identify proteins with svPPA-specific (Fig. 2a, purple box) and AD-specific proteome signatures (Fig. 2a and b, yellow box), respect-ively. A more detailed analysis of the svPPA findings is published elsewhere [9]. Manual literature curation of the AD-specific hits yielded numerous proteins involved in TGFβ/GDF/BMP signaling, complement activation, apoptosis, or with otherwise strong AD literature, suggesting that those pathways could play a role in AD (Fig. 2b). These findings indicate that a mixture of both disease-specific and nonspecific signaling pro-files can be obtained from blood and that compara-tive proteomics can be applied to identify disease-specific changes.
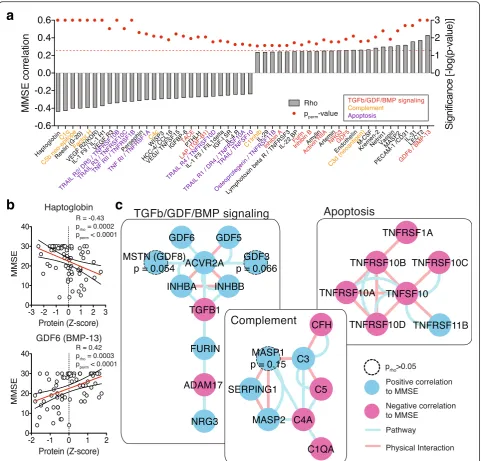
Changes in protein levels provide a binary view on AD (significantly changed or not). However, disease is a gradual process with patient’s cognition becoming in-creasingly more impaired. To explore the relationship between cognitive performance and relative plasma pro-tein levels, we correlated the levels of 582 propro-teins with the Mini-mental state [10] examination (MMSE) scores of the respective patient (Fig. 3a and b, and Additional file 2; Spearman rank correlation andp-value [prho] as well as ex-plicit p-values through 1000-fold sample permutations [pperm]). Applying the same network exploration method
as before, we identified again many proteins involved in TGFβ/GDF/BMP signaling and apoptosis to be positively or negatively correlated with cognitive performance (Fig. 3c), lending further support to our AD-specific findings above. While proteins involved in “ Comple-ment” activation were detected by the MMSE correl-ation analysis, they did not meet the cutoff criteria in the differential analysis, indicating that the comple-ment driven effects are more subtle and gradual in na-ture (Fig. 3c). This finding highlights the fact that analyzing a continuous functional parameter such as MMSE can retrieve additional non-binary pathways of interest.
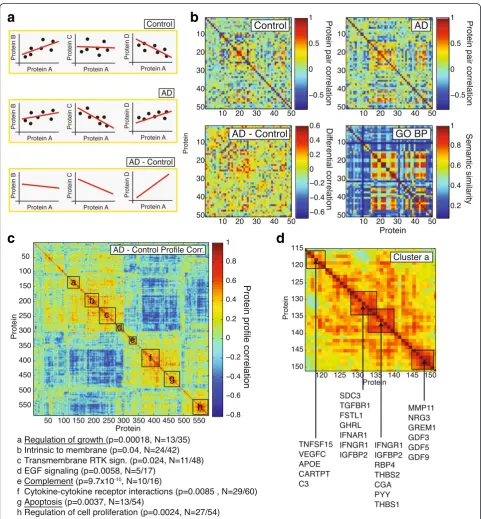
from comparing changes in co-expression of signaling molecules as this might carry information on the pair-wise relationship between the underlying signaling proteins and regulatory pathways, and on how this re-lationship is affected in disease [11].
To assess changes in co-expression, we calculated the Spearman correlation between each protein pair under healthy control and under AD conditions and then subtracted these correlations from each other, creating co-expression and differential co-expression networks
a
c
e
d
b
respectively (Fig. 4a and b). It can be shown that these net-works carry valuable biological information by comparing co-expression profiles and gene ontology (GO) biological process similarity between genes/proteins (Additional file 1: Figure S5). We found that protein pairs with high dif-ferential co-expression profile correlation (R> 0.35; Additional file 1: Figure S5) have significantly higher median GO semantic similarity scores than expected by chance, indicating that these protein pairs are function-ally related.
Having established that meaningful biological informa-tion is contained within the co-expression profiles, we used hierarchical clustering [12] to arrange signaling proteins based on their co-expression profile correlations (Fig. 4c). Using DAVID [13, 14], we identified several clusters of proteins that were significantly enriched for a number of ontology terms (Fig. 4c). These protein clusters rep-resent signaling molecules whose co-expression profiles change in a highly parallel fashion in AD, which in turn could indicate that the underlying regulatory pathways participate in AD pathogenesis. The most significantly enriched clusters were “Complement” (p= 9.7 × 10⁻¹⁰), “Regulation of growth” (p= 0.00018) and “Apoptosis” (p= 0.0037; all EASE score p-value based on 562 unique gene background). In this approach, the size (and number) of clusters identifiable is limited by the overall number of
proteins probed: While it is apparent that cluster a-d and e-g could be grouped into larger “superclusters”, probing these superclusters for enrichment is not useful as they contain 25–45 % of all probed proteins (Fig. 4c).
Exploring the “Regulation of growth” cluster in more detail, we observed several sub-clusters that partially aligned with known biological relationships, often bridg-ing regulatory pathways together (Fig. 4d). For example APOE deficient mice are prone to atherosclerosis, but C3 modulation of lipid metabolism can protect them [15], while VEGFC is a marker for advanced atheroscler-osis and hypercholesterolemia in the same animals [16]. TGFβ and interferons (IFN) have antagonizing relation-ships in the control of inflammation [17], while interferons reduce ghrelin (GHRL) expression [18], and Follistatin-like 1 (FSTL1) is controlled by TGFβ[19]. We also noticed that numerous proteins were directly or indirectly associ-ated with or regulassoci-ated by TGFβ/GDF/BMP signaling (e.g., TGFBR1, FSTL1, THBS1, MMP11, GREM1, GDF3, GDF5, GDF9), making that pathway a lead candidate to test for its involvement in AD. These data suggest that co-expression analysis can be used to identify clusters of proteins and regulatory pathways that are linked through similar co-expression profiles, potentially indi-cating pathways that are affected by or affecting AD pathology simultaneously.
a
b
Fig. 2The plasma proteome contains disease specific information. To assess the specificity of the proteins identified in the expression level analysis, AD samples were compared to another, unrelated progressive dementia (svPPA = semantic-variant primary progressive aphasia).
Because protein quantification is notoriously difficult [1, 2, 20, 21] we examined the existing published litera-ture for suitable non-proteomics data that could be used to validate our experimental approach. Recently, a large post-mortem study examined the mRNA expression levels in tissue from late-onset AD and control patients (cerebellum, pre-frontal cortex, and visual cortex) and
provided data on the correlation between transcript levels and brain atrophy and Braak staging, which pro-vides a measure of tangle pathology [22]. Using this dataset, we asked whether proteins that we found to be significantly correlated to cognitive performance (MMSE) also show a significant correlation between pre-frontal cor-tex transcript level and brain pathology (Braak stage and
a
b
c
a
c
d
b
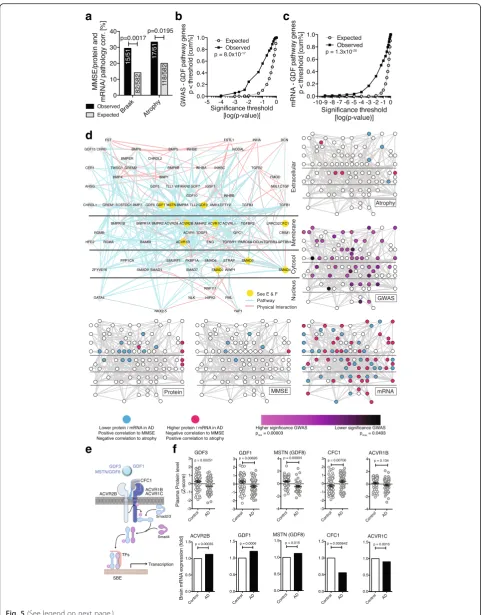
atrophy). And indeed, 29.4 % of the proteins (15/51) we had identified using MMSE as trait also have significant transcript-Braak stage correlations (p= 0.0017, Chi2-test, Fig. 5a), while 33.3 % (17/51) exhibited transcript-atrophy correlations (p= 0.0195, Chi2-test, Fig. 5a). This supports the notion that our experimental approach focusing on cir-culatory signaling proteins is able to enrich for proteins linked to AD brain pathology.
The results thus far from the differential protein level analysis, the correlations with cognitive function, and the co-expression network analysis consistently impli-cate the complement pathway, apoptosis, and a signaling network around the TGFβsuperfamily in AD. We were particularly intrigued by this latter network, and its GDF family members, many of which had not been linked to AD. To further validate the significance of this finding we asked whether any of the proteins in this pathway – including intra- or extracellular ones not measured with the array – were additionally linked to AD at the gen-omic or transcript level. We used the Gene Ontology to identify a list of 114 genes linked to the TGFβ/GDF/ BMP signaling pathway (Additional file 2) and queried two large AD data sets consisting of meta-data from 10 genome-wide association studies with a total of 8,309 AD cases and 7,366 cognitively normal elders [23] and AD brain transcriptome data from 181 AD and 125 controls [24] for significant SNPs or mRNA changes within the TGFβ/GDF/BMP pathway associated with AD.
We found significantly more SNPs in genes associated with TGFβ/GDF/BMP signaling than what would be ex-pected by chance (p= 8.0×10⁻¹⁷, Kolmogorov-Smirnov test, Fig. 5b). Specifically, several genes that are involved in GDF3/Activin-receptor signaling had significant asso-ciations (GDF3, ACVR1B, SMAD3; see Additional file 2). Similarly, we found significantly more mRNAs with altered expression in AD brains associated with TGFβ/ GDF/BMP signaling than what would be expected by chance (p= 1.3×10⁻²⁰, Kolmogorov-Smirnov test, Fig. 5c and Additional file 2), including CFC1 (Cripto, a co-factor of GDF3), and Activin-receptor subunits 2B and 1C (ACVR2B/ACVR1C, GDF3 receptors). Taken together, multiple layers of experimental evidence suggest that changes at the genome, the transcriptome, and the prote-ome level in TGFβ/GDF/BMP signaling are associated with AD (Fig. 5d-f).
Activin receptors and its ligands Inhibin A and B, GDF1, GDF3, GDF5, and the ligand binding proteins CFC1/cripto and gremlin were most prominently altered in AD throughout our study (Figs. 1d, 3c, 4d, 5f ). While TGFβand TGFβ-receptor signaling has been studied ex-tensively in the context of AD and neuroinflammation [25, 26], and BMP9/GDF2 has been identified as a regu-lator of cholinergic neuronal development [27], Activin receptor signaling and GDFs have not been studied in AD.
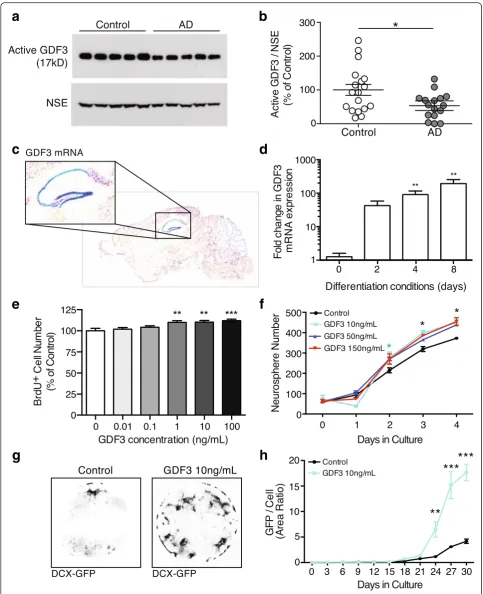
GDF3 represents a particularly intriguing candidate: it is highly expressed in the human brain [28] and mouse den-tate gyrus (Fig. 6a), is part of the co-expression cluster a (Fig. 4c and d), exhibits significant SNP enrichment (Add-itional file 2), is positively correlated with cognitive per-formance (pperm= 0.038), yet its effects on neurons or the
brain are unknown.
Given that we observed reduced GDF3 plasma levels, we first investigated whether these changes may be re-flective of GDF3 levels in human AD brains. To do this, we measured the processed, active form of GDF3 in tissue extracts of AD and age matched control patients and found a significant reduction in the cortex (n= 16–18 sub-jects per group,p= 0.02, Fig. 6b), but not in the cerebel-lum, an area unaffected by AD (n= 8 subjects per group,
p= 0.15, Additional file 1: Figure S6A and B). To evaluate our svPPAvsAD comparison, which predicted that GDF3 reduction is AD-specific, we measured activated GDF3 in cortical extracts from svPPA patients and controls and found no difference in GDF3 levels (n= 5 subjects per group, p= 0.08, opposite trend to AD, Additional file 1: Figure S6 C and D). While these studies support our plasma proteomic findings, the source and functional sig-nificance of GDF3 within the brain remain unclear.
a
d
e
f
b
c
such as the Repressor element 1-silencing transcription factor (REST) in AD pathology [35]. Intriguingly, GDF3 and REST appear to be controlled by shared transcrip-tion factor binding [36], potentially hinting at common upstream disturbances. Taken together these findings suggest that GDF3 plays an important role in NPC pro-liferation and neuronal differentiation and that it’s levels are altered in AD.
Discussion
This study uses a new approach to discover biological pathways associated with AD dementia by measuring hundreds of circulatory proteins involved in cellular communication. Combined with multiple levels of statis-tical and bioinformatics analyses and leveraging current pathway knowledge, we were able to build networks of proteins deregulated in AD. We provide evidence that this approach has considerable robustness for the discovery of proteins and pathways linked to AD and successfully val-idate it against existing datasets. We show that genomic and transcriptomic data can be used to corroborate sus-pected disease-specific pathways and identify GDF3 as a new regulator of adult neurogenesis. Given the important function adult hippocampal neurogenesis has in rodent behavior related to memory and learning, the recent discovery of significant hippocampal neurogenesis in the adult human brain even with advanced age [37], and previous implications of disturbed neurogenesis in AD [38, 39], changes in neurogenesis caused by abnormal GDF3 signaling might well have a role in the development or progression of AD.
Currently, our approach is limited only by the availabil-ity of high-qualavailabil-ity, verified antibodies able to reliably bind signaling molecules in plasma. Future developments in the production of antibodies or antibody alternatives such as aptamteres [40, 41] will likely enable researchers to probe even broader sets of circulating antigens. However, with increasingly large numbers of analytes ever-closer atten-tion has to be paid to the statistical methods involved in identifying interesting candidates. Independent sample cohorts that are probed using different experimental
approaches should always be considered, similar to the approach we are taking in this study. Nevertheless, there are certain limitations to consider when pursuing the bio-logical interpretation of high-throughput proteomic stud-ies [42]: (1) Protein coexpression data is currently still fairly noisy, resulting in networks with noisy edges making cluster definition challenging. To deal with this problem we based most of our analysis on much more vetted path-way or protein-protein interaction data. (2) Most proteins act in transient and changing complexes and how to de-fine these overlapping clusters is not trivial. (3) Similarly difficult is to avoid arbitrarily breaking large clusters into random smaller ones and to identify the“correct”number of clusters from a priori knowledge. (4) If possible, running replicates will reduce clustering error and using learning through training and test sets can similarly im-prove the validity of the results [43]. However, availability of precious sample material and cohort sizes often limits the ability to perform these steps. Encouragingly, these limitations are subject to very active ongoing research efforts and novel methodologies will likely enable us to avoid many of these pitfalls in the future.
Motivated by the idea to specifically monitor the cellular communication factors secreted into the bloodstream, we naturally had a strong representation of inflammatory and growth factor related proteins in our screen. In the complete human proteome, additional proteins and pro-tein fragments have the potential to being secreted into the bloodstream and could provide mechanistic insight into further pathological processes active in AD, which we likely missed in our current screening format. Additional pathways or protein sets could easily be added to future versions of the screening platform as antibodies become available. Conversely, there may be other inflammatory and signaling-related pathologies that were left undiscov-ered due to limited sample numbers and increasing cohort sizes could ameliorate this limitation, although we esti-mate to have recovered 50–75 % of the true positive hits (Additional file 1: Figure S4). Finally, using gene ontology enrichment to identify classes of interesting genes inher-ently carries over the annotation and research bias present (See figure on previous page.)
a
c
e
f
h
g
d
b
from GO [44]. This can be mediated somewhat by using more data-driven ontology approaches such as NeXO and CliXO [45, 46], although research bias cannot be over-come that way. We thus encourage the reader to not purely rely on the enrichment terms that we provide for the identified protein clusters, but to interpret the proteins of interest in the broader framework of biological knowledge.
Over the past decade, numerous studies [20, 21, 47–59] have been performed to identify biomarker sets in AD plasma samples (Additional file 1: Figure S1A), leading to the recognition of a number of biological pathways and proteins potentially affected in the disease [60]. Analyz-ing pathway enrichment in combined cohorts from multiple studies, Kiddle and colleagues [3] found the most significant enrichment in proteins linked to “Complement and coagulation cascades”(p= 9.78 × 10⁻²⁵) and “Cytokine-cytokine receptor interaction” (p= 2.07 × 10⁻¹⁸), which is in good agreement with the pathways implicated in our screen (Figs. 3 and 4). Using a similar meta-analysis approach to identify individual proteins related to AD pathology, Chiam et al. report multi-cohort support for the involvement of Complement C3, Complement Factor H, and Plasma protease C1 inhibi-tor [60], all of which were identified in our screen as well (Fig. 3). For many of the other proteins and path-ways implicated in this study (for example GDF), little comparable data exist, as they are not covered by the most widely used Rules Based Medicine (RBM) 190 analyte panel.
The approach presented here could be extended to study abnormal cellular processes in other CNS diseases or conditions where affected tissues are similarly difficult to access. Collectively, our data support the presence of an accessible and informative link between molecular (mRNA), cellular (Braak stages), structural (atrophy), and functional (MMSE) changes in the brain and circulatory signaling proteins. Exploiting this link, may aid in the de-sign of novel therapeutic and early diagnostic strategies for sporadic AD.
Conclusion
Neurodegenerative disorders are widespread, devastating, poorly understood, and largely untreatable with current knowledge. One difficulty lies in the fact that the brain is extraordinarily sensitive and cannot easily be examined on the cellular or molecular level in the diseased patient. Here, we instead created and analyzed a large set of blood protein data from Alzheimer’s disease and healthy control patients for changes in cellular communication factors, leading to the discovery and validation of altered GDF sig-naling in sporadic Alzheimer’s disease brain tissue. We achieve this by integrating multiple levels of ‘omics data, linking blood to brain tissue changes, thus opening up po-tentially new avenues for treatment and diagnosis.
Methods
Nomenclature
This is a proteomics study. To highlight this fact, we la-beled hits in the first analyses (Figs. 1b and 2a) with pro-tein names. Due to space restrictions in figure design, we labeled hits in all other figures with the HUPO gene namesof the corresponding protein or mRNA products.
Human plasma samples
All participants underwent thorough and standardized history and physical exams. For the antibody arrays, we used a total of 99 archived human plasma samples with ethylenediaminetetraacetate (EDTA) as anticoagulant collected at the University of California San Francisco (San Francisco, CA) and the Mayo Clinic (Rochester, MN and Jacksonville, FL; Additional file 1: Table S1). Plasma was produced by standard blood processing, then aliquots were frozen and stored in aliquots at −80 °C, avoiding freeze thaw cycles. Informed consent was obtained from human subjects according to the ethics committee guide-lines at the respective clinical centers. All patients were clinically diagnosed with AD based on the 1984 NINCDS-ADRDA Alzheimer’s criteria with additional attention to the 2011 revisions [61] and (if possible) post-mortem tis-sue analysis (27 of the 47 AD cases). Details on the svPPA (See figure on previous page.)
Fig. 6GDF3 regulates neurogenesis and is reduced in AD brains.aTo test whether GDF3 levels are also reduced in AD brains, Human AD and control cortical grey matter regions were lysed and the detergent soluble protein fraction was probed by western blot. Levels of active GDF3 (b) were quantified relative to neuron-specific enolase (NSE).cTo identify areas in the brain where GDF3 may have a functional role, we referred to The Allen Brain Atlas, which showed strong RNA expression in the mouse hippocampus (blue = high expression).dUsing qPCR, GDF3 mRNA expression was detected in non-differentiated adult mouse NPCs and NPCs cultured in differentiating conditions.eTo determine whether GDF3 affects stem cell function, adult mouse NPCs were provided recombinant mouse GDF3 and NPC proliferation was assessed using BrdU.
plasma samples are provided in Additional file 1: Table S2. A total of 92 svPPA patients from the University of California San Francisco or Mayo Clinic Jacksonville were identified whose clinical features conformed to re-vised consensus diagnostic criteria for svPPA [62]. Patient consent had been administered at the respective sample collection centers and research has been conducted ac-cording to the principles expressed in the Declaration of Helsinki. Analysis of de-identified samples was performed with research approval by the Stanford University institu-tional review board.
Antibody-microarray production
Plasma protein levels were measured using antibody-based protein microarrays. We used a custom-expanded, commercially available microarray with modified anti-body content (custom L-Series, RayBiotech Inc., Norcross, GA) containing 474 antibodies against chemokines and cytokines printed in triplicates by the company, plus 17 control antibodies. Additionally, we produced a custom-made in-house array that contained a separate set of 119 antibodies against secreted signaling factors printed in quadruplicates, plus 7 control antibodies. A total of 617 antibodies were measured. Subsequent quality control steps removed 11 antibodies with extremely low or no sig-nal and control antibodies (seeAntibody-Microarray Data Preparation below) yielding a total of 582 analyzed anti-bodies (Additional file 2 and Additional file 1: Figure S1 and S2C). Some antibodies target the same protein mul-tiple times (such as precursor/full-length/truncated forms, 14 proteins and 32 antibodies total; see Additional file 2). The microarray production protocol was the following: antibodies of interest were selected based on their bio-logical role as secreted signaling factors and the availability of ELISA-grade quality batches to ensure likely detection of the epitope in liquid solution. The arrays were printed onto SuperEpoxy glass slides (Arrayit, Sunnyvale, CA) using a custom-built robotic microarrayer fitted with sixteen SMP4B pins (Arrayit). After drying the slides overnight they were vacuum-sealed and stored at−20 °C until use.
Plasma sample preparation and antibody-microarray incubation
The human plasma samples were thawed at room temperature and diluted 5-times in PBS without Ca2+/Mg2+ (pH 6.5) followed by 10,000 g centrifugation in a swing bucket centrifuge for 10 min at Room temperature. The lipid layer on top was carefully removed with the house vacuum. Without disturbing the platelet pellet 300 μl was carefully removed for dialysis (96 well Dispodialyzer/5 kDa, Harvard Apparatus, Holliston, MA) into PBS (pH 6.5) at 4 °C in multiple steps including a last over-night step to yield a maximally pure plasma protein fraction in an
appropriate buffer for the biotinylation reaction. The dialyzed plasma was diluted again 6-times in PBS and recombinant Green fluorescent protein (GFP) was spiked into the samples as positive control at a final concentration of 1 μg/ml. The plasma proteins were N-terminally bio-tinylated (NHS-SulfoBiotin, Thermo Scientific, Rockford, IL), reaction was stopped with 0.1 M glycin final concentra-tion and unbound biotin removed by multiple dialysis against PBS (pH 6.5 and last at pH 8). Then samples were diluted in 3 % casein in PBS (pH 7.4) and the individual samples were incubated on blocked antibody arrays over-night at 4 °C. Blocking was performed by incubating dried arrays in 4 °C precooled 3 % casein in PBS (pH 7.4) over-night on a shaker (30 rpm) at 4 °C. After multiple washing steps antibody-bound protein was detected using 0.5μg/ml Alexa Fluor 555 conjugated streptavidin (Invitrogen) on a GenePix Pro 4000B scanner (Molecular Devices, Sunnyvale, CA, Additional file 1: Figure S1D). Samples for both AD and svPPA studies were processed in parallel in randomized order in one batch.
Data processing and figure generation
Raw data from the array scanner were provided as im-ages (.tif files) and spot intensities (Excel.xls files; Micro-soft, Seattle, WA). Excel files were condensed into one file (tab-delimited.txt file) and non-analyzed data rows/ columns were removed using RDBmerge (Ron de Bruin, www.rondebruin.nl). Unless otherwise stated, data pro-cessing and statistical testing were performed in Matlab R2012a (MathWorks, Natick, MT). Figures were gener-ated directly in Matlab or data were transferred and plotted in Prism 5.0f (GraphPad Software, La Jolla, CA). Figures were then arranged for publishing using Illustrator CS5 and Photoshop CS5 (both Adobe, San Diego, CA).
Antibody-microarray data preparation
column-wise median from the values in each column/ row of data, so that the mean or median value of each column/row is 0) and normalized (multiply all values in each column/row of data by a scale factor S so that the sum of the squares of the values in each column/row is constant across columns/rows) following a procedure de-scribed in the Cluster 3.0 manual [63]. Finally the data were Z-scored, leaving approximately normally distributed data for analysis with a mean of 0 and a standard deviation of 1 (Additional file 1: Figure S2D to F, 86 % of all anti-bodies have normal distributions based on one-sample Kolmogorov-Smirnov test).
Principle component analysis
To assess the influence of potentially confounding factors such as plasma source, patient age, or patient gender, we performed a Principle Component Analysis in Matlab using the Z-scored data and the built-inprincompfunction.
Differential protein level analysis
To identify proteins with significant changes in plasma levels (based on Z-score values) we calculated permutation-corrected p-values (pcorr) for Control vs. AD for every
protein (unpaired two-tailed t-test, 10,000 class label permutations) using the mattest Matlab function. To compute false-discovery rates, we adopted a direct ap-proach to estimateq-values [64] using themafdrMatlab function. Proteins with a significant difference between AD and Control samples and aq< 0.05 were considered having different plasma levels (a total of 50 proteins). An identical approach was used for the svPPA data.
Network representation
To link the proteins with changed plasma levels to bio-logical pathways, we mapped these proteins onto known protein networks using the Genemania-app [65] in Cytoscape 3.0.1 [www.cytoscape.org, [66]]. Pathway data came from NCI-Nature [67], Reactome [68–70], and [71]. Physical interaction data came from Biogrid Small Scale [72], IREF Interact, and IREF Small Scale [73]. We allowed for some nodes above the significance threshold to be added by the algorithm to connect cliques (dashed nodes,p-value indicted in figure). To test for enrichment in biological function, we queried Gene Ontology [74, 75], KEGG [76], and Panther [77] databases using DAVID [13] with the 564 unique genes representing the 582 proteins tested as background.
Mini-mental State Exam (MMSE) correlation
MMSE scores were recorded at the time of plasma ac-quisition at the respective clinical centers. Scores were available for 44/47 AD patients and 26/52 Control pa-tients (Additional file 2 and Additional file 1: Table S1). MMSE scores were correlated to Z-scored protein levels
using Spearman’s rank correlation. Correlation significance was assessed using Spearman’s p-value (pRho: significance
that slope is not 0) and by computing an empiricalp-value by permuting protein scores over MMSE scores 1,000-times (pPerm: Number of times that random MMSE-Protein
data yields correlation greater than observed/1,000). Net-work representation was performed as described above.
Differential co-expression analysis
Co-expression analysis was performed to identify pro-teins involved in AD pathogenesis that would inform us on more specific pathways than the broad ones impli-cated in the differential analysis above. Besides the mere difference in expression levels, proteins may differ in how they correlate with each other between disease and controls. We sought to discover protein networks that are changed between AD and Control by evaluating dif-ferential correlation matrices in an approach analogous to methods developed for analyzing genetic interaction profiles [78]. We thus created separate correlation matri-ces (Spearman’s rank correlation) in Matlab of all of the proteins measured for AD and Control signaling pro-teomes, respectively. Since cohort sizes were almost equal for AD and Controls we then calculated differen-tial correlation profiles from these correlation matrices and used unsupervised clustering to identify 8 distinct clusters of proteins with highly similar differential cor-relation profiles (Fig. 4c, boxes). To demonstrate that differential co-expression data contains valuable biological information, we created semantic similarity scores for each protein pair [79]. Protein pairs with high differential co-expression profile correlation exhibited high semantic-similarity profile correlations as well (Additional file 1: Figure S5).
Braak staging and atrophy correlation
Braak staging and atrophy data were downloaded from the supplemental data file of [22]. We then filtered the data for mRNAs that had been reported to exhibit sig-nificant correlation to either Braak staging or atrophy data in the pre-frontal cortex. Expected values were cal-culated by determining the total number of proteins testedthat were reported to have significant correlations. Observed values were calculated by determining the total number of proteinswithin our MMSE correlation hit listthat were reported to have significant correlations. Sig-nificance testing was performed using the chi2-test.
Single Nucleotide Polymorphism (SNP) analysis
(ADGC) [23]. Naj et al. computed results for SNPs through-out the genome in their discovery sample composed of 8,309 AD cases and 7,366 cognitively normal elders from ten independent Caucasian data sets. Details of the proce-dures for quality control, genotype imputation, and popula-tion substructure adjustment are published elsewhere [23]. Genotyped and imputed SNPs were tested for association with AD in each dataset separately using a logistic general-ized linear model (GLM) in case–control datasets and a lo-gistic generalized estimating equation (GEE) in family-based datasets, controlling for intra-study population substructure. Genotyped SNPs were coded as 0, 1, or 2 according to the number of minor alleles under the additive genetic model. For imputed SNPs, a quantitative estimate between 0 and 2 for the dose of the minor allele were used to incorporate the uncertainty of the imputation estimates. All analyses were performed using the GEE [80] and GWAF [81] programs in the R statistical software package. SNP association results obtained from individual datasets were combined by meta-analysis using the inverse variance method imple-mented in the software package METAL [82] (http:// www.sph.umich.edu/csg/abecasis/Metal/index.html).
Gene-based multiple testing corrections
We corrected for testing multiple SNPs in a gene after accounting for correlation between SNP genotypes due to linkage disequilibrium. Each gene tested was treated as an independent hypothesis and the effective number of tests per gene was obtained by a previously described method [83]. The Versatile Gene-based Association Study (VEGAS) approach [84] was used to summarize the strength of association of a gene with AD based on the number of SNPs tested in the gene and size of the gene. This method computes a gene-based test statistic based on the SNPp-values within the gene, and then uses simu-lation to calculate an empirical gene-based p-value. The distribution of empirical p-values was then plotted and tested against an expected distribution of p-values using the Kolmogorov-Smirnov test.
mRNA expression analysis
The dataset comprises gene expression data from brain tissues that were posthumously collected from more than 600 individuals with AD diagnosis, HD diagnosis, or with normal non-demented brains. We used a subset of dorsolateral prefrontal cortex (PFC, Brodmann area 9) samples from 181 AD case and 125 controls. Only neuro-pathologically confirmed AD subjects with Braak stage > III were included in this profiling experiment; Braak stage and atrophy were assessed by pathologists at McLean Hospital (Belmont, MA). The samples were flash frozen in liquid ni-trogen vapor with an average postmortem interval (PMI) of about 18 h.
A total of 1 μg of mRNA extracted from each tissue sample was amplified to fluorescently labeled cRNA, and profiled by the Rosetta Gene Expression Laboratory in two phases using the Rosetta/Merck 44 k 1.1 microarray (GPL4372) (Agilent Technologies, Santa Clara, CA). The average RNA integrity number of 6.81 was sufficiently high for the microarray experiment monitoring 40,638 transcripts representing more than 31,000 unique genes. The expression levels were processed and normalized to the average of all samples in the batch from the same region using Rosetta Resolver (Rosetta Biosoftware, Seattle, WA).
All microarray data generated in this study are available through the National Brain Databank at the Harvard Brain Tissue Resource Center (http://www.brainbank.mclean.org/ ). This microarray dataset is MIAME compliant. The raw and final processed data for each hybridization are available upon request. The essential sample annotation including experimental factors and their values (e.g., gender, age, PMI, pH) is available and summarized in [24].
The differential gene expression was assessed using the standardt-test. The distribution ofp-values was then plotted and tested against an expected distribution of
p-values using the Kolmogorov-Smirnov test.
Western blot
Active GDF3 levels were determined in fresh tissue sam-ples not part of the plasma screen (Additional file 1: Table S3). Hippocampal samples were a random subset picked blindly from the same donors as the cortical sam-ples. All tissues or cells were lysed in RIPA buffer and total protein concentrations were determined with a BCA Protein Assay Kit (Thermo Scientific, Waltham, MA). 10–20μg of total protein was loaded for each sample into pre-cast 4–12 % bis-tris gels and run with MOPS buffer (Invitrogen, Carlsbad, CA). Gels were transferred onto PVDF membranes (Millipore, Billerica, MA). Antigen spe-cific primary antibodies were incubated overnight at 4 °C and detected with species-specific horseradish-peroxidase labeled secondary antibodies. An ECL Western Blotting Detection kit (GE Healthcare, Cleveland, OH) was used to obtain a chemiluminescence signal, which was detected using Amersham Hyperfilm ECL (GE Healthcare). Band quantification was performed using ImageJ software (ver-sion 1.46; NIH, Bethesda, MD). Bands of interest were nor-malized to actin or neuron specific enolase for a loading control. For active GDF3 we used anti-GDF3 antibodies from Novus Biologicals (Littleton, CO; NBP1-96508).
Cell culture assays
acid and designated concentrations of recombinant carrier-free human GDF3 (R&D Systems, Minneapolis, MN; at 0, 10, 50, or 150 ng/mL) were added to the culture media of each corresponding NTERA treatment well. Cells were maintained under these conditions for 2 weeks, during which media was replaced every 3 days. Cells were then cultured for an additional 2 weeks with continued GDF3 treatment, in the absence of retinoic acid.
Cellavista
Adult neurosphere number, eGFP expression (relative to cell confluence), and number of proliferating NPCs were quantified after GDF3 treatment using an Innovatis Cellavista Imager (Dynamic Devices, Wilmington, DE). To quantify NPC proliferation, 10x images were collected by Cellavista and BrdU+ nuclei were detected and quantified by Cellavista software using the cell nuclei count function.
Adult hippocampal NPC isolation
Hippocampal NPCs were isolated from 6 week old male and female mice [85]. NPCs were maintained on poly-D-lysine (Sigma, St. Lous, MO) and laminin (Invitrogen) coated 10 cm plastic plates in neurobasal A media (Invitrogen) with 1× B27 supplement without vitamin A (Invitrogen) and 1× GlutaMAX-I supplement (Invi-trogen) and 20 ng/ml each of recombinant human FGF-basic (Peprotech, Rocky Hill, NJ) and recombin-ant human EGF (Peprotech) at 37 °C and 5 % CO2. All experiments used NPCs below passage 20 and were repeated at least once with male NPCs and once with female NPCs.
GDF3 treatment of proliferating NPCs
5000 cells were plated per well in a 96 well poly-D-lysine/laminin-coated plate with 0, 0.01, 0.1, 1, 10 or 100 ng/ml recombinant mouse GDF3 (R&D Systems) in normal growth media. Cells were allowed to grow for 4 days, with a ½ media change on day 2 (which replaced full growth factors [85] and ½ of GDF3 treatment). After 4 days in treatment, 20 μM bromodeoxyuridine (BrdU, Sigma) in sterile PBS was added to all wells and cells were fixed with 4 % paraformaldehyde 2 h later for 10 min.
Immunocytochemistry
Fixed cells were rinsed with 0.1 M phosphate buffered saline (PBS) 3 times then blocked with 10 % normal donkey serum (NDS, Jackson ImmunoResearch, West Grove, PA) and 0.3 % Triton-X 100 (Sigma) in PBS for 30 min. Cells were incubated overnight in primary anti-body, rat anti-BrdU (1:500, AbD Serotech, Raleigh NC) in 10 % NDS in PBS at 4 °C. Cells were then rinsed and incubated in secondary antibody, Alexa488 anti-rat (1:200, Invitrogen) in 10 % NDS in PBS. After rinsing, total BrdU+ cells were imaged and quantified using an
automated Cellavista microscope system (Hoffman-La Roche, Basel, Switzerland).
NPC differentiation
Murine NPCs were differentiated for 8 days [85]. Briefly, cells were plated at 200,000 cells/well in a poly-D-lysine/ laminin-coated plate in either full growth factor media (20 ng/ml of EGF and FGF2; proliferative conditions) or in media with only 5 ng/ml FGF2. After 2 days, the proliferative wells and the 2d differentiation wells were harvested while the 4d and 8d wells received a complete media change to media with no growth factors added. At day 4, the 4d wells were harvested and the 8d wells received a ½ media change with no growth factors added. A ½ media change was repeated on day 6 and the remaining wells were harvested on day 8.
RNA harvesting and conversion to cDNA
Cells were removed from the plate using Accutase Cell Dissociation Reagent (Invitrogen) then centrifuged at 400 g for 5 min. The cell pellet was stored at −80 °C until later RNA extraction. RNA extraction was performed using the RNeasy Mini Kit (Qiagen, Venlo, Netherlands) as per manufacturer instructions. The resulting RNA was quantified using a nanodrop spectrophotometer and RNA purity was confirmed using A260/A280 ratios. 500 ng of RNA was treated with DNase I as per manufacturer in-structions (Invitrogen) to eliminate any genomic DNA contamination and then converted to cDNA using Super-Script III first-strand synthesis system (Invitrogen) as per manufacturer instructions. cDNA was diluted 1:5 in water.
Real-time quantitative PCR
2 μl of cDNA was quantified in duplicate for each sample using LightCycler 480 SYBR Green I (Roche) on a LightCy-cler 480 II as per manufacturer instructions. Cycling condi-tions were: 15 min at 95 °C, 45 cycles of [15 s at 94 °C, 25 s at 58 °C, 20 s at 72 °C]. Melt curve cycles immediately followed and were: 5 s at 95 °C, 1 min at 65 °C and then gradual temperature rise to 97 °C at a rate of 0.11 °C/s followed by 30s at 40 °C. GDF3 levels were normalized to MAPK3 [86] as a reference gene because MAPK3 has been shown not to change with differentiation in contrast to many other standard housekeeping genes such as actin, which change dramatically during the differentiation process [87]. Melt curve analysis was performed to verify primer specificity and all primers were tested in a dilution series before use. Data is displayed as fold change above proliferative condition mRNA levels using 2^(ΔΔCt) values. Primer sequences were obtained from the MIT/Harvard PrimerBank.
GDF3 fwd: 5’ATGCAGCCTTATCAACGGCTT
GDF3 rev: 5’AGGCGCTTTCTCTAATCCCAG
MAPK3 fwd: 5’TCCGCCATGAGAATGTTATAGGC
MAPK3 rev: 5’GGTGGTGTTGATAAGCAGATTGG
MAPK3 PrimerBankID: 21489933a1
Additional files
Additional file 1:Patient and antibody information, raw and processed data. (XLSX 6303 kb)
Additional file 2:Supplemental demographic informationTables S1-S3
and additionalFigures S1-S7. (PDF 2603 kb)
Abbreviations
AD:Alzheimer’s disease; BMP: bone morphogenetic protein;
BrdU: bromodeoxyuridine; Dcx: doublecortin; FTLD: frontotemporal lobar degeneration; GDF: growth-differentiation factor; GO: gene ontology; MMSE: mini-mental state examination; NPC: neural progenitor cells; SNP: single nucleotide polymorphism; svPPA: semantic-variant primary progressive aphasia.
Competing interest
R-PH and RH work for RayBiotech and provided custom slides at a discounted rate. No other competing interests exist.
Authors’contributions
PAJ extracted the array images, wrote the code to analyze the array data, and made all figures. KML, EDK, and RA, performed thein vivoGDF3 confirmation experiments. MB, HJ, RN, SP, and C-HS performed the plasma preparation, the array development, the array incubation and scanning. BV and LAF performed the GWAS analysis. R-PH and RH made substantial contributions to conception and design, and provided reagents for the array development. BFB, ALB, NF, NRG-R, AK, DSK, RCP, RR, SGY, EH, and BLM collected plasma samples for this study and provided pathological and neurological diagnostic expertise. EH and EM provided fresh brain tissue for GDF WB experiments and diagnosed the samples pathology. MH performed the semantic similarity analysis. AL and AP performed the mRNA expression analysis. PAJ, MB, and TWC conceived the experiments. PAJ, TI, and TWC wrote the manuscript. All authors read, revised critically for important intellectual content and approved the final version of the manuscript.
Acknowledgments
This work was supported by National Institutes of Health (NIH) grants R01AG045034 (TW-C), R01GM084279 (TI), P01HG005062 (TI), P30MH062261 (TI), P41GM103504 (TI), P50AG016574 (Mayo Clinic ADRC), U01AG006786 (BFB, DSK, RCP), R01AG038791 (ALB), P50AG023501 (BLM), P01AG019724 (BLM), P01AG16573 (EH), AG5131/AG/NIA (EM), AG18440/AG/NIA (EM) The Consortium for Frontotemporal Dementia (TW-C), Anonymous (TW-C), The Veterans Administration (TW-C), Tau Research Consortium (ALB), Alzheimer’s Drug Discovery Foundation (ALB), Bluefield Project (ALB). This research was conducted partially, while PAJ was an Ellison Medical Foundation/AFAR Postdoctoral Fellow. The funders had no role in study design, data collection and analysis, decision to publish, or preparation of the manuscript. This study’s contents are solely the responsibility of the authors and do not necessarily represent the official views of the National Institute on Aging or NIH. Guangdong Innovative Research Team Program (201001s0104659419) (RPH).
Author details
1
Department of Neurology and Neurological Sciences, Stanford University School of Medicine, Stanford, CA, USA.2Institute of Chemistry and
Biochemistry, Free University Berlin, Berlin, Germany.3Departments of
Bioengineering and Medicine, University of California San Diego, La Jolla, CA, USA.4Department of Medicine (Biomedical Genetics), Boston University Schools of Medicine, Boston, MA, USA.5RayBiotech, Guangzhou, China. 6RayBiotech, Norcrosse, GA, USA.7Department of Neurology, Mayo Clinic,
Rochester, MN, USA.8Department of Neurology, University of California San
Francisco, San Francisco, CA, USA.9Departments of Neurology, Ophthalmology, Genetics and Genomics, Epidemiology, and Biostatistics, Boston University Schools of Medicine and Public Health, Boston, MA, USA.
10Department of Neuroscience, Mayo Clinic, Jacksonville, FL, USA.
11Department of Neurology, Mayo Clinic, Jacksonville, FL, USA.
12Departments of Pharmacology and Nutritional Sciences and Sanders-Brown
Center on Aging, University of Kentucky, Lexington, KY, USA.13Department
of Computer Science and Engineering, University of California San Diego, La Jolla, CA, USA.14Genetics and Pharmacogenomics, Merck Research
Laboratories, West Point, PA, USA.15Department of Pathology, University of
California San Diego, La Jolla, CA, USA.16Center for Tissue Regeneration,
Repair and Restoration, VA Palo Alto Health Care System, Palo Alto, CA, USA.
17Present address: Biology Department, Eastern Connecticut State University,
Willimantic, CT, USA.18Present address: Roche Pharma Research and Early
Development, NORD DTA, Roche Innovation, Center Basel, Basel, Switzerland.
Received: 25 November 2015 Accepted: 8 April 2016
References
1. Rifai N, Gillette MA, Carr SA. Protein biomarker discovery and validation: the long and uncertain path to clinical utility. Nat Biotechnol. 2006;24:971–83. 2. Mallick P, Kuster B. Proteomics: a pragmatic perspective. Nat Biotechnol.
2010;28:695–709.
3. Kiddle SJ, Sattlecker M, Proitsi P, Simmons A, Westman E, Bazenet C, Nelson SK, Williams S, Hodges A, Johnston C, Soininen H, Kłoszewska I, Mecocci P, Tsolaki M, Vellas B, Newhouse S, Lovestone S, Dobson RJB. Candidate blood proteome markers of Alzheimer's disease onset and progression: a systematic review and replication study. J Alzheimers Dis. 2014;38:515–31. 4. Jaeger PA, Villeda SA, Berdnik D, Britschgi M, Wyss-Coray T. Focused plasma
proteomics for the study of brain aging and neurodegeneration. In: Coppola G, editor. The OMICS: Applications in Neuroscience. New York: Oxford Univ. Press; 2014. p. 183–91.
5. Snowden J, Neary D, Mann D. Frontotemporal lobar degeneration: clinical and pathological relationships. Acta Neuropathol. 2007;114:31–8. 6. Hodges JR, Mitchell J, Dawson K, Spillantini MG, Xuereb JH, McMonagle P,
Nestor PJ, Patterson K. Semantic dementia: demography, familial factors and survival in a consecutive series of 100 cases. Brain. 2010;133:300–6. 7. Miller ZA, Rankin KP, Graff-Radford NR, Takada LT, Sturm VE, Cleveland CM,
Criswell LA, Jaeger PA, Stan T, Heggeli KA, Hsu SC, Karydas A, Khan BK, Grinberg LT, Gorno-Tempini M-L, Boxer AL, Rosen HJ, Kramer JH, Coppola G, Geschwind DH, Rademakers R, Seeley WW, Wyss-Coray T, Miller BL. TDP-43 frontotemporal lobar degeneration and autoimmune disease. J Neurol Neurosurg Psychiatr. 2013;84:956–62.
8. La Joie R, Landeau B, Perrotin A, Bejanin A, Egret S, Pélerin A, Mézenge F, Belliard S, de La Sayette V, Eustache F, Desgranges B, Chételat G. Intrinsic connectivity identifies the hippocampus as a main crossroad between Alzheimer’sand semantic dementia-targeted networks. Neuron. 2014;81:1417–28. 9. Jaeger PA. Cytokine and Leukocyte Profiling Reveal Pro-Inflammatory and
Autoimmune Features in Frontotemporal Dementia Patients. http://dx.doi.org/10.1101/049791.
10. Folstein MF, Folstein SE, McHugh PR.“Mini-mental state.”A practical method for grading the cognitive state of patients for the clinician. J Psychiatr Res. 1975;12:189–98.
11. de La Fuente A. From‘differential expression’to‘differential networking’ – identification of dysfunctional regulatory networks in diseases. Trends Genet. 2010;26:326–33.
12. Eisen MB, Spellman PT, Brown PO, Botstein D. Cluster analysis and display of genome-wide expression patterns. Proc Natl Acad Sci U S A. 1998;95:14863–8. 13. Huang DW, Sherman BT, Lempicki RA. Systematic and integrative analysis of
large gene lists using DAVID bioinformatics resources. Nat Protoc. 2009;4:44–57. 14. Huang DW, Sherman BT, Lempicki RA. Bioinformatics enrichment tools:
paths toward the comprehensive functional analysis of large gene lists. Nucleic Acids Res. 2009;37:1–13.
15. Lewis RD, Perry MJ, Guschina IA, Jackson CL, Morgan BP, Hughes TR. CD55 deficiency protects against atherosclerosis in ApoE-deficient mice via C3a modulation of lipid metabolism. Am J Pathol. 2011;179:1601–7. 16. Wada H, Ura S, Kitaoka S, Satoh-Asahara N, Horie T, Ono K, Takaya T,
Takanabe-Mori R, Akao M, Abe M, Takanabe-Morimoto T, Murayama T, Yokode M, Fujita M, Shimatsu A, Hasegawa K. Distinct characteristics of circulating vascular endothelial growth factor-a and C levels in human subjects. PLoS ONE. 2011;6, e29351.
18. Strickertsson JAB, Døssing KBV, Aabakke AJM, Nilsson H-O, Hansen TVO, Knigge U, Kjær A, Wadström T, Friis-Hansen L. Interferon-γinhibits ghrelin expression and secretion via a somatostatin-mediated mechanism. World J Gastroenterol. 2011;17:3117–25.
19. Shibanuma M, Mashimo J, Mita A, Kuroki T, Nose K. Cloning from a mouse osteoblastic cell line of a set of transforming-growth-factor-beta 1-regulated genes, one of which seems to encode a follistatin-related polypeptide. Eur J Biochem. 1993;217:13–9.
20. Britschgi M, Rufibach K, Huang SLB, Clark CM, Kaye JA, Li G, Peskind ER, Quinn JF, Galasko DR, Wyss-Coray T. Modeling of pathological traits in Alzheimer's disease based on systemic extracellular signaling proteome. Mol Cell Proteomics. 2011;10:M111. 008862.
21. Ray S, Britschgi M, Herbert C, Takeda-Uchimura Y, Boxer A, Blennow K, Friedman LF, Galasko DR, Jutel M, Karydas A, Kaye JA, Leszek J, Miller BL, Minthon L, Quinn JF, Rabinovici GD, Robinson WH, Sabbagh MN, So YT, Sparks DL, Tabaton M, Tinklenberg J, Yesavage JA, Tibshirani R, Wyss-Coray T. Classification and prediction of clinical Alzheimer's diagnosis based on plasma signaling proteins. Nat Med. 2007;13:1359–62.
22. Zhang B, Gaiteri C, Bodea L-G, Wang Z, McElwee J, Podtelezhnikov AA, Zhang C, Xie T, Tran L, Dobrin R, Fluder E, Clurman B, Melquist S, Narayanan M, Suver C, Shah H, Mahajan M, Gillis T, Mysore J, MacDonald ME, Lamb JR, Bennett DA, Molony C, Stone DJ, Gudnason V, Myers AJ, Schadt EE, Neumann H, Zhu J, Emilsson V. Integrated systems approach identifies genetic nodes and networks in late-onset Alzheimer's disease. Cell. 2013; 153:707–20.
23. Naj AC, Jun G, Beecham GW, Wang L-S, Vardarajan BN, Buros J, Gallins PJ, Buxbaum JD, Jarvik GP, Crane PK, Larson EB, Bird TD, Boeve BF, Graff-Radford NR, De Jager PL, Evans D, Schneider JA, Carrasquillo MM, Ertekin-Taner N, Younkin SG, Cruchaga C, Kauwe JSK, Nowotny P, Kramer P, Hardy J, Huentelman MJ, Myers AJ, Barmada MM, Demirci FY, Baldwin CT, et al. Common variants at MS4A4/ MS4A6E, CD2AP, CD33 and EPHA1 are associated with late-onset Alzheimer's disease. Nat Genet. 2011.
24. Podtelezhnikov AA, Tanis KQ, Nebozhyn M, Ray WJ, Stone DJ, Loboda AP. Molecular insights into the pathogenesis of Alzheimer's disease and its relationship to normal aging. PLoS ONE. 2011;6, e29610.
25. Wyss-Coray T, Lin C, Yan F, Yu GQ, Rohde M, McConlogue L, Masliah E, Mucke L. TGF-beta1 promotes microglial amyloid-beta clearance and reduces plaque burden in transgenic mice. Nat Med. 2001;7:612–8. 26. Town T, Laouar Y, Pittenger C, Mori T, Szekely CA, Tan J, Duman RS, Flavell
RA. Blocking TGF-β–Smad2/3 innate immune signaling mitigates Alzheimer-like pathology. Nat Med. 2008.
27. Burke RM, Norman TA, Haydar TF, Slack BE, Leeman SE, Blusztajn JK, Mellott TJ. BMP9 ameliorates amyloidosis and the cholinergic defect in a mouse model of Alzheimer's disease. Proc Natl Acad Sci U S A. 2013;110:19567–72. 28. Hexige S, Guo J, Ma L, Sun Y, Liu X, Ma L, Yan X, Li Z, Yu L. Expression
pattern of growth/differentiation factor 3 in human and murine cerebral cortex, hippocampus as well as cerebellum. Neurosci Lett. 2005;389:83–7.
29. Levine AJ, Brivanlou AH. GDF3, a BMP inhibitor, regulates cell fate in stem cells and early embryos. Development. 2006;133:209–16.
30. Levine AJ, Brivanlou AH. GDF3 at the crossroads of TGF-beta signaling. Cell Cycle. 2006;5:1069–73.
31. Tykwinska K, Lauster R, Knaus P, Rosowski M. Growth and differentiation factor 3 induces expression of genes related to differentiation in a model of cancer stem cells and protects them from retinoic acid-induced apoptosis. PLoS ONE. 2013;8, e70612.
32. Calloni R, Cordero EAA, Henriques JAP, Bonatto D. Reviewing and updating the major molecular markers for stem cells. Stem Cells Dev. 2013;22:1455–76. 33. Li Q, Liu X, Wu Y, An J, Hexige S, Ling Y, Zhang M, Yang X, Yu L. The
conditioned medium from a stable human GDF3-expressing CHO cell line, induces the differentiation of PC12 cells. Mol Cell Biochem. 2011;359:115–23. 34. Villeda SA, Luo J, Mosher KI, Zou B, Britschgi M, Bieri G, Stan TM, Fainberg N,
Ding Z, Eggel A, Lucin KM, Czirr E, Park J-S, Couillard-Després S, Aigner L, Li G, Peskind ER, Kaye JA, Quinn JF, Galasko DR, Xie XS, Rando TA, Wyss-Coray T. The ageing systemic milieu negatively regulates neurogenesis and cognitive function. Nature. 2011;477:90–4.
35. Lu T, Aron L, Zullo J, Pan Y, Kim H, Chen Y, Yang T-H, Kim H-M, Drake D, Liu XS, Bennett DA, Colaiácovo MP, Yankner BA. REST and stress resistance in ageing and Alzheimer's disease. Nature. 2014;507:448–54.
36. Kidder BL, Yang J, Palmer S. Stat3 and c-Myc genome-wide promoter occupancy in embryonic stem cells. PLoS ONE. 2008;3, e3932.
37. Spalding KL, Bergmann O, Alkass K, Bernard S, Salehpour M, Huttner HB, Boström E, Westerlund I, Vial C, Buchholz BA, Possnert G, Mash DC, Druid H, Frisén J. Dynamics of hippocampal neurogenesis in adult humans. Cell. 2013;153:1219–27. 38. Tsai K-J, Tsai Y-C, Shen C-KJ. G-CSF rescues the memory impairment of
animal models of Alzheimer's disease. J Exp Med. 2007;204:1273–80. 39. Ma Q-H, Futagawa T, Yang W-L, Jiang X-D, Zeng L, Takeda Y, Xu R-X,
Bagnard D, Schachner M, Furley AJ, Karagogeos D, Watanabe K, Dawe GS, Xiao Z-C. A TAG1-APP signalling pathway through Fe65 negatively modulates neurogenesis. Nat Cell Biol. 2008;10:283–94.
40. Sattlecker M, Kiddle SJ, Newhouse S, Proitsi P, Nelson S, Williams S, Johnston C, Killick R, Simmons A, Westman E, Hodges A, Soininen H, Kłoszewska I, Mecocci P, Tsolaki M, Vellas B, Lovestone S, Dobson RJB, Consortium TA. Alzheimer's disease biomarker discovery using SOMAscan multiplexed protein technology. Alzheimers Dement. 2014;10:724–34.
41. Zhao X, Lejnine S, Spond J, Zhang C, Ramaraj TC, Holder DJ, Dai H, Weiner R, Laterza OF. A candidate plasma protein classifier to identify Alzheimer's disease. J Alzheimers Dis. 2015;43:549–63.
42. Wang J, Li M, Deng Y, Pan Y. Recent advances in clustering methods for protein interaction networks. BMC Genomics. 2010;11:S10.
43. Dalton L, Ballarin V, Brun M. Clustering algorithms: on learning, validation, performance, and applications to genomics. Curr Genomics. 2009;10:430–45. 44. Schnoes AM, Ream DC, Thorman AW, Babbitt PC, Friedberg I. Biases in the
experimental annotations of protein function and their effect on Our understanding of protein function space. PLoS Comput Biol. 2013;9, e1003063. 45. Dutkowski J, Ono K, Kramer M, Yu M, Pratt D, Demchak B, Ideker T. NeXO
Web: the NeXO ontology database and visualization platform. Nucleic Acids Res. 2013;42:D1269–74.
46. Kramer M, Dutkowski J, Yu M, Bafna V, Ideker T. Inferring gene ontologies from pairwise similarity data. Bioinformatics. 2014;30:i34–42.
47. O'Bryant SE, Xiao G, Barber R, Reisch J, Doody R, Fairchild T, Adams P, Waring S, Diaz-Arrastia R, for the Texas Alzheimer's Research Consortium. A serum protein-based algorithm for the detection of Alzheimer disease. Arch Neurol. 2010;67:1077–81.
48. Hu WT, Chen-Plotkin A, Arnold SE, Grossman M, Clark CM, Shaw LM, Mccluskey L, Elman L, Karlawish J, Hurtig HI, Siderowf A, Lee VM-Y, Soares H, Trojanowski JQ. Biomarker discovery for Alzheimer“s disease, frontotemporal lobar degeneration, and Parkinson”s disease. Acta Neuropathol. 2010;120:385–99. 49. Craig-Schapiro R, Kuhn M, Xiong C, Pickering EH, Liu J, Misko TP, Perrin RJ,
Bales KR, Soares H, Fagan AM. Multiplexed immunoassay panel identifies novel CSF biomarkers for Alzheimer's disease diagnosis and prognosis. PLoS ONE. 2011;6, e18850.
50. Soares HD, Potter WZ, Pickering E, Kuhn M, Immermann FW, Shera DM, Ferm M, Dean RA, Simon AJ, Swenson F, Siuciak JA, Kaplow J, Thambisetty M, Zagouras P, Koroshetz WJ, Wan HI, Trojanowski JQ, Shaw LM, Biomarkers Consortium Alzheimer's Disease Plasma Proteomics Project. Plasma biomarkers associated with the apolipoprotein E genotype and Alzheimer disease. Arch Neurol. 2012;69:1310–7.
51. Ringman JM, Elashoff D, Geschwind DH, Welsh BT, Gylys KH, Lee C, Cummings JL, Cole GM. Plasma signaling proteins in persons at genetic risk for Alzheimer disease: influence of APOE genotype. Arch Neurol. 2012;69:757–64. 52. Doecke JD, Laws SM, Faux NG, Wilson W, Burnham SC, Lam C-P, Mondal A,
Bedo J, Bush AI, Brown B, De Ruyck K, Ellis KA, Fowler C, Gupta VB, Head R, Macaulay SL, Pertile K, Rowe CC, Rembach A, Rodrigues M, Rumble R, Szoeke C, Taddei K, Taddei T, Trounson B, Ames D, Masters CL, Martins RN, Alzheimer's Disease Neuroimaging Initiative, Australian Imaging Biomarker and Lifestyle Research Group. Blood-based protein biomarkers for diagnosis of Alzheimer disease. Arch Neurol. 2012;69:1318–25.
53. Hu WT, Holtzman DM, Fagan AM, Shaw LM, Perrin R, Arnold SE, Grossman M, Xiong C, Craig-Schapiro R, Clark CM, Pickering E, Kuhn M, Chen Y, Van Deerlin VM, Mccluskey L, Elman L, Karlawish J, Chen-Plotkin A, Hurtig HI, Siderowf A, Swenson F, Lee VM-Y, Morris JC, Trojanowski JQ, Soares H, Initi ADN. Plasma multianalyte profiling in mild cognitive impairment and Alzheimer disease. Neurology. 2012;79:897–905.
54. Leung V, Gillis J, Raboud J, Cooper C, Hogg RS, Loutfy MR, Machouf N, Montaner JSG, Rourke SB, Tsoukas C, Klein MB, CANOC Collaboration. Predictors of CD4:CD8 ratio normalization and its effect on health outcomes in the era of combination antiretroviral therapy. PLoS ONE. 2013;8:e77665. 55. Llano DA, Devanarayan V, Simon AJ, ADNI. Evaluation of plasma proteomic
56. Guo L-H, Alexopoulos P, Wagenpfeil S, Kurz A, Perneczky R, Neuroimaging AD. Plasma proteomics for the identification of Alzheimer disease. Alzheimer Dis Assoc Disord. 2013;27:337–42.
57. Burnham SC, Faux NG, Wilson W, Laws SM, Ames D, Bedo J, Bush AI, Doecke JD, Ellis KA, Head R, Jones G, Kiiveri H, Martins RN, Rembach A, Rowe CC, Salvado O, Macaulay SL, Masters CL, Villemagne VL, Initiative ARSDN, Australian Imaging BALSRG. A blood-based predictor for neocortical Ab burden in Alzheimer’s disease: results from the AIBL study. Mol Psychiatry. 2013;19:519–26.
58. Delaby C, Gabelle A, Blum D, Schraen-Maschke S, Moulinier A, Boulanghien J, Séverac D, Buée L, Rème T, Lehmann S. Central nervous system and peripheral inflammatory processes in Alzheimer’s disease: biomarker profiling approach. Front Neurol. 2015;6:103.
59. Lehallier B, Essioux L, Gayan J, Alexandridis R, Nikolcheva T, Wyss-Coray T, Britschgi M, for the Alzheimer's Disease Neuroimaging Initiative. Combined plasma and cerebrospinal fluid signature for the prediction of midterm progression from mild cognitive impairment to Alzheimer disease. JAMA Neurol. 2015;1.
60. Chiam JTW, Dobson RJB, Kiddle SJ, Sattlecker M. Are blood-based protein biomarkers for Alzheimer's disease also involved in other brain disorders? A systematic review. J Alzheimers Dis. 2015;43:303–14.
61. McKhann GM, Knopman DS, Chertkow H, Hyman BT, Jack Jr CR, Kawas CH, Klunk WE, Koroshetz WJ, Manly JJ, Mayeux R, Mohs RC, Morris JC, Rossor MN, Scheltens P, Carillo MC, Thies B, Weintraub S, Phelps CH. The diagnosis of dementia due to Alzheimer’s disease: recommendations from the national institute on aging and the Alzheimer’s association workgroup. Alzheimers Dement. 2011;1–7.
62. Gorno-Tempini ML, Hillis AE, Weintraub S, Kertesz A, Mendez M, Cappa SF, Ogar JM, Rohrer JD, Black S, Boeve BF, Manes F, Dronkers NF,
Vandenberghe R, Rascovsky K, Patterson K, Miller BL, Knopman DS, Hodges JR, Mesulam MM, Grossman M. Classification of primary progressive aphasia and its variants. Neurology. 2011;76:1006–14.
63. Eisen M, de Hoon M. Cluster 3.0 Manual. 2002. p. 1–34.
64. Storey JD. A direct approach to false discovery rates - Storey - 2002 - Journal of the Royal Statistical Society: Series B. J R Stat Soc Ser B. 2002;64:479–98. 65. Montojo J, Zuberi K, Rodriguez H, Kazi F, Wright G, Donaldson SL, Morris Q,
Bader GD. GeneMANIA Cytoscape plugin: fast gene function predictions on the desktop. Bioinformatics. 2010;26:2927–8.
66. Shannon P, Markiel A, Ozier O, Baliga NS, Wang JT, Ramage D, Amin N, Schwikowski B, Ideker T. Cytoscape: a software environment for integrated models of biomolecular interaction networks. Genome Res. 2003;13:2498–504. 67. Schaefer CF, Anthony K, Krupa S, Buchoff J, Day M, Hannay T, Buetow KH. PID:
the Pathway Interaction Database. Nucleic Acids Res. 2009;37(Database):D674–9. 68. Croft D, O'Kelly G, Wu G, Haw R, Gillespie M, Matthews L, Caudy M, Garapati
P, Gopinath G, Jassal B, Jupe S, Kalatskaya I, Mahajan S, May B, Ndegwa N, Schmidt E, Shamovsky V, Yung C, Birney E, Hermjakob H, D'Eustachio P, Stein L. Reactome: a database of reactions, pathways and biological processes. Nucleic Acids Res. 2010;39(Database):D691–7.
69. Joshi-Tope G. Reactome: a knowledgebase of biological pathways. Nucleic Acids Res. 2004;33(Database issue):D428–32.
70. Croft D, Mundo AF, Haw R, Milacic M, Weiser J, Wu G, Caudy M, Garapati P, Gillespie M, Kamdar MR, Jassal B, Jupe S, Matthews L, May B, Palatnik S, Rothfels K, Shamovsky V, Song H, Williams M, Birney E, Hermjakob H, Stein L, D'Eustachio P. The reactome pathway knowledgebase. Nucleic Acids Res. 2013;42:D472–7.
71. Wu G, Feng X, Stein L. A human functional protein interaction network and its application to cancer data analysis. Genome Biol. 2010;11:R53. 72. Chatr-aryamontri A, Breitkreutz BJ, Oughtred R, Boucher L, Heinicke S, Chen
D, Stark C, Breitkreutz A, Kolas N, O'Donnell L, Reguly T, Nixon J, Ramage L, Winter A, Sellam A, Chang C, Hirschman J, Theesfeld C, Rust J, Livstone MS, Dolinski K, Tyers M. The BioGRID interaction database: 2015 update. Nucleic Acids Res. 2015;43:D470–8.
73. Turner B, Razick S, Turinsky AL, Vlasblom J, Crowdy EK, Cho E, Morrison K, Donaldson IM, Wodak SJ. iRefWeb: interactive analysis of consolidated protein interaction data and their supporting evidence. Database. 2010; 2010:baq023–3.
74. Ashburner M, Ball CA, Blake JA, Botstein D, Butler H, Cherry JM, Davis AP, Dolinski K, Dwight SS, Eppig JT, Harris MA, Hill DP, Issel-Tarver L, Kasarskis A, Lewis S, Matese JC, Richardson JE, Ringwald M, Rubin GM, Sherlock G, Consortium GO. Gene ontology: tool for the unification of biology. Nat Genet. 2000;25:25–9.
75. The Gene Ontology Consortium. Gene ontology consortium: going forward. Nucleic Acids Res. 2015;43:D1049–56.
76. Kanehisa M, Goto S. KEGG: Kyoto encyclopedia of genes and genomes. Nucleic Acids Res. 2000;28:27–30.
77. Mi H, Muruganujan A, Casagrande JT, Thomas PD. Large-scale gene function analysis with the PANTHER classification system. Nat Protoc. 2013;8:1551–66. 78. Ideker T, Krogan NJ. Differential network biology. Mol Syst Biol. 2012;8:565. 79. Yu G, Li F, Qin Y, Bo X, Wu Y, Wang S. GOSemSim: an R package for measuring
semantic similarity among GO terms and gene products. Bioinformatics. 2010;26:976–8.
80. Halekoh U, Højsgaard S. The R package geepack for generalized estimating equations. J Stat Softw. 2006.
81. Chen M-H, Yang Q. GWAF: an R package for genome-wide association analyses with family data. Bioinformatics. 2010;26:580–1.
82. Willer CJ, Li Y, Abecasis GR. METAL: fast and efficient meta-analysis of genomewide association scans. Bioinformatics. 2010;26:2190–1. 83. Li J, Ji L. Adjusting multiple testing in multilocus analyses using the
eigenvalues of a correlation matrix. Heredity (Edinb). 2005;95:221–7. 84. Liu JZ, McRae AF, Nyholt DR, Medland SE, Wray NR, Brown KM, AMFS
Investigators, Hayward NK, Montgomery GW, Visscher PM, Martin NG, Macgregor S. A versatile gene-based test for genome-wide association studies. Am J Hum Genet. 2010;87:139–45.
85. Babu H, Claasen J-H, Kannan S, Rünker AE, Palmer T, Kempermann G. A protocol for isolation and enriched monolayer cultivation of neural precursor cells from mouse dentate gyrus. Front Neurosci. 2011;5.
86. Gurok U, Steinhoff C, Lipkowitz B, Ropers H-H, Scharff C, Nuber UA. Gene expression changes in the course of neural progenitor cell differentiation. J Neurosci. 2004;24:5982–6002.
87. Castaño Z, Kypta RM. Housekeeping proteins: limitations as references during neuronal differentiation. Open Neurosci J. 2008;2.
• We accept pre-submission inquiries
• Our selector tool helps you to find the most relevant journal • We provide round the clock customer support
• Convenient online submission • Thorough peer review
• Inclusion in PubMed and all major indexing services • Maximum visibility for your research
Submit your manuscript at www.biomedcentral.com/submit