R E S E A R C H
Open Access
In vivo quantification of quantum dot
systemic transport in C57BL/6 hairless mice
following skin application post-ultraviolet
radiation
Samreen Jatana
1†, Brian C. Palmer
2†, Sarah J. Phelan
2, Robert Gelein
2and Lisa A. DeLouise
1,3*Abstract
Background:Previous work has demonstrated size, surface charge and skin barrier dependent penetration of nanoparticles into the viable layers of mouse skin. The goal of this work was to characterize the tissue distribution and mechanism of transport of nanoparticles beyond skin, with and without Ultraviolet Radiation (UVR) induced skin barrier disruption. Atomic absorption spectroscopy (AAS), flow cytometry and confocal microscopy were used to examine the effect of UVR dose (180 and 360 mJ/cm2UVB) on the skin penetration and systemic distribution of quantum dot (QD) nanoparticles topically applied at different time-points post UVR using a hairless C57BL/6 mouse model.
Results:Results indicate that QDs can penetrate mouse skin, regardless of UVR exposure, as evidenced by the increased cadmium in the local lymph nodes of all QD treated mice. The average % recovery for all treatment groups was 69.68% with ~66.84% of the applied dose recovered from the skin (both epicutaneous and intracutaneous). An average of 0.024% of the applied dose was recovered from the lymph nodes across various treatment groups. When QDs are applied 4 days post UV irradiation, at the peak of the skin barrier defect and LC migration to the local lymph node, there is an increased cellular presence of QD in the lymph node; however, AAS analysis of local lymph nodes display no difference in cadmium levels due to UVR treatment.
Conclusions:Our data suggests that Langerhans cells (LCs) can engulf QDs in skin, but transport to the lymph node may occur by both cellular (dendritic and macrophage) and non-cellular mechanisms. It is interesting that these specific nanoparticles were retained in skin similarly regardless of UVR barrier disruption, but the observed skin immune cell interaction with nanoparticles suggest a potential for immunomodulation, which we are currently examining in a murine model of skin allergy.
Keywords:Quantum dots, Atomic absorption spectroscopy, Distal organ analysis, Skin dendritic cells
Background
The commercial use of engineered nanomaterials is rap-idly expanding in the fields of targeted therapeutics, bio-medical diagnostics, cosmeceuticals and electronics [1]. Some nanoparticles (NP) used in commercial and research
applications include quantum dots (QD), carbon nano-tubes (CNT), fullerenes, metals (Au, Ag), metal oxides (TiO2, ZnO, SiO2) and lipophilic nanoparticles
(lipo-somes) [2–7]. The global market value for NP in bio-technology, drug development and delivery is expected to reach 53.5B US dollars by 2017 with personal care products containing NPs accounting for the largest share in the nanotechnology market today [8].
The unique physical, optical and tactile properties of NPs make them ideal for use in topical skin applications [8]. By far, the largest application is formulation in ultra-violet radiation (UVR) protective sunscreens and daily * Correspondence:[email protected]
†Equal contributors
1Department of Biomedical Engineering, University of Rochester, Rochester,
NY, USA
3Department of Dermatology, University of Rochester Medical Center,
Dermatology and Biomedical Engineering, 601 Elmwood Avenue, Box 697, Rochester, NY 14642, USA
Full list of author information is available at the end of the article
use skin care products that contain zinc oxide (ZnO) and/or titanium dioxide (TiO2) NPs. This has driven
considerable research to investigate the interaction of metal oxide NPs with skin using different animal and human models [9–12] however, little is understood about the interaction of NPs with UVR exposed skin [13]. UVR skin exposure has been shown to cause pro-duction of reactive oxygen species (ROS), formation of cyclobutane pyrimidine dimers (CPD) and release of cy-tokines that lead to time dependent epidermal damage, erythema and immunosuppression [14–18]. UVR expos-ure induces keratinocyte hyper-proliferation that leads to a thickened epidermis, a malformed stratum cor-neum and defective skin barrier that peaks 3 to 4 days post UVR as measured by transepidermal water loss (TEWL) [19]. Although both UVA and UVB skin ex-posure have been directly linked to sunburn, photoag-ing, and carcinogenesis, the consequence of frequent use of nano-enabled products on UVR induced barrier defective skin is not well characterized [20, 21]. It is an-ticipated that NP skin penetration would be more likely after UVR exposure, and thus it is important to study this from a toxicological perspective. If NPs penetrate through the stratum corneum into the viable epidermis they then have the potential to be transported to distal organs either by cellular uptake or through the lymph-atic circulation and blood stream [19, 22].
Studying NP skin penetration, local cellular environ-ment interaction, and transport to distal organs are major challenges in the nanotoxicology field due to diffi-culties in tracking and quantifying many types of nano-particles. Analytical techniques commonly used to track the absorption and distribution of NP in tissues include confocal microscopy and flow cytometry which rely on fluorescence detection. Hence, fluorescent semicon-ductor CdSe/ZnS core/shell (cadmium selenide core, zinc sulphide shell) quantum dot (QD) nanocrystals have been widely used as a model NP for nanotoxicology. Of note, there is primary interest in understanding QD skin interactions due to their increasing importance in the biomedical, electronics, optics and energy fields that present an increased risk for QD body exposure [23–25]. In addition to their size dependent optical properties, QDs are also advantageous in that their surface chemis-try can be modified to alter charge and render them sol-uble in aqueous application vehicles. Mass spectrometry and atomic absorption spectroscopy (AAS) are also used to detect elemental cadmium (Cd) in tissues providing indirect evidence for the presence of QD particles [19, 22, 26–28]. These techniques are more quantitative and have higher detection sensitivity than fluorescent microscopy, which suffers from high background signal in tissue specimens. Taking advantage of these attributes, Liu et al. used inductively coupled plasma mass
spectrometry (ICP-MS) to examine the in vivo breakdown of QDs (cadmium-telluride core) in mice by tracking the ratio of both metal ions systemically over time after a sin-gle intravenous injection [29]. This study reported evi-dence for some physiological breakdown of QDs into their component metal ions over a 28-day period with both cadmium and telluride ions mainly accumulating in the liver [29]. In another study, polyethylene glycol (PEG) coated QDs (CdSe core, CdS shell) were intradermally injected in mice to quantify the biodistribution in distal organs using ICP-MS. This study also found that over a period of 24 h the QDs accumulated in the draining lymph nodes and other major organs including the liver and kidney (kidney filtration size 5-6 nm) [30].
While intradermal and intravenous injections are the most common routes of QD delivery into animals only a few studies have attempted to track QD systemic distri-bution in mice following a topical application [19, 31]. Examination of the topical delivery route is important since consumers are more likely to apply nano-enabled cosmetics to their skin [9]. Gopee et al., found that poly-ethylene glycol coated QDs (37 nm hydrodynamic diam-eter) topically applied on intact skin of SKH-1 hairless mice were below the levels of detection in the sentinel organs analyzed using ICP-MS [31]. Elevated Cd levels were detected in dermabraded skin at 24 and 48 h post application [31]. In our previous study of QD penetra-tion through UVR (360 mJ/cm2 UVB) exposed skin using AAS we observed a statistically significant increase in liver Cd levels when the QDs were applied topically to the back skin on day 4 post irradiation at the peak of barrier defect [19]. Unexpectedly, Cd was detected in the lymph nodes of control animals (no UVR) in this previous study, but the mechanism of transport was un-clear [19] and we did not attempt to quantify QD pres-ence in other organs or at other time points post UVR exposure or to account for the total applied dose.
In the present study we used AAS to quantify the QD (CdSe core, ZnS shell) distribution via Cd concentration in skin (both penetrated and non-penetrated levels), pooled skin draining lymph nodes (axillary, brachial, and cervical), liver, spleen, intestine (small and large), and feces. The purpose of the study is twofold: 1) to quantitatively track QD penetration through skin to distal organs when topic-ally applied at different time points post-UV irradiation to establish trends with the development of the UVR induced skin barrier disruption, and 2) to examine the transport mechanisms of QDs to the lymph nodes after QD expos-ure on control or UV irradiated skin using flow cytometry.
Methods
Quantum Dot functionalization and measurement
and suspended in a toluene solvent, were purchased (#CZ600 NN-Labs, Fayetteville, Arkansas) and chem-ically modified in-house to make the QDs negatively charged and water-soluble. Hydrophilic ligand coating was added on the QD surface to enable physiological use in an in vivo model. We and others have shown that lig-and composition lig-and surface charge can affect QD cell uptake, cytosolic trafficking and cytotoxicity. For this study we chose glutathione (GSH), which is a superior coating based our studies of colloidal stability, quantum yield and minimal keratinocyte cytotoxicity [26].
To functionalize the QDs with GSH (Calbiochem, CAS 70-18-8), 300μl of the QD stock solution (10 mg/ ml) was added to 1700 μl of a 1:1 methanol: acetone mixture and centrifuged at 14,000 RPM for 5 min. The supernatant was removed and the QD pellet was dried via nitrogen flow. The QD pellet was suspended in 300μl of dried tetrahydrofuran immediately after drying. In a separate glass vial, 30 mg GSH was dissolved in 1 mL of methanol and the pH was adjusted to 11 by adding tetramethylammonium hydroxide (Sigma-Al-drich, #T7505). The GSH mixture was stirred under constant heat at 60o C, and slowly the QD suspension was added drop wise. The mixture was stirred at a con-stant 60o C for an additional 2 h then the heat was re-moved and the mixture was stirred overnight. The following day, the mixture was transferred evenly to two centrifuge tubes filled with 1.5 mL each of diethyl ether. Once vortexed, the ether and QD mixture was centrifuged at 14,000 RPM for 5 min. The supernatant was removed and the pellet was dried under nitrogen flow. The two QD pellets were dissolved in 100 μl of 0.1 N NaOH, demonstrating the water solubility of the newly coated particles, and transferred to a dialysis tube for removal of unbound GSH (5-kD cut-off DispoDialyzer filter, Harvard Apparatus Inc., Holliston, Massachusetts). The dialysis tube was placed in a light protected 50 mL vial filled with DI water (pH = 6.7); and then placed on a plate rocker for 2 days at 4 ° C, with the DI water replaced once after the first 24 h of incubation.
To determine the concentration of the functionalized QD mixture we placed 2μl of undiluted sample onto a NanoDrop spectrophotometer and measured the peak absorbance at 585 nm. Beer-Lambert’s law was used to calculate the concentration of the QDs [26]. The aver-age hydrodynamic diameter (57.92 nm), zeta potential (-57.1 mV) and polydispersity (0.459) were measured using the Malvern Zetasizer Nano ZN in deionized water (Malvern Instruments Ltd., Worcestershire, United Kingdom) at pH = 6.5.
Animal treatments: UVR dosing protocol
Animal experiments were approved by the University Committee on Animal Resources (UCAR) at the
University of Rochester Medical Center (#100360/2010-024). All mice used in this study are hairless SKH-1 mice backcrossed 7 generations into a C57BL/6 mouse back-ground. The SKH-1 mouse contains a mutation in the
hairless (Hr) gene that causes alopecia to develop after the first hair follicle cycle. This phenotype is preferred for UVR exposures, since the use of other breeds neces-sitates hair removal, which may cause a barrier defect in the epidermis. Also C57BL/6 hairless mice retain their hair follicles, which is a possible route for NP accumula-tion and penetraaccumula-tion through skin. Mice were either male or female with ages that range from 5 to 8 months old. The mice were housed in standard cages, up to four mice per cage, with access to food and water ad libitum. However, after UVR and QD exposure, the mice were housed individually to prevent interactions that could alter the skin barrier and QD penetration.
Ultraviolet light has three distinct wavelength ranges: UVA (400-315 nm) is the long wave form, UVB (315-280 nm) is the medium wave form that can be most damaging, and UVC (280-100 nm) is the shortest wave form that is absorbed by the ozone layer. To expose the mice, we used a UVA Sun 340 lamp that emits in both the UVA and UVB wavelengths closely resembling the damaging portion of the UVR spectrum produced by the sun (300-400 nm) [32]. The 180 mJ/cm2 and 360 mJ/cm2dose was tuned to the UVB range by using a calibrated IL1700 light meter (International Light) with a SED 240 probe, and the exposure time was cal-culated using the measured flux value (J/cm2-sec). An equivalent exposure to UVB of 180 mJ/cm2 would be approximately achieved by exposure to the sun at noon in mid-July in Rochester, NY for approximately 11 min. To expose the mice to UVR, they were housed separ-ately, without bedding, in open top cages 15 in. away from the lamp [22].
To examine the effect of UVR on Langerhans cell (LC) density, mice were irradiated using a dose calibrated on UVB and then euthanized at the following time points: 0 h, 1, 4, 7, 9 and 14 days after irradiation. Skin was har-vested from the back (5 cm2area) using a stainless steel surgical blade (Miltex, Inc.) and stored at -80 °C for im-munofluorescence (IF) analysis.
Quantum Dot application and AAS protocol
common commercial skin lotion widely used and mimics the skin application of a sunscreen [33]. The QD lotion mixture was applied to the back of each mouse with a PDMS (polydimethylsiloxane, 1.5 cm2 in area) applicator. The PDMS was made by mixing 25 mL PDMS elastomer base and 2.5 g of elastomer curing agent, and then pouring the mixture into a mold and curing overnight. The PDMS application strip and the pipette used to aliquot the QDs were both analyzed by AAS to determine QD loss via the application method.
The experimental set-up mimics the application of sunscreens containing nanoparticles after UV irradiation in humans, so rather than using a non-occlusive dress-ing, the mice were fitted with an Elizabethan collar (Braintree Scientific, Massachusetts) and housed in bed-ding free cages for the duration of QD exposure to limit QDs lost to ingestion by grooming. The mice were held by their tails and a fresh PDMS strip was used to gently apply the QD lotion mixture on their back. The QDs were applied to the dorsal side of the mouse from head to tail, and the QD mixture was rubbed gently to distrib-ute evenly on the skin to cover a surface area of ~10 cm2. The pipette tip and the PDMS applicator were collected for AAS analysis. The following day, 24 h after QD application, the mice were sacrificed by CO2
-asphyxiation and cervical dislocation. Care was taken not to disturb the back of the mouse where a large pro-portion of QDs remained. After euthanasia, QDs on the skin surface were gently wiped off using gauze soaked in 1X phosphate buffered saline (PBS) and this was ana-lyzed by AAS to quantify the residual QD skin concen-tration (epicutaneous).
The procedure for removal of the mouse organs and preparation for graphite furnace AAS has been previ-ously described [19]. The organs were harvested using
dedicated dissection instruments to avoid contamination between treatment groups. The tissues and other sam-ples were directly placed in pre-weighed 50 ml tubes and the sample weights were recorded before ashing with nitric acid (Baseline, SeaStar Chemicals Inc.). Full thickness skin (epidermis and dermis) was harvested from the mouse dorsum (neck to tail) using dissection scissors and a scalpel. Cadmium levels were quantified in each sample by comparison to reference standards. The limit of detection (LOD = 0.004 ng/ml) and the limit of quantification (LOQ = 0.013 ng/ml) were established as previously described [19]. In this study, the gauze (epicutaneous), skin (penetrated skin dose in the epider-mis and derepider-mis-intracutaneous), lymph nodes (axillary, brachial and cervical), liver, intestines (duodenum to the last fecal pellet of the large intestine), excreted feces, spleen and PDMS applicators were analyzed using AAS. The lymph nodes were pooled for analysis. A prelimin-ary analysis showed that the Cd levels were below LOD when lymph nodes were analyzed individually. Critical parameters to control in NP topical skin exposure stud-ies are the area of application and minimizing grooming to prevent ingestion of the NP for the duration of the exposure. In this work extreme care was taken to pre-vent grooming by placing collars on the mice. Nonethe-less, we specifically analyzed the feces for elemental Cd in the UVR treated mice (collared) and compared it to both mice treated with oral gavage and mice treated top-ically with no collar. Here, we limited the topical appli-cation of the QDs to a small area between the scapulae of the mice where they are less able to groom. This is thought to reduce the risk of oral ingestion through grooming with and without use of the collar.
To prove this we performed an oral gavage as a con-trol where mice were dosed with 50 uL of 2.5x10⁻¹¹mol of QDs (50% of the topical dose) and samples were taken
Day 4 Day 7
Day 1 Day 5 Day 8
Sacrifice mice 24 hours after
exposure
Sacrifice mice 24 hours after
exposure
Sacrifice mice 24 hours after
exposure Expose Mice to
UVR Dose
Day 0
Apply QDs immediately post UVR exposure
Apply QDs 4 days post UVR exposure
Apply QDs 7 days post UVR exposure
Note: CONTRO LMice-NO UVR, NO QD
24 h later (N= 4). We were concerned about acute Cd toxicity in the oral gavage study so we lowered the dose compared to the topical exposures. A significantly higher amount of Cd was detected in the feces of mice with the oral gavage treatment compared to UVR treated mice which was expected since ingestion was the only expos-ure route (Additional file 1: Figexpos-ure S1). Mice (collared and uncollared) were treated to an equivalent topical dose for 24 h. Interestingly, the Cd levels detected in the feces of mice with no collar were significantly higher than those of the collared UVR treated mice (p< 0.05) and they were as high as the oral gavage mice that re-ceived half the dose applied to skin indicating the need to use collars to prevent QD ingestion from grooming. Langerhans cell migration kinetics: Immunofluorescence and confocal imaging.
For immunofluorescence, the skin was removed from the -80 °C storage and allowed to thaw at room temperature. For each experimental set-up, skin samples of about ~1 cm2were cut and surgical blade was used to remove the subcutaneous fat and thin the dermal layer leaving the epidermis intact. The samples were then stained for LCs (anti-langerin CD207 conjugated with Alexa 488, eBioscience, Cat No: 53-2073-82). The skin sample was placed in methanol at -20 °C for 15 min for fixing and then blocked at room temperature using 2% bo-vine serum albumin (BSA, HyClone, Cat No-SH30574.01) in phosphate buffered saline (1X PBS). Next, 2 μl Fc block (anti-mouse CD16/CD32, eBioscience, Cat No-14-0161-82) was added to 100 μl 2% BSA solution and the skin was immersed in it for 40 min at 4 °C to block all the non-specific Fc gamma III and gamma II recep-tors. Next, 2 μl CD207 anti-langerin antibody was mixed in 50 μl 2% BSA solution. Skin was immersed in the solution containing CD207 antibody overnight at 4 °C. After the overnight incubation, skin was washed thoroughly (x2) in distilled water and the stained sam-ples were placed in a glass bottom microwell dishes (MatTek Corporation) with the epidermis facing down. The samples were coated with Mowiol (embedding medium, Sigma Aldrich #81381) and flattened using a cover slip for confocal imaging using the FV1000 Olympus Laser Scanning Confocal Microscope. The number densities of the positively stained LCs in the images captured on the microscope were quantified using image J software (NIH version 1.45).
Sample preparation for flow cytometric analysis
The UVR irradiation and QD exposure protocols were similar to that described under the AAS section. Lymph nodes were extracted from mice in each treatment group and placed on ice. The lymph nodes were divided into 3 groups: axillary, brachial and cervical. RPMI media (Sigma-Aldrich) with 1 M HEPES and 12.5 ml fetal
bovine serum (FBS) was used for processing. Lymph node digestion was performed in 1 mg/ml of collagenase type II (125 U/ml Gibco, Cat No: 17101-015) and 50μl of total DNase (30 mg/ml, Roche, Cat No: 10-104-159001) added to 50 ml RPMI. The lymph nodes were crushed using frosted slides into a petri dish containing the RPMI media. The slides and petri dish were washed with additional 5 ml of media and transferred to 15 ml tubes. The tubes were incubated at 37 °C for 25 min with occasional agitation. After the incubation period, the digestion was quenched using 5 ml RPMI media and the cells were spun down on a centrifuge (1600 rpm) and 5 ml red blood cell lysis buffer was added to each tube (Eppendorf, Centrifuge 5417C). The cells were in-cubated on ice for 5 min with occasional agitation. The digestion was quenched using 5 ml RPMI media, the cells were spun down (1600 rpm) and filtered to remove tissue debris. The cell count was determined using trypan blue and automatic cell counter (Bio-Rad). Cells (2 × 10⁶ per sample) were transferred into 1.5 ml Eppendorf tubes for antibody cell staining. After incubating in Fc blocking buffer, the cells were washed and re-suspended in 100μl cell staining buffer containing the following antibodies: CD207 (Alexa Fluor 488, eBioscience, Cat No: 53-2073-82), MHCII (eFluor 450, eBioscience, Cat No: 48-5321-82), CD19 (PE, eBioscience, Cat No: 12-0193-48-5321-82), CD11b (PE-Cy5, eBioscience, Cat No: 15-0112-82) and F4/80 (PE-Cy7, eBioscience, Cat No: 25-4801-82). Compensation controls (including an unstained sample) and fluorescence minus one (FMO) controls were added for each antibody including QD605. The antibodies were used in the follow-ing concentrations (per 100 μl of the buffer): CD207 (2μl), MHCII (2μl), CD19 (0.6μl), CD11b (1μl), F4/80 (2 μl) and QD605 (2μl). QD605 was added only to the compensation and FMO controls. The cells were treated with Fc block (anti-mouse CD16/CD32, eBioscience, Cat No-14-0161-82) for 15 min at 4 °C to prevent nonspecific antibody binding. Next, the specific antibodies were added to each sample and the tubes were incubated on a rocker at 4 °C for 20 min. The samples were washed using the cell staining buffer and spun down. The supernatant was removed and the cells were fixed using 2% paraformalde-hyde (Boston BioProducts, Cat No: BM-155) at 4 °C for 15 min. The cells were washed, spun down and re-suspended in 300 μl phosphate buffered saline (1X PBS) for flow cytometry. Data were collected using 18-color LSRII flow cytometer (BD Biosciences) at the flow rate of 35μl/min.
Data and statistical analyses
treatment group were used for the LC migration studies and flow cytometry analysis (N= 3-4). For flow data ana-lysis, results from 3 to 4 experiments with approximately a million cells per treatment group were concatenated. All AAS data is presented as either percent Cd recov-ered (Tissue Cd concentration/Sham Cd concentration) or as Cd (ng) per total tissue weight (g). All statistical analyses were run with JMP Pro v 12.1.0 (SAS Institute Inc., Cary, NC). A Kruskal-Wallis test and subsequent post-hoc Mann-Whitney analysis was performed when appropriate data with p-values <0.05 were considered significant. The confocal microscopy and flow cytome-try data are presented as total cells per skin area and total cells per sample, respectively. Appropriate com-pensation using standard beads (BD Comcom-pensation Beads #552843) and fluorescence minus one (FMO) controls were added to each panel for measurement on the 18-color LSR flow cytometer. Data was analyzed using FlowJo (8.8.7). The gating strategy has been shown in Additional file 1: Figure S2. The statistical tests used for each experiment are mentioned under each figure legend in detail.
Results
Cadmium (Cd) tissue distribution analysis by atomic absorption spectroscopy (AAS)
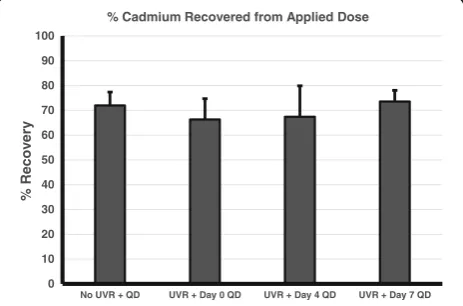
Studies were performed to investigate whether the UVR induced inside-out barrier defect as measured by Trans-epidermal Water Loss (TEWL), correlates with the outside-in penetration of QDs. In prior work, we exam-ined the TEWL values post UVR (90, 180, 270 and 360 mJ/cm2 UVB) irradiation from day 0 to day 7 and found that TEWL values peaked days 3–4 in UVR treated mice compared to control [19]. In this study, we treated mice with QDs for 24 h topically applied either on day 0, 4 or 7 post-UVR irradiation (180 mJ/cm2UVB light); day 4 being the peak of barrier defect post UV ir-radiation. This UVB dose was selected as it induces a significant barrier defect without causing obvious skin erythema [19]. We also included a control group that remained untreated (no QD and no UVR) and a group that was treated only with the QD (no UVR). The mice were euthanized 24 h post-treatment, and the Cd con-centration in the skin (epicutaneous and intracutane-ous), lymph nodes, intestine, liver, spleen and feces were analyzed by AAS. The maximum Cd dose was 13.74 ± 1.28 μg Cd, measured by AAS analysis of the PDMS applicators loaded with the QD lotion mixture. Accounting for residual QDs left on the PDMS applica-tors after treating each mouse, the total Cd mouse exposure was 10.96 ± 1.21 μg Cd. The levels of Cd (μg) in all mouse tissues were summed for each treatment group and averaged, which equaled 7.63 ± 1.77 μg Cd. Therefore, the average percent recovered for all QD
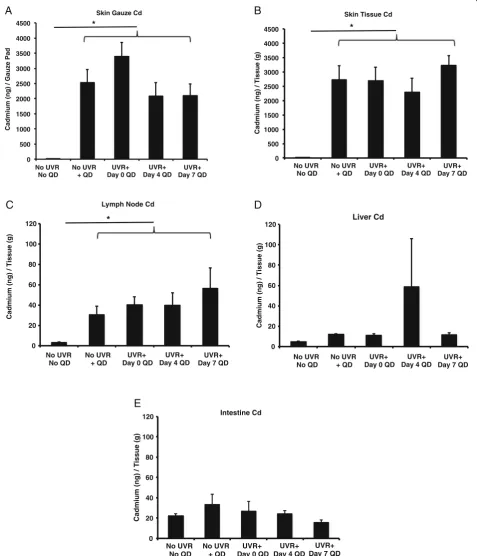
treatments was 69.68% (Fig. 2). Some Cd could be lost in tissues not analyzed or to accidental transfer to the Elizabethan collar or cage; however, a percent recovery of ~70% of the total Cd applied is exceptional for whole animal distribution analyses and consistent with previ-ous reports [30]. It is noteworthy that the majority of the recovered Cd was from the skin (66.84% of applied dose); both from the epicutaneous (dose wiped off with gauze, skin gauze Cd, Fig. 3a) and the intracutaneous dose remaining in skin (skin tissue Cd, Fig. 3b). The skin tissue Cd (intracutaneous) represents those QDs that have either traversed into or beyond the stratum corneum into the epidermis and dermis or trapped in hair follicles and/or skin furrows. The data indicates that QDs are retained in skin independent of time post UV exposure, since all QD treatments contain signifi-cantly more Cd in the skin compared to no treatment control (p< 0.05), and there are no significant differ-ences between the UVR exposure groups (Fig. 3b). Interestingly, the No UVR + QD group had similar levels of Cd compared to the UVR treated groups.
This differs from previous work that reported NP penetration through skin occurs in a barrier defect dependent manner [34–37]. TEWL values are highest on day 4 post-UVR exposure corresponding to barrier im-pairment; however, our AAS results are unable to detect differences in QD penetration (Cd levels) between days 0, day 4 or day 7 post-UVR treated skin. It is plausible the vehicle (Eucerin® lotion) used for the study facilitated QD collection in the stratum corneum, skin folds and
0 10 20 30 40 50 60 70 80 90 100
No UVR + QD UVR + Day 0 QD UVR + Day 4 QD UVR + Day 7 QD
%
Recov
e
ry
% Cadmium Recovered from Applied Dose
0 500 1000 1500 2000 2500 3000 3500 4000 4500
No UVR + No QD
No UVR + QD
UVR + Day 0 QD
UVR + Day 4 QD
UVR + Day 7 QD Cadmium (ng) / Gauze P ad
Skin Gauze Cd
A
No UVR No QD No UVR + QD UVR+ Day 0 QDUVR+ Day 4 QD
UVR+ Day 7 QD
* 0 500 1000 1500 2000 2500 3000 3500 4000 4500
No UVR + No QD
No UVR + QD UVR + Day 0 QD
UVR + Day 4 QD
UVR + Day QD Cadmium (ng) / T issue (g)
Skin Tissue Cd
B
No UVR No QD No UVR + QD UVR+ Day 0 QDUVR+ Day 4 QD
UVR+ Day 7 QD
* 0 20 40 60 80 100 120
No UVR + No QD
No UVR + QD UVR + Day 0 QD
UVR + Day 4 QD
UVR + Day 7 QD Ca d mium (n g )/T iss u e( g )
Lymph Node Cd
C
No UVR No QD No UVR + QD UVR+ Day 0 QDUVR+ Day 4 QD
UVR+ Day 7 QD
* 0 20 40 60 80 100 120
No UVR + No QD
No UVR + QD UVR + Day 0 QD
UVR + Day 4 QD
UVR + Day 7 QD Cadmium (ng) / T issue (g) Liver Cd
D
No UVR No QD No UVR + QD UVR+ Day 0 QDUVR+ Day 4 QD
UVR+ Day 7 QD
0 20 40 60 80 100 120
o UVR + No QD
No UVR + QD
UVR + Day 0 QD
UVR + Day 4 QD
UVR + Day 7 QD Cadmi um (ng) / T iss u e (g) Intestine Cd No UVR No QD No UVR + QD UVR+ Day 0 QD
UVR+ Day 4 QD
UVR+ Day 7 QD
E
follicles creating a significant background signal that masked the effects of UVB exposure and time. Future studies can be designed to employ tape stripping as a means to differentiate QDs trapped in the stratum cor-neum from those in deeper skin layers and follicles.
The levels of Cd detected in the lymph nodes, liver, in-testine/feces made up a small percentage of the total ap-plied dose, 0.024, 0.41, and 2.51% respectively. However, analysis of the lymph nodes (axillary, brachial, cervical and inguinal) and liver suggest that some QDs are able to enter into systemic circulation. The level of Cd in the lymph nodes was higher in all treatments, compared to the no QD treatment control and there were no signifi-cant differences between the UVR treatments (Fig. 3c). There also were no significant differences observed in the Cd values obtained for the liver compared to no treatment control (Fig. 3d). The main excretory
pathway for QDs is biliary through the liver and intes-tine, since they are too large to be significantly excreted by the kidneys [38]. There was no significant increase in Cd in the intestine compared to control (Fig. 3e), most likely due to the limited 24 h time frame of the experiment. The small variation in Cd levels in the liver and the intestine may be accounted for by possible dif-ferences in dietary Cd intake [39]. Cd levels detected in the spleen were low and no significant differences were detected between the treatment groups and the control (Additional file 1: Figure S3).
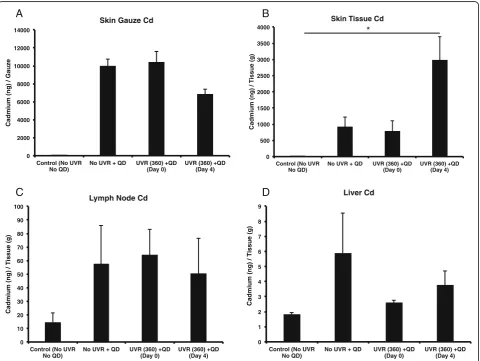
Mice were also irradiated using a dose of 360 mJ/cm2 and the QDs were applied day 0 and day 4 post-irradiation. Results (Fig. 4) were similar to the 180 mJ/ cm2 study with the notable exception of a significantly higher level of Cd detected in the skin tissue (intracuta-neous) over the control for the day 4 treatment group
0 2000 4000 6000 8000 10000 12000 14000
Control (No UVR No QD)
No UVR + QD UVR (360) +QD (Day 0)
UVR (360) +QD (Day 4)
Cad
m
ium
(n
g
)
/
Gauze
Skin Gauze Cd
A
0 500 1000 1500 2000 2500 3000 3500 4000
Control (No UVR No QD)
No UVR + QD UVR (360) +QD (Day 0)
UVR (360) +QD (Day 4)
Ca
dm
ium
(n
g)
/
T
is
s
u
e(
g
)
Skin Tissue Cd
B
*
0 10 20 30 40 50 60 70 80 90 100
Control (No UVR No QD)
No UVR + QD UVR (360) +QD (Day 0)
UVR (360) +QD (Day 4)
C
ad
miu
m
(n
g)
/
T
iss
u
e
(g)
Lymph Node Cd
C
0 1 2 3 4 5 6 7 8 9
Control (No UVR No QD)
No UVR + QD UVR (360) +QD (Day 0)
UVR (360) +QD (Day 4)
Ca
d
mium
(ng
)
/
T
iss
u
e(
g
)
Liver Cd
D
which suggests QDs accumulation in skin depends on the magnitude of the barrier defect as measured by TEWL.
Since Cd was detected in the lymph nodes, we next examined the transport mechanism. Transport of QDs could possibly occur via skin dendritic cells or non-cellular via the blood stream and lymphatics. The pres-ence of LCs in the skin is dependent on UVR exposure and LCs are known to survey the skin for foreign bodies including NP, so we examined the role of LCs and other immune cells in this process.
Langerhans cell (LC) migration kinetics
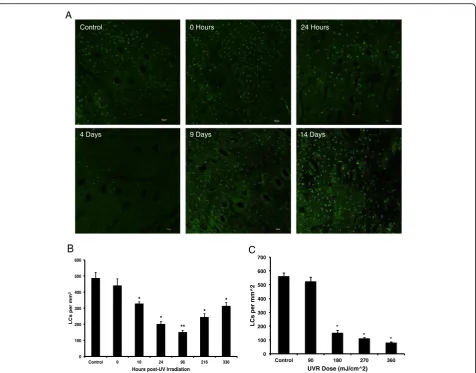
LCs are UVR sensitive dendritic cells present in the epi-dermis. They play an important role in developing im-mune tolerance to UVR, a phenomenon known as UVR induced immunosuppression, which protects against the development of sun allergies [40–43]. Studies show that following UVR exposure LCs migrate to the local skin draining lymph nodes with dead skin cell debris and present the self-antigen to naïve T cells [44]. This leads to the generation of UVR-induced regulatory cells T cells [45, 46]. Here, we examined the role of skin LCs in the transport of QDs to the lymph nodes. First, we mapped the kinetics of LC migration from the skin post-UVR ir-radiation by quantifying LC presence in back skin. Skin was obtained from mice at different time-points post-UVR treatments and stained for LCs using anti-langerin Alexa 488 (Fig. 5a). We observed a decrease in the LC population in the skin epidermis following UVR expos-ure of 180 mJ/cm2, with a significant decrease starting at 10 h post-irradiation (Fig. 5b), p< 0.05. The LC count was the lowest on day 4 post-irradiation (~70% reduc-tion compared to control, p< 0.0001), and the LCs start repopulating the skin on day 9 (Fig. 5b). Results also show that the % reduction of LCs in the skin 4 days post UVR depends on the UVB dose (Fig. 5c). It is of interest to note that when the LC density in skin is the lowest (day 4 post-UVR), the skin barrier defect is the highest as measured by TEWL [19]. Hence, this suggests that if QDs are taken up LCs in skin and cellular transport is an important mechanism, there should be a dependence of QD presence in the lymph node on the time post-UVR exposure that the QDs are applied to skin. To examine if immune cells in the skin are important in QD LN transport we analyzed tissue histology sections and conducted flow cytometry.
Immunofluorescence and flow cytometry analysis
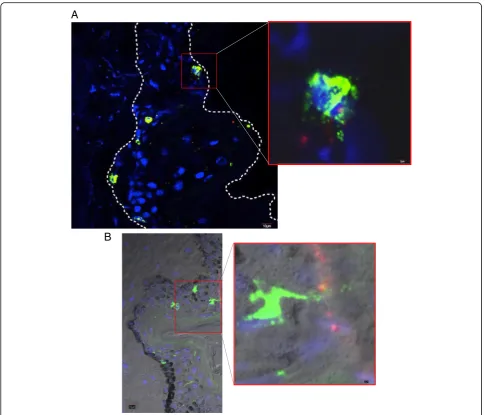
QDs were topically applied on the backs of mice and skin sections were analyzed for QD co-localization with LCs in the epidermis using confocal laser-scanning mi-croscopy. We observed possible uptake of QDs by LCs in some regions of the epidermis near the stratum
corneum (Fig. 6, Additional file 2: Video File S4). To de-velop the flow cytometry protocol we first injected QDs into the dorsal flank of the mice. Imaging data was obtained from this positive control (QDs intradermal injection). Results showed a high co-localization of QDs with LCs in the skin (Pearson’s coefficient = 0.77) (Additional file 1: Figure S5). Cryo-sections also revealed a high presence of QDs in the lymph nodes (Additional file 1: Figure S5). It is important to note that flow cytometry reports events positive for QD605 only when a QD is associated with a cell. It does not quantify nonfluorescent, degraded QDs or non-cellular associated free QDs.
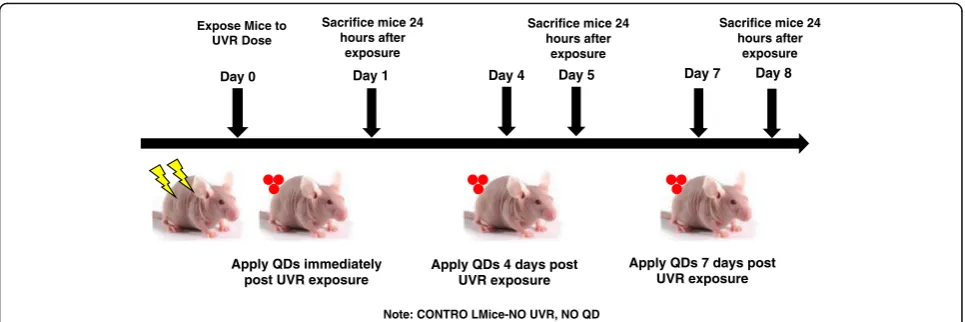
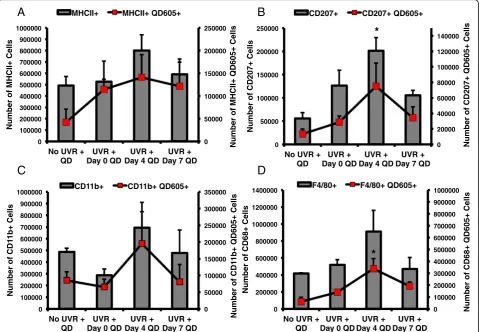
Flow cytometry was used to quantify different immune cell populations that could facilitate QD transport from skin to the draining lymph nodes following a topical ap-plication using the experimental protocol described above (Fig. 1). The cell populations analyzed included MHCII (Major Histocompatibility Complex II), which is present on antigen-presenting dendritic cells; CD207 (anti-langerin) for LCs; F4/80, for mouse macrophages and CD11b (broad leukocyte marker), which is primarily expressed on granulocytes, monocytes/macrophages, dendritic cells, NK cells, and subsets of T and B cells. Results showed an overall increase for QD605+ events in the lymph nodes when applied on day 4 post-UVR and similar trends were present in all of the individual cell populations that were analyzed (Fig. 7, red squares). The number of MHCII+, CD207+ and Cd11b + events (Fig. 7a, b and c) were high in the lymph nodes on day 4, which is expected because dendritic cells migrate out of the skin post UVR exposure as described earlier (Fig. 5). The CD207+ events on day 4 (Fig. 7b) were sig-nificantly higher compared to control (p< 0.05), which is consistent with their migration from the skin to the draining lymph nodes post UV irradiation. We expected to measure fewer CD207 + QD605+ events on day 4, since most LCs (~70%) have migrated out of the skin at the time of QD skin application; therefore, fewer LCs would be present in skin to uptake QDs and transport them to the draining lymph nodes. Our results indi-cate however, that the CD207 + QD605+ cell numbers positively correlate with the increased TEWL barrier de-fect. Together this data suggests that non-cellular trans-port of QDs occurs via the lymphatics or the blood stream with subsequent QD dendritic cell association occurring in the lymph nodes.
contribute to the UVR induced immunosuppressive microenvironment [49]. While it is likely that QDs can associate with macrophages in the lymph node, it is plausible that in our model macrophages that invade the skin post UVR exposure could also uptake the QDs and then transport them to the lymph nodes.
Discussion
The skin is an important exposure route to engineered nanomaterials, principally from topical application of nano-enabled cosmeceuticals and UVR protective lo-tions [9]. In a previous study, we had reported an in-creased presence of QD in the skin using tissue histology and Transmission Electron Microscopy (TEM) following a 360 mJ/cm2 UV exposure in hairless mice [19]. However, we had not established outside-in NP
penetration trends in correlation to the TEWL values that were measured in UV exposed mice [19]. UV skin exposure leads to the production of photoproducts, and DNA damage that ultimately cause apoptosis and sun-burn (erythema) [50]. The high TEWL measured due to UVR induced inside-out water loss has been attributed to the loss of epidermal calcium gradient, disorganized lipids in the stratum corneum and altered immune re-sponses in the skin [51–53]. It is expected that an in-crease in the barrier defect would lead to greater penetration of topically applied NP through skin and their subsequent interaction with the local immune en-vironment. Contrary to what is expected, using AAS elemental tissue analysis we find similar levels of QD presence in in both intact and 180 mJ/cm2UVR treated skin (Fig. 3b). Since our study did not differentiate QD
Control
14 Days 9 Days
0 Hours
4 Days
24 Hours A
*
* **
* *
0 100 200 300 400 500 600
Control 0 10 24 96 216 336
LC
sp
e
r
m
m
2
Hours post-UV Irradiation
* *
*
0 100 200 300 400 500 600 700
Control 90 180 270 360
LCs
p
er
mm^2
UVR Dose (mJ/cm^2)
B
Clocalization in the stratum corneum from viable epider-mal and derepider-mal tissues this result suggests that QD re-tention in skin (that which could not be wiped off ) is independent of the evolving barrier defect post UVR when the mice are treated with a 180 mJ/cm2dose. En-hanced NP penetration through barrier-damaged skin has been reported by many groups [19, 22, 54–56]. When the mice were irradiated with a 360 mJ/cm2dose, there was a significant increase in Cd levels in the skin tissue day 4 post-irradiation compared to control. This outcome is consistent with our previous result where we observed a greater QD presence in the skin post-UVR (360 mJ/cm2) using TEM and histology and likely results
from the increased barrier defect due to an erythema-tous UVR dose [19]. Retention of QD in control skin (no UVR) likely results possibly from collection in de-fects in the stratum corneum layers, hair follicles or skin furrows which do not change significantly with 180 mJ/ cm2UVR. Interestingly, we also observed no change in the level of Cd in draining skin lymph nodes due to dif-ferences in QD application time after UVR exposure. While the percent of Cd retained in the lymph nodes was low (0.024% of applied dose) compared to the total Cd dose, this suggests there was no difference in the ability of these specific QDs to penetrate skin after 180 mJ/cm2 UVR exposure. While the quantity of QDs
A
B
to penetrate skin is low, more studies should be per-formed to characterize the penetration of nanoparticles through skin in both chronic exposure and multiple ap-plication experiments, since biomedical and cosmetic nanoparticles are normally applied often and used for extended periods of time. Although rodent skin is thin-ner and more permeable than human skin, such studies are useful and relevant for risk assessment calculations and defining worst case scenarios.
Beyond skin penetration, the potential of nanoparticles to interact with immune cells in the skin is of interest not only for potential toxicological concerns due to in-advertent nanoparticle skin exposure, but also for the design of nanoparticle based drug delivery systems. Flow cytometry and AAS lymph node data suggests that the QDs may be transported by two mechanisms; one through the lymphatics or the blood stream, and the other involving cell (dendritic cell and/or macrophage)
mediated transport. The trends for MHCII+ and CD207 + dendritic cells (DCs) in the lymph nodes (Fig. 7) align with migration of these populations out of the skin due to the well-studied phenomenon of UVR-induced im-munosuppression and the increased skin barrier effect on Day 4 post UVR exposure [40]. AAS data did not show a peak in Cd levels in the lymph node on Day 4 post UVR (Fig. 3c) suggesting the presence of non-cell associated QD transport. At this point it is unclear whether cell-associated QDs in the lymph node were transported from the skin by dendritic cells or that QD uptake occurred in the lymph nodes (Fig. 7). However, while UVR exposure doesn’t seem to induce increased QD skin penetration at a dose of 180 mJ/cm2, there is an increased immune cell and QD co-localization in the lymph nodes. Therefore, the effect of nanoparticles on skin immune modulation with and without UVR expos-ure should be explored further.
0 50000 100000 150000 200000 250000 0 100000 200000 300000 400000 500000 600000 700000 800000 900000 1000000
No UVR + QD
UVR + Day 0 QD
UVR + Day 4 QD
UVR + Day 7 QD
Nu mb er of M H CII + QD605+ Cells Nu mb er of MHCI I+ C e ll s
MHCII+ MHCII+ QD605+
0 50000 100000 150000 200000 250000 300000 350000 0 100000 200000 300000 400000 500000 600000 700000 800000 900000 1000000
No UVR + QD
UVR + Day 0 QD
UVR + Day 4 QD
UVR + Day 7 QD
Nu m be ro f C D1 1 b + Q D605+ C ell s N umber o f C D1 1 b+ Cells
CD11b+ CD11b+ QD605+
A
B
C
D
0 20000 40000 60000 80000 100000 120000 140000 0 50000 100000 150000 200000 250000No UVR + QD
UVR + Day 0 QD
UVR + Day 4 QD
UVR + Day 7 QD
Number of CD207+ QD605+ Cells N um b e r of CD 2 0 7+ C e ll s
CD207+ CD207+ QD605+
*
0 100000 200000 300000 400000 500000 600000 700000 800000 900000 1000000 0 200000 400000 600000 800000 1000000 1200000 1400000No UVR + QD
UVR + Day 0 QD
UVR + Day 4 QD
UVR + Day 7 QD
Nu mb er o fC D 6 8 + QD 6 0 5+ Cells Nu m be r o f CD 6 8 + C e lls
F4/80+ F4/80+ QD605+
*
Conclusion
In conclusion, we have identified that QDs accumulate in skin regardless of skin barrier status at the 180 mJ/ cm2 dose, and these QDs can transport to the lymph nodes. However, the 360 mJ/cm2dose leads to overt bar-rier dysfunction resulting in higher QD retention in the skin. Based on confocal images and flow cytometry data, we can also conclude that antigen-presenting cells inter-act with and take up QDs; however, the transport from the skin to the draining lymph node likely includes both active (cell uptake) and passive (blood or lymphatics) transport. Due to the interaction with immune cells, on-going studies are examining the immunomodulatory ef-fect of topically applied nanoparticles both in the skin and systemically. In the future, we also plan to examine the differences between single nanoparticle applications and doses split over multiple days or weeks to examine the differences in skin penetration and retention of NP, since most cosmeceuticals containing nanoparticles are applied daily and multiple times per day.
Additional files
Additional file 1: Figure S1.Quantification of Cadmium (Cd) in the feces.Figure S2. Gating Strategy used to analyze flow cytometry data. Figure S3. Atomic Absorption Spectroscopy (AAS) analysis data from spleen (180 mJ/cm2UVR dose).Figure S5. Intradermal injection of QDs was used as a positive control to develop the flow cytometry protocol. (DOCX 8297 kb)
Additional file 2: Video File S4.Z-stacks acquired using confocal microscopy. (MOV 506 kb)
Abbreviations
AAS:Atomic absorption spectroscopy; Cd: Cadmium; CNT: Carbon nanotubes; CPD: Cyclobutane pyrimidine dimers; GSH: Glutathione; ICP-MS: Inductively coupled plasma mass spectrometry; LC: Langerhans cells; NP: Nanoparticle; PEG: Polyethylene glycol; QD: Quantum dot; ROS: Reactive oxygen species; TEWL: Transepidermal water loss; UVB: Ultraviolet Radiation B; UVR: Ultraviolet Radiation
Acknowledgements
We thank Dr. Linda Callahan and Paivi Jordan at the URMC Confocal Imaging Core for their support and Dr. Alice Pentland for helpful discussions.
Funding
This work was funded by the National Institutes of Health (NIH RO1 1R01ES021492).
Availability of data and materials
All relevant raw data and materials are freely available to any scientist wishing to use them.
Authors’contributions
SJ, BCP and LAD designed the experiments, analyzed data and wrote the manuscript. RG performed the AAS analysis of tissue samples supplied. SJP help prepare animal tissues and reviewed the manuscript. All authors read and approved the final manuscript.
Competing interests
The authors declare that they have no competing interests.
Consent for publication Not applicable.
Ethics approval and consent to participate
All animal experiments were in compliance with protocols approved by the University of Rochester University Committee on Animal Resources (UCAR) #100360/2010-024.
Publisher’s Note
Springer Nature remains neutral with regard to jurisdictional claims in published maps and institutional affiliations.
Author details 1
Department of Biomedical Engineering, University of Rochester, Rochester, NY, USA.2Department of Environmental Medicine, University of Rochester Medical Center, New York, USA.3Department of Dermatology, University of Rochester Medical Center, Dermatology and Biomedical Engineering, 601 Elmwood Avenue, Box 697, Rochester, NY 14642, USA.
Received: 2 December 2016 Accepted: 27 March 2017
References
1. DeLouise LA. Applications of nanotechnology in dermatology. J Invest Dermatol. 2012;132(3 Pt 2):964–75.
2. Zhao J, Wallace M, Melancon MP. Cancer theranostics with gold nanoshells. Nanomedicine (Lond). 2014;9(13):2041–57.
3. Tong S, et al. Nanomedicine: tiny particles and machines give huge gains. Ann Biomed Eng. 2014;42(2):243–59.
4. Sun T, et al. Engineered nanoparticles for drug delivery in cancer therapy. Angew Chem Int Ed Engl. 2014;53(46):12320–64.
5. Sharifi S, et al. Superparamagnetic iron oxide nanoparticles for in vivo molecular and cellular imaging. Contrast Media Mol Imaging. 2015;10(5): 329–55.
6. Dong H, et al. Surface-engineered graphene-based nanomaterials for drug delivery. J Biomed Nanotechnol. 2014;10(9):2086–106.
7. Bilan R, et al. Quantum dot surface chemistry and functionalization for cell targeting and imaging. Bioconjug Chem. 2015;26(4):609–24.
8. Wiesenthal A, et al. Nanoparticles: small and mighty. Int J Dermatol. 2011; 50(3):247–54.
9. Lohani A, et al. Nanotechnology-based cosmeceuticals. ISRN Dermatol. 2014;2014:843687.
10. Burnett ME, Wang SQ. Current sunscreen controversies: a critical review. Photodermatol Photoimmunol Photomed. 2011;27(2):58–67.
11. Monteiro-Riviere NA, et al. Safety evaluation of sunscreen formulations containing titanium dioxide and zinc oxide nanoparticles in UVB sunburned skin: an in vitro and in vivo study. Toxicol Sci. 2011;123(1):264–80. 12. Osmond-McLeod MJ, et al. Dermal absorption and short-term biological
impact in hairless mice from sunscreens containing zinc oxide nano- or larger particles. Nanotoxicology. 2014;8 Suppl 1:72–84.
13. Jatana S, DeLouise LA. UVR and nanotechnology skin safety. WIREs Nanomed Nanobiotechnol. 2013;6(1):61–79.
14. Lim JL, Stern RS. High levels of ultraviolet B exposure increase the risk of non-melanoma skin cancer in psoralen and ultraviolet A-treated patients. J Invest Dermatol. 2005;124(3):505–13.
15. Hansen S, Lehr CM. Nanoparticles for transcutaneous vaccination. Microb Biotechnol. 2012;5(2):156–67.
16. Eller MS, Asarch A, Gilchrest BA. Photoprotection in human skin–a multifaceted SOS response. Photochem Photobiol. 2008;84(2):339–49. 17. Federman DG, Kirsner RS, Concato J. Sunscreen counseling by US
physicians. JAMA. 2014;312(1):87–8.
18. Abe T, Mayuzumi J. The change and recovery of human skin barrier functions after ultraviolet light irradiation. Chem Pharm Bull (Tokyo). 1979; 27(2):458–62.
19. Mortensen LJ, et al. Quantification of quantum dot murine skin penetration with UVR barrier impairment. Nanotoxicology. 2013;7(8):1386–98. 20. Rass K, Reichrath J. UV damage and DNA repair in malignant melanoma
and nonmelanoma skin cancer. Adv Exp Med Biol. 2008;624:162–78. 21. Gilchrest BA. Photoaging. J Invest Dermatol. 2013;133(E1):E2–6.
22. Mortensen LJ, et al. In vivo skin penetration of quantum dot nanoparticles in the murine model: the effect of UVR. Nano Lett. 2008;8(9):2779–87. 23. Vasudevan D, et al. Core–shell quantum dots: Properties and applications.
24. Yu WW, et al. Water-soluble quantum dots for biomedical applications. Biochem Biophys Res Commun. 2006;348(3):781–6.
25. He X, Ma N. An overview of recent advances in quantum dots for biomedical applications. Colloids Surf B: Biointerfaces. 2014;124:118–31. 26. Zheng H, Mortensen LJ, DeLouise LA. Thiol antioxidant-functionalized CdSe/
ZnS quantum dots: synthesis, characterization, cytotoxicity. J Biomed Nanotechnol. 2013;9(3):382–92.
27. Mortensen LJ, et al. Progress and challenges in quantifying skin permeability to nanoparticles using a quantum dot model. J Biomed Nanotechnol. 2010; 6(5):596–604.
28. Mortensen LJ, et al. Near-IR fluorescence and reflectance confocal microscopy for imaging of quantum dots in mammalian skin. Biomed Opt Express. 2011;2(6):1610–25.
29. Liu N, et al. Degradation of aqueous synthesized CdTe/ZnS quantum dots in mice: differential blood kinetics and biodistribution of cadmium and tellurium. Part Fibre Toxicol. 2013;10:37.
30. Gopee NV, et al. Migration of intradermally injected quantum dots to sentinel organs in mice. Toxicol Sci. 2007;98(1):249–57.
31. Gopee NV, et al. Quantitative determination of skin penetration of PEG-coated CdSe quantum dots in dermabraded but not intact SKH-1 hairless mouse skin. Toxicol Sci. 2009;111(1):37–48.
32. Tripp CS, et al. Epidermal COX-2 induction following ultraviolet irradiation: suggested mechanism for the role of COX-2 inhibition in photoprotection. J Invest Dermatol. 2003;121(4):853–61.
33. Jatana S, et al. Impact of cosmetic lotions on Nanoparticle penetration through ex vivo C57BL/6 hairless mouse and human skin: a comparison study. Cosmetics. 2016;3(1). https://www.ncbi.nlm.nih.gov/pubmed/ 27453793.
34. Zhang LW, et al. Biological interactions of quantum dot nanoparticles in skin and in human epidermal keratinocytes. Toxicol Appl Pharmacol. 2008; 228(2):200–11.
35. Xie G, Lu W, Lu D. Penetration of titanium dioxide nanoparticles through slightly damaged skin in vitro and in vivo. J Appl Biomater Funct Mater. 2015;13(14):356–61.
36. Tang L, et al. In vivo skin penetration and metabolic path of quantum dots. Sci China Life Sci. 2013;56(2):181–8.
37. Holmes AM, et al. Relative penetration of zinc oxide and zinc ions into human skin after application of different zinc oxide formulations. ACS Nano. 2016;10(2): 1810–9.
38. Yang S, et al. Renal clearance and degradation of glutathione-coated copper nanoparticles. Bioconjug Chem. 2015;26(3):511–9.
39. Mesnage R, et al. Laboratory rodent diets contain toxic levels of environmental contaminants: implications for regulatory tests. PLoS One. 2015;10(7):e0128429.
40. Schwarz T. Mechanisms of UV-induced immunosuppression. Keio J Med. 2005;54(4):165–71.
41. Schwarz T. Ultraviolet radiation-induced tolerance. Allergy. 1999;54(12):1252–61. 42. Clydesdale GJ, Dandie GW, Muller HK. Ultraviolet light induced injury:
immunological and inflammatory effects. Immunol Cell Biol. 2001;79(6):547–68. 43. Schwarz T. 25 years of UV-induced immunosuppression mediated by T
cells-from disregarded T suppressor cells to highly respected regulatory T cells. Photochem Photobiol. 2008;84(1):10–8.
44. Schwarz A, et al. Langerhans cells are required for UVR-induced immunosuppression. J Invest Dermatol. 2010;130(5):1419–27. 45. Schwarz A, Schwarz T. UVR-induced regulatory T cells switch
antigen-presenting cells from a stimulatory to a regulatory phenotype. J Invest Dermatol. 2010;130(7):1914–21.
46. Majewski S, et al. IL-23 antagonizes UVR-induced immunosuppression through two mechanisms: reduction of UVR-induced DNA damage and inhibition of UVR-induced regulatory T cells. J Invest Dermatol. 2010;130(2):554–62. 47. Zaidi MR, et al. Interferon-gamma links ultraviolet radiation to
melanomagenesis in mice. Nature. 2011;469(7331):548–53.
48. Toichi E, et al. Skin-infiltrating monocytes/macrophages migrate to draining lymph nodes and produce IL-10 after contact sensitizer exposure to UV-irradiated skin. J Invest Dermatol. 2008;128(11):2705–15.
49. Kang K, et al. CD11b + macrophages that infiltrate human epidermis after in vivo ultraviolet exposure potently produce IL-10 and represent the major secretory source of epidermal IL-10 protein. J Immunol. 1994;153(11):5256–64. 50. Gaddameedhi S, et al. The circadian clock controls sunburn apoptosis and
erythema in mouse skin. J Invest Dermatol. 2015;135(4):1119–27.
51. Jiang SJ, et al. Biophysical and morphological changes in the stratum corneum lipids induced by UVB irradiation. J Dermatol Sci. 2006;44(1):29–36. 52. Holleran WM, et al. Structural and biochemical basis for the UVB-induced
alterations in epidermal barrier function. Photodermatol Photoimmunol Photomed. 1997;13(4):117–28.
53. Haratake A, et al. UVB-induced alterations in permeability barrier function: roles for epidermal hyperproliferation and thymocyte-mediated response. J Invest Dermatol. 1997;108(5):769–75.
54. Prow TW, et al. Quantum dot penetration into viable human skin. Nanotoxicology. 2012;6(2):173–85.
55. Kuo TR, et al. Chemical enhancer induced changes in the mechanisms of transdermal delivery of zinc oxide nanoparticles. Biomaterials. 2009;30(16): 3002–8.
56. Alvarez-Roman R, et al. Skin penetration and distribution of polymeric nanoparticles. J Control Release. 2004;99(1):53–62.
• We accept pre-submission inquiries
• Our selector tool helps you to find the most relevant journal
• We provide round the clock customer support
• Convenient online submission
• Thorough peer review
• Inclusion in PubMed and all major indexing services
• Maximum visibility for your research
Submit your manuscript at www.biomedcentral.com/submit