Open Access
Software
Sampling and sensitivity analyses tools (SaSAT) for computational
modelling
Alexander Hoare, David G Regan and David P Wilson*
Address: National Centre in HIV Epidemiology and Clinical Research, The University of New South Wales, Sydney, New South Wales, 2010, Australia
Email: Alexander Hoare - [email protected]; David G Regan - [email protected]; David P Wilson* - [email protected]
* Corresponding author
Abstract
SaSAT (Sampling and Sensitivity Analysis Tools) is a user-friendly software package for applying uncertainty and sensitivity analyses to mathematical and computational models of arbitrary complexity and context. The toolbox is built in Matlab®, a numerical mathematical software package, and utilises algorithms contained in the Matlab® Statistics Toolbox. However, Matlab® is not required to use SaSAT as the software package is provided as an executable file with all the necessary supplementary files. The SaSAT package is also designed to work seamlessly with Microsoft Excel but no functionality is forfeited if that software is not available. A comprehensive suite of tools is provided to enable the following tasks to be easily performed: efficient and equitable sampling of parameter space by various methodologies; calculation of correlation coefficients; regression analysis; factor prioritisation; and graphical output of results, including response surfaces, tornado plots, and scatterplots. Use of SaSAT is exemplified by application to a simple epidemic model. To our knowledge, a number of the methods available in SaSAT for performing sensitivity analyses have not previously been used in epidemiological modelling and their usefulness in this context is demonstrated.
Introduction
Mathematical and computational models today play a key role in almost every branch of science. The rapid advances in computer technology have led to increasingly more complex models as performance more like the real sys-tems being investigated is sought. As a result, uncertainty and sensitivity analyses for quantifying the range of varia-bility in model responses and for identifying the key fac-tors giving rise to model outcomes have become essential for determining model robustness and reliability and for ensuring transparency [1]. Furthermore, as it is not uncommon for models to have dozens or even hundreds of independent predictors, these analyses usually
consti-tute the first and primary approach for establishing mech-anistic insights to the observed responses.
The challenge in conducting uncertainty analysis for mod-els with moderate to large numbers of parameters is to explore the multi-dimensional parameter space in an equitable and computationally efficient way. Latin hyper-cube sampling (LHS), a type of stratified Monte Carlo sampling [2,3] that is an extension of Latin Square sam-pling [4,5] first proposed by McKay at al. [6] and further developed and introduced by Iman et al. [1-3], is a sophis-ticated and efficient method for achieving equitable sam-pling of all predictors simultaneously. Uncertainty
Published: 27 February 2008
Theoretical Biology and Medical Modelling 2008, 5:4 doi:10.1186/1742-4682-5-4
Received: 17 September 2007 Accepted: 27 February 2008
This article is available from: http://www.tbiomed.com/content/5/1/4
© 2008 Hoare et al; licensee BioMed Central Ltd.
analyses in this context use parameter samples generated by LHS as inputs in an independent external model; each sample may produce a different model response/out-come. Sensitivity analysis may then be conducted to rank the predictors (input parameters) in terms of their contri-bution to the uncertainty in each of the responses (model outcomes). This can be achieved in several ways involving primarily the calculation of correlation coefficients and regression analysis [1,7], and variance-based methods [8].
In response to our need to conduct these analyses for numerous and diverse modelling exercises, we were moti-vated to develop a suite of tools, assembled behind a user-friendly interface, that would facilitate this process. We have named this toolbox SaSAT for "Sampling and Sensi-tivity Analysis Tools". The toolbox was developed in the widely used mathematical software package Matlab® (The Mathworks, Inc., MA, USA) and utilises the industrial strength algorithms built into this package and the Mat-lab® Statistics Toolbox. It enables uncertainty analysis to be applied to models of arbitrary complexity, using the LHS method for sampling the input parameter space. SaSAT is independent of the model being applied; SaSAT generates input parameter samples for an external model and then uses these samples in conjunction with outputs (responses) generated from the external model to perform sensitivity analyses. A variety of methods are available for conducting sensitivity analyses including the calculation of correlation coefficients, standardised and non-stand-ardised linear regression, logistic regression, Kolmogorov-Smirnov test, and factor prioritization by reduction of var-iance. The option to import data from, and export data to, Microsoft Excel or Matlab® is provided but not requisite. The results of analyses can be output in a variety of graph-ical and text-based formats.
While the utility of the toolbox is not confined to any par-ticular discipline or modelling paradigm, the last two or three decades have seen remarkable growth in the use and importance of mathematical modelling in the epidemio-logical context (the primary context for modelling by the authors). However, many of the methods for uncertainty and sensitivity analysis that have been used extensively in other disciplines have not been widely used in epidemio-logical modelling. This paper provides a description of the SaSAT toolbox and the methods it employs, and exempli-fies its use by application to a simple epidemic model with intervention. But SaSAT can be used in conjunction with theoretical or computational models applied to any discipline. Online supplementary material to this paper provides the freely downloadable full version of the SaSAT software for use by other practitioners [see Addi-tional file 1].
Description of methods
In this section we provide a very brief overview and description of the sampling and sensitivity analysis meth-ods used in SaSAT. A user manual for the software is pro-vided as supplementary material. Note that we use the terms parameter, predictor, explanatory variable, factor interchangeably, as well as outcome, output variable, and response.
Sampling methods and uncertainty analysis
Uncertainty analyses explore parameter ranges rather than simply focusing on specific parameter values. They are used to determine the degree of uncertainty in model out-comes that is due to uncertainty in the input parameters. Each input parameter for a model can be defined to have an appropriate probability density function associated with it. Then, the computational model can be simulated by sampling a single value from each parameter's distribu-tion. Many samples should be taken and many simula-tions should be run, producing variable output values. The variation in the output can then be explored as it relates to the variation in the input. There are various approaches that could be taken to sample from the parameter distributions. Ideally one should vary all (M) model parameters simultaneously in the M-dimensional parameter space in an efficient manner. SaSAT provides random sampling, full factorial sampling, and Latin Hypercube Sampling.
Random sampling
The first obvious sampling approach is random sampling whereby each parameter's distribution is used to draw N
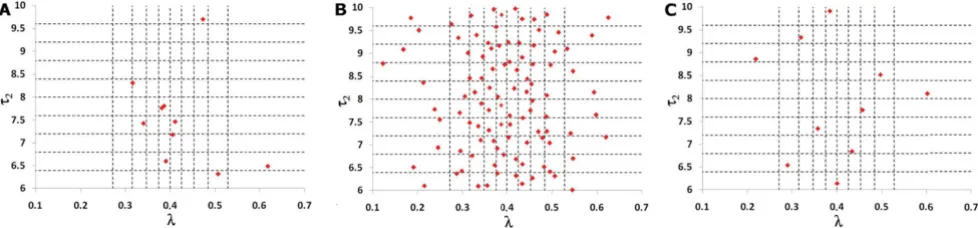
values randomly. This is generally vastly superior to uni-variate approaches to uncertainty and sensitivity analyses, but it is not the most efficient way to sample the parame-ter space. In Figure 1a we present one instance of random sampling of two parameters.
Full factorial sampling
The full factorial sampling scheme uses a value from every sampling interval for each possible combination of parameters (see Figure 1b for an illustrative example). This approach has the advantage of exploring the entire parameter space but is extremely computationally ineffi-cient and time-consuming and thus not feasible for all models. If there are M parameters and each one has N val-ues (or its distribution is divided into N equiprobable intervals), then the total number of parameter sets and model simulations is NM (for example, 20 parameters and
Latin hypercube sampling
More efficient and refined statistical techniques have been applied to sampling. Currently, the standard sampling technique employed is Latin Hypercube Sampling and this was introduced to the field of disease modelling (the field of our research) by Blower [9]. For each parameter a probability density function is defined and stratified into
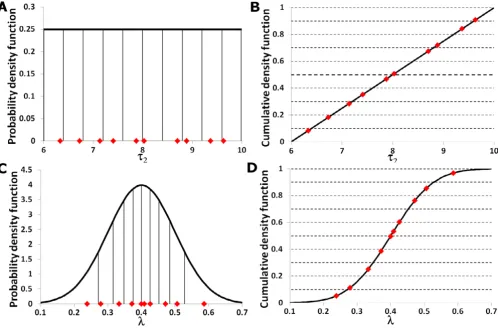
N equiprobable serial intervals. A single value is then selected randomly from every interval and this is done for every parameter. In this way, an input value from each sampling interval is used only once in the analysis but the entire parameter space is equitably sampled in an efficient manner [1,9-11]. Distributions of the outcome variables can then be derived directly by running the model N times with each of the sampled parameter sets. The algorithm for the Latin Hypercube Sampling methodology is described clearly in [9]. Figure 1c and Figure 2 illustrate how the probability density functions are divided into equiprobable intervals and provide an example of the sampling.
Sensitivity analyses for continuous variables
Sensitivity analysis is used to determine how the uncer-tainty in the output from computational models can be apportioned to sources of variability in the model inputs [9,12]. A good sensitivity analysis will extend an uncer-tainty analysis by identifying which parameters are impor-tant (due to the variability in their uncertainty) in contributing to the variability in the outcome variable [1]. A description of the sensitivity analysis methods available in SaSAT is now provided.
Correlation coefficients
The association, or relationship, between two different kinds of variables or measurements is often of
considera-ble interest. The standard measure of ascertaining such associations is the correlation coefficient; it is given as a value between -1 and +1 which indicates the degree to which two variables (e.g., an input parameter and output variable) are linearly related. If the relationship is per-fectly linear (such that all data points lie perper-fectly on a straight line), the correlation coefficient is +1 if there is a positive correlation and -1 if the line has a negative slope. A correlation coefficient of zero means that there is no lin-ear relationship between the variables. SaSAT provides three types of correlation coefficients, namely: Pearson; Spearman; and Partial Rank. These correlation coefficients depend on the variability of variables. Therefore it should be noted that if a predictor is highly important but has only a single point estimate then it will not have correla-tion with outcome variability, but if it is given a wide uncertainty range then it may have a large correlation coefficient (if there is an association). Raw samples can be used in these analyses and do not need to be standardized.
Interpretation of the Pearson correlation coefficient assumes both variables follow a Normal distribution and that the relationship between the variables is a linear one. It is the simplest of correlation measures and is described in all basic statistics textbooks [13]. When the assumption of normality is not justified, and/or the relationship between the variables is non-linear, a non-parametric measure such as the Spearman Rank Correlation Coeffi-cient is more appropriate. By assigning ranks to data (positioning each datum point on an ordinal scale in rela-tion to all other data points), any outliers can also be incorporated without heavily biasing the calculated rela-tionship. This measure assesses how well an arbitrary monotonic function describes the relationship between two variables, without making any assumptions about the Examples of the three different sampling schemes
Figure 1
frequency distribution of the variables. Such measures are powerful when only a single pair of variables is to be investigated. However, quite often measurements of dif-ferent kinds will occur in batches. This is especially the case in the analysis of most computational models that have many input parameters and various outcome varia-bles. Here, the relationship between each input parameter with each outcome variable is desired. Specifically, each relationship should be ascertained whilst also acknowl-edging that there are various other contributing factors (input parameters). Simple correlation analyses could be carried out by taking the pairing of each outcome variable and each input parameter in turn, but it would be unwieldy and would fail to reveal more complicated pat-terns of relationships that might exist between the out-come variables and several variables simultaneously. Therefore, an extension is required and the appropriate extension for handling groups of variables is partial
corre-lation. For example, one may want to know how A was related to B when controlling for the effects of C, D, and E. Partial rank correlation coefficients (PRCCs) are the most general and appropriate method in this case. We rec-ommend calculating PRCCs for most applications. The method of calculating PRCCs for the purpose of sensitiv-ity analysis was first developed for risk analysis in various systems [2-5,14]. Blower pioneered its application to dis-ease transmission models [9,15-22]. Because the outcome variables of dynamic models are time dependent, PRCCs should be calculated over the outcome time-course to determine whether they also change substantially with time. The interpretation of PRCCs assumes a monotonic relationship between the variables. Thus, it is also impor-tant to examine scatter-plots of each model parameter ver-sus each predicted outcome variable to check for monotonicity and discontinuities [4,9,23]. PRCCs are useful for identifying the most important parameters but Examples of the probability density functions ((a) and (c)) and cumulative density functions ((b) and (d)) associated with parameters used in Figure 1; the black vertical lines divide the probability density functions into areas of equal probability
Figure 2
not for quantifying how much change occurs in the out-come variable by changing the value of the input parame-ter. However, because they have a sign (positive or negative) PRCCs can indicate the direction of change in the outcome variable if there is an increase or decrease in the input parameter. This can be further explored with regression and response surface analyses.
Regression
When the relationship between variables is not monot-onic or when measurements are arbitrarily or irregularly distributed, regression analysis is more appropriate than simple correlation coefficients. A regression equation pro-vides an expression of the relationship between two (or more) variables algebraically and indicates the extent to which a dependent variable can be predicted by knowing the values of other variables, or the extent of the associa-tion with other variables. In effect, the regression model is a surrogate for the true computational model. Accord-ingly, the coefficient of determination, R2, should be cal-culated with all regression models and the regression analysis should not be used if R2 is low (arbitrarily, less than ~ 0.6). R2 indicates the proportion of the variability in the data set that is explained by the fitted model and is calculated as the ratio of the sum of squares of the residu-als to the total sum of squares. The adjusted R2 statistic is a modification of R2 that adjusts for the number of explan-atory terms in the model. R2 will tend to increase with the number of terms in the statistical model and therefore cannot be used as a meaningful comparator of models with different numbers of covariants (e.g., linear versus quadratic). The adjusted R2, however, increases only if the new term improves the model more than would be expected by chance and is therefore preferable for making such comparisons. Both R2 and adjusted R2 measures are provided in SaSAT.
Regression analysis seeks to relate a response, or output variable, to a number of predictors or input variables that affect it. Although higher-order polynomial expressions can be used, constructing linear regression equations with interaction terms or full quadratic responses is recom-mended. This is in order to include direct effects of each input variable and also variable cross interactions and nonlinearities; that is, the effect of each input variable is directly accounted for by linear terms as a first-order approximation but we also include the effects of second-order nonlinearities associated with each variable and possible interactions between variables. The generalized form of the full second-order regression model is:
where Y is the dependent response variable, the Xi's are the predictor (input parameter) variables, and the β's are regression coefficients.
One of the values of regression analysis is that results can be inspected visually. If there is only a single explanatory input variable for an outcome variable of interest, then the regression equation can be plotted graphically as a curve; if there are two explanatory variables then a three dimen-sional surface can be plotted. For greater than two explan-atory variables the resulting regression equation is a hypersurface. Although hypersurfaces cannot be shown graphically, contour plots can be generated by taking level slices, fixing certain parameters. Further, complex rela-tionships and interactions between outputs and input parameters are simplified in an easily interpreted manner [24,25]. Cross-products of input parameters reveal inter-action effects of model input parameters, and squared or higher order terms allow curvature of the hypersurface. Obviously this can best be presented and understood when the dominant two predicting parameters are used so that the hypersurface is a visualised surface.
Although regression analysis can be useful to predict a response based on the values of the explanatory variables, the coefficients of the regression expression do not pro-vide mechanistic insight nor do they indicate which parameters are most influential in affecting the outcome variable. This is due to differences in the magnitudes and variability of explanatory variables, and because the vari-ables will usually be associated with different units. These are referred to as unstandardized variables and regression analysis applied to unstandardized variables yields unstandardized coefficients. The independent and dependent variables can be standardized by subtracting the mean and dividing by the standard deviation of the values of the unstandardized variables yielding standard-ized variables with mean of zero and variance of one. Regression analysis on standardized variables produces standardized coefficients [26], which represent the change in the response variable that results from a change of one standard deviation in the corresponding explanatory vari-able. While it must be noted that there is no reason why a change of one standard deviation in one variable should be comparable with one standard deviation in another variable, standardized coefficients enable the order of importance of the explanatory variables to be determined (in much the same way as PRCCs). Standardized coeffi-cients should be interpreted carefully – indeed, unstand-ardized measures are often more informative. Standardized coefficients take values between -1 and +1; a standardized coefficient of +/-1 means that the predictor variable perfectly describes the response variable and a value of zero means that the predictor variable has no influence in predicting the response variable.
Standard-Y iXi iiXi ijX Xi j
j i m i m i m i m = + + + = + = − = =
∑
∑
∑
∑
b0 b b 2 b
ized regression coefficients should not, however, be con-sidered to be equivalent to PRCCs. They both take values in the same range (-1 to +1), can be used to rank parame-ter importance, and have similar inparame-terpretations at the extremes but they are evaluated differently and measure different quantities. Consequently, PRCCs and standard-ized regression coefficients will differ in value and may differ slightly in ranking when analysing the same data. The magnitude of standardized regression coefficients will typically be lower than PRCCs and should not be used alone for determining variable importance when there are large numbers of explanatory variables. However, the regression equation can provide more meaningful sensi-tivity than correlation coefficients as it can be shown that an x% decrease in one parameter can be offset by a y% increase/decrease in another, simply by exploring the coefficients of the regression equation. It must be noted that this is true for the statistical model, which is a surro-gate for the actual model. The degree to which such claims can be inferred to the true model is determined by the coefficient of determination, R2.
Factor prioritization by reduction of variance
Factor prioritization is a broad term denoting a group of statistical methodologies for ranking the importance of variables in contributing to particular outcomes. Vari-ance-based measures for factor prioritization have yet to be used in many computational modelling fields,, although they are popular in some disciplines [27-34]. The objective of reduction of variance is to identify the fac-tor which, if determined (that is, fixed to its true, albeit unknown, value), would lead to the greatest reduction in the variance of the output variable of interest. The second most important factor in reducing the outcome is then determined etc., until all independent input factors are ranked. The concept of importance is thus explicitly linked to a reduction of the variance of the outcome. Reduction of variance can be described conceptually by the following question: for a generic model,
Y = f(X1,...,XM),
how would the uncertainty in Y change if a particular independent variable Xi could be fixed as a constant? This
resultant variation is denoted by VX ~ i(Y|Xi = ). We
expect that having fixed one source of variation (Xi), the
resulting variance VX~i(Y|Xi = ) would be smaller than
the total or unconditional variance V(Y). Hence, VX~i(Y|Xi
= ) can be used as a measure of the importance of Xi ;
the smaller VX~i(Y|Xi = ), the more Xi is influential.
However, this is based on sensitivity with respect to the
position of a single point Xi = for each input variable, and it is also possible to design a model for which
VX~i(Y|Xi = ) at particular values is greater than the
unconditional variance, V(Y) [35]. In general, it is also not possible to obtain a precise factor prioritization, as this would imply knowing the true value of each factor. The reduction of variance methodology is therefore applied to rank parameters in terms of their direct contribution to uncertainty in the outcome. The factor of greatest impor-tance is determined to be that, which when fixed, will on average result in the greatest reduction in variance in the outcome. "On average" specifies in this case that the vari-ation of the outcome factor should be averaged over the defined distribution of the specific input factor, removing
the dependence on . This is written as
and will always be less than or equal
to V(Y); in fact,
A small , or a large
implies that Xi is an important factor. Then, a first order sensitivity index of Xi on Y can be defined as
Conveniently, the sensitivity index takes values between 0 and 1. A high value of Si implies that Xi is an important variable. Variance based measures, such as the sensitivity index just defined, are concise, and easy to understand and communicate. This is an appropriate measure of sen-sitivity to use to rank the input factors in order of impor-tance even if the input factors are correlated [36]. Furthermore, this method is completely 'model-free'. The sensitivity index is also very easy to interpret; Si can be interpreted as being the proportion of the total variance attributable to variable Xi. In practice, this measure is cal-culated by using the input variables and output variables and fitting a surrogate model, such as a regression equa-tion; a regression model is used in our SaSAT application. Therefore, one must check that the coefficient of determi-nation is sufficiently large for this method to be reliable (an R2 value for the chosen regression model can be calcu-lated in SaSAT).
Sensitivity analyses for binary outputs: logistic regression
Binomial logistic regression is a form of regression, which is used when the response variable is dichotomous (0/1;
xi∗
xi∗
xi∗
xi∗
xi∗
xi∗ xi∗
xi∗
EXi
(
VX~i(
Y Xi)
)
EXi
(
VX~i(
Y Xi)
)
+VXi(
EX~i(
Y Xi)
)
=V Y( ).EXi
(
VX~i(
Y Xi)
)
VXi(
EX~i(
Y Xi)
)
S VXi E i Y Xi V Y
i =
(
(
)
)
X~
the independent predictor variables can be of any type). It is used very extensively in the medical, biological, and social sciences [37-41]. Logistic regression analysis can be used for any dichotomous response; for example, whether or not disease or death occurs. Any outcome can be con-sidered dichotomous by distinguishing values that lie above or below a particular threshold. Depending on the context these may be thought of qualitatively as "favoura-ble" or "unfavoura"favoura-ble" outcomes. Logistic regression entails calculating the probability of an event occurring, given the values of various predictors. The logistic regres-sion analysis determines the importance of each predictor in influencing the particular outcome. In SaSAT, we calcu-late the coefficients (βi) of the generalized linear model that uses the logit link function,
where pi = E(Y|Xi) = Pr(Yi = 1) and the X's are the covari-ates; the solution for the coefficients is determined by maximizing the conditional log-likelihood of the model given the data. We also calculate the odds ratio (with 95% confidence interval) and p-value associated with the odds ratio.
There is no precise way to calculate R2 for logistic regres-sion models. A number of methods are used to calculate a pseudo-R2, but there is no consensus on which method is best. In SaSAT, R2 is calculated by performing bivariate regression on the observed dependent and predicted val-ues [42].
Sensitivity analyses for binary outputs: Kolmogorov-Smirnov Like binomial logistic regression, the Smirnov two-sample test (two-sided version) [43-46] can also be used when the response variable is dichotomous or upon dividing a con-tinuous or multiple discrete response into two categories. Each model simulation is classified according to the spec-ification of the 'acceptable' model behaviour; simulations are allocated to either set A if the model output lies within the specified constraints, and set to A' otherwise. The Smirnov two-sample test is performed for each predictor variable independently, analysing the maximum distance
dmax between the cumulative distributions of the specific predictor variables in the A and A' sets. The test statistic is
dmax, the maximum distance between the two cumulative distribution functions, and is used to test the null hypoth-esis that the distribution functions of the populations from which the samples have been drawn are identical. P-values for the test statistics are calculated by permutation of the exact distribution whenever possible [46-48]. The smaller the p-value (or equivalently the larger dmax(xi), the more important is the predictor variable, Xi, in driving the behaviour of the model.
Overview of software
SaSAT has been designed to offer users an easy to use package containing all the statistical analysis tools described above. They have been brought together under a simple and accessible graphical user interface (GUI). The GUI and functionality was designed and programmed using MATLAB® (version 7.4.0.287, Mathworks, MA, USA), and makes use of MATLAB®'s native functions. However, the user is not required to have any program-ming knowledge or even experience with MATLAB® as SaSAT stands alone as an independent software package compiled as an executable. SaSAT is able to read and write MS-Excel and/or MATLAB® '*.mat' files, and can convert between them, but it is not requisite to own either Excel or Matlab.
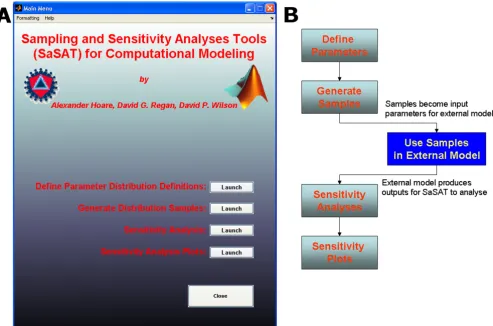
The opening screen presents the main menu (Figure 3a), which acts as a hub from which each of four modules can be accessed. SaSAT's User Guide [see Additional file 2] is available via the Help tab at the top of the window, ena-bling quick access to helpful guides on the various utili-ties. A typical process in a computational modelling exercise would entail the sequence of steps shown in Fig-ure 3b. The model (input) parameter sets generated in steps 1 and 2 are used to externally simulate the model (step 3). The output from the external model, along with the input values, will then be brought back to SaSAT for sensitivity analyses (steps 4 and 5).
Define parameter distributions
The 'Define Parameter Distribution' utility (interface shown in Figure 4a) allows users to assign various distribution functions to their model parameters. SaSAT provides six-teen distributions, nine basic distributions: 1) Constant, 2) Uniform, 3) Normal, 4) Triangular, 5) Gamma, 6) Log-normal, 7) Exponential, 8) Weibull, and 9) Beta; and seven additional distributions have also been included, which allow dependencies upon previously defined parameters. When data is available to inform the choice of distribution, the parameter assignment is easily made. However, in the absence of data to inform on the distribu-tion for a given parameter, we recommend using either a uniform distribution or a triangular distribution peaked at the median and relatively broad range between the mini-mum and maximini-mum values as guided by literature or expert opinion. When all parameters have been defined, a definition file can be saved for later use (such as sample generation).
Generate distribution samples
Typically, the next step after defining parameter distribu-tions is to generate samples from those distribudistribu-tions. This is easily achieved using the 'Generate Distribution Samples' utility (interface shown in Figure 4b). Three different sam-pling techniques are offered: 1) Random, 2) Latin
Hyper-logit p pi
pi X X X i n
i i i m m i
( )= − ⎛ ⎝ ⎜ ⎞ ⎠ ⎟ = + + + + =
ln , , ,, .
cube, and 3) Full Factorial, from which the user can choose. Once a distribution method has been selected, the user need only select the definition file (created in the pre-vious step using the 'Define Parameter Distribution' utility), the destination file for the samples to be stored, and the number of samples desired, and a parameter samples file will be generated. There are several options available, such as viewing and saving a plot of each parameter's distribu-tion. Once a samples file is created, the user may then pro-ceed to producing results from their external model using the samples file as an input for setting the parameter val-ues.
Sensitivity analyses
The 'Sensitivity Analysis Utility' (interface shown in Figure 4c) provides a suite of powerful sensitivity analysis tools for calculating: 1) Pearson Correlation Coefficients, 2) Spearman Correlation Coefficients, 3) Partial Rank
Corre-lation Coefficients, 4) Unstandardized Regression, 5) Standardized Regression, 6) Logistic Regression, 7) Kol-mogorov-Smirnov test, and 8) Factor Prioritization by Reduction of Variance. The results of these analyses can be shown directly on the screen, or saved to a file for later inspection allowing users to identify key relationships between parameters and outcome variables.
Sensitivity analyses plots
The last utility, 'Sensitivity Analyses Plots' (interface shown in Figure 4d) offers users the ability to visually display some results from the sensitivity analyses. Users can cre-ate: 1) Scatter plots, 2) Tornado plots, 3) Response surface plots, 4) Box plots, 5) Pie charts, 6) Cumulative distribu-tion plots, 7) Kolmogorov-Smirnov CDF plots. Opdistribu-tions are provided for altering many properties of figures (e.g., font sizes, image resolution, etc.). The user is also pro-vided the option to save each plot as either a *.tiff, *.eps,
(a) The main menu of SaSAT, showing options to enter the four utilities; (b) a flow chart describing the typical process of a modelling exercise when using SaSAT with an external computational model, beginning with the user assigning parameter defi-nitions for each parameter used by their model via the SaSAT 'Define Parameter Distribution' utility
Figure 3
Screenshots of each of SaSAT's four different utilities
Figure 4
or *.jpeg file, in order to produce images of suitable qual-ity for publication.
A simple epidemiological example
To illustrate the usefulness of SaSAT, we apply it to a sim-ple theoretical model of disease transmission with inter-vention. In the earliest stages of an emerging respiratory epidemic, such as SARS or avian influenza, the number of infected people is likely to rise quickly (exponentially) and if the disease sequelae of the infections are very seri-ous, health officials will attempt intervention strategies, such as isolating infected individuals, to reduce further transmission. We present a 'time-delay' mathematical model for such an epidemic. In this model, the disease has an incubation period of τ1 days in which the infection is asymptomatic and non-transmissible. Following the incu-bation period, infected people are infectious for a period of τ2 days, after which they are no longer infectious (either due to recovery from infection or death). During the infec-tious period an infected person may be admitted to a health care facility for isolation and is therefore removed from the cohort of infectious people. We assume that the rate of colonization of infection is dependent on the number of current infectious people I(t), and the infectiv-ity rate λ(λis a function of the number of susceptible peo-ple that each infectious person is in contact with on average each day, the duration of time over which the con-tact is established, and the probability of transmission over that contact time). Under these conditions, the rate of entry of people into the incubation stage is λ I (known as the force of infection); we assume that susceptible peo-ple are not in limited supply in the early stages of the
epi-demic. In this model λ is the average number of new infections per infectious person per day. We model the change between disease stages as a step-wise rate, i.e., after exactly τ1 days of incubation individuals become tious and are then removed from the system after an infec-tious period of a further τ2 days. If 1/γis the average time from the onset of infectiousness until isolation, then the rate of change in the number of infectious people at time
t is given by
The exponential term arises from the fact that infected people are removed at a rate γover τ2 days [49]. See Figure 5 for a schematic diagram of the model structure. Mathe-matical stability and threshold analyses (not shown) reveal that the critical threshold for controlling the epi-demic is
This threshold parameter, known as the basic reproduc-tion number [50], is independent of τ1 (the incubation period). But at the beginning of the epidemic, if there is no removal of infectious people before natural removal
by recovery or death (that is, if γ= 0), the threshold parameter becomes R0 = λτ2. If the infectious period (τ2) is long and there is significant removal of infectious peo-ple (γ> 0), then the threshold criterion reduces to R0 = λ/
d d
I
t = I t
(
−)
− e I t(
− −)
− I t( )
−l t1 l gt2 t1 t2 g .
R0=
(
1−e−gt2)
l g.Schematic diagram of the framework of our illustrative theoretical epidemic model
Figure 5
γ. Intuitively, both of these limiting cases represent the average number of days that someone is infectious multi-plied by the average number of people to whom they will
transmit infection per day.
In order to contain (and effectively eliminate) an epi-demic an intervention could involve attempting to quar-antine infected individuals sufficiently quickly such that γ > λ. The sooner such an intervention is implemented, the greater the number of new infections that will be pre-vented. Therefore, an appropriate outcome indicator of the effectiveness of such an intervention strategy is the cumulative total number of infections over the entire course of the epidemic, which we denote as the 'attack number'. This quantity is calculated numerically from computer simulation. To investigate various interventions of quarantining, we model the steady increase from no isolation to a maximum of p% of infectious people that are isolated after an average of τ3 days of symptoms and this level of quarantining is maintained after T days. That
is, , where t is the time from
the beginning of infectiousness of the first infected person (infectiousness could relate to the onset of symptoms, but not necessarily). Then, provided that p/τ3 > λ and this quarantine level is sustained, the epidemic will be eradi-cated.
There are three biological parameters that influence dis-ease dynamics: λ, τ1, and τ2 (of which λand τ2 are crucial for establishing the epidemic); and there are three inter-vention parameters crucial for eliminating the epidemic (p, τ3) and for reducing its epidemiological impact (T). In order to demonstrate this theoretical model and the tools of SaSAT we choose a hypothetical newly emergent dis-ease with an incubation period of τ1 ~ Γ (9,1/3) which specifies an average of 3 days and standard deviation of 1 day according to a Gamma distribution (Γ); an infectious period of τ2 ~ U(6,10) days (i.e., a uniform distribution over the interval 6–10 days); and a transmission rate of λ ~ N(0.4,0.1) new transmissions per day per infectious per-son (this is a Normal distribution with mean 0.4 and var-iance 0.1). This translates to an initial R0 prior to interventions of R0 ~ U(6,10) × N(0.4,0.1) (which has a mean of 3.2 and standard deviation of ~0.93). We also investigate a range of different intervention strategies: iso-lating (1) 50%, (2) 75%, or (3) 95% of infectious people after an average of (a) 1 day, (b) 2 days, or (c) 3 days of symptoms, and scaling up the intervention to reach the maximal attainable level after either (i) 1 month, (ii) 2
months, or (iii) 3 months. This leads to a total of 27 inter-vention strategies.
To simulate the epidemics, samples are required from each of the three biological parameters' distributions. SaSAT's 'Define Parameter Distribution Definitions' util-ity allows these distributions to be defined simply. Then, SaSAT's 'Generate Distribution Samples' utility provides the choice of random, Latin Hypercube, or full-factorial sampling. Of these, Latin Hypercube Sampling is the most efficient sampling method over the parameter space and we recommend this method for most models. We employed this method here, taking 1000 samples, using the defined parameter file. Independent of SaSAT, this set of 1000 parameter values was used to carry out numerical simulations of the time-courses of the epidemic, and in each case we commenced the epidemic by introducing one infectious person. This was then carried out for each of the 27 interventions (a total of 27,000 simulations). For each simulation the time to eradicate the epidemic and the attack number were recorded. These variables became the main outcome variables used for the sensitiv-ity analyses against the input parameters generated by the Latin Hypercube Sampling procedure.
A research paper that is specifically focused on a particular disease and the impact of different strategies would present various figures (like Figure 6, generated from SaSAT's 'Sensitivity Analysis Plots' utility) and discussion around their comparison. However, for the purposes of this paper in demonstrating SaSAT we chose just one strat-egy (namely, 2aiii: attaining isolation of 75% of infectious individuals 1 day after symptoms begin, after 3 months from the commencement of the epidemic). The cumula-tive distribution functions of the distributions of time to eradicate the epidemic and the attack number were pro-duced by SaSAT's 'Sensitivity Plots' utility and shown in Figs. 7a,b. The time until the epidemic was eradicated ranged from 28 to 583 days (99 median, IQR 81–126), and the total number of infections ranged from 2 to 501,263 (190 median, IQR 55–732). For the sake of illus-tration, if the goal of the intervention was to reduce the number of infections to less than 100, the importance of parameters in contributing to either less than, or greater than, 100 infections can be analysed with SaSAT by cate-gorising each parameter set as a dichotomous variable. Logistic regression and the Smirnov test were used, within SaSAT's 'Sensitivity Analysis' utility and the results are shown in Table 1. As far as we are aware these methodol-ogies have not previously been used to analyse the results of theoretical epidemic models. It is seen from Table 1 that λ(the infectivity rate) was the most important param-eter contributing to whether the goal was achieved or not, followed by τ2 (infectious period), and then τ1 (incuba-tion period). These results can be most clearly
demon-g t
t
t pt T t T
p t T
( )
=(
)
<Box plots comparing the 27 different strategies used in the example model, with the whisker length set at 1.5 multiplied by the inter-quartile range, and red '+' showing the outliers
Figure 6
Cumulative density functions of: (a) the total number of infections (log10); and (b) the number of days to clear the infection, for a single strategy (2aiii: isolating 75% of infectious people after 1 day of infectiousness and achieving this level of intervention after 3 months)
Figure 7
strated graphically by Kolmogorov-Smirnov CDF plots (Fig. 8).
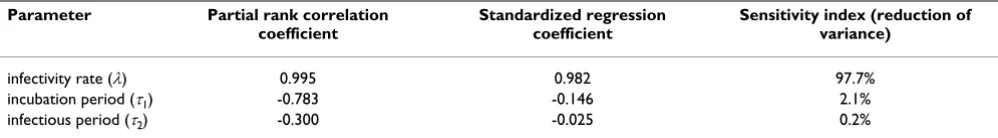
We investigated the existence of any non-monotonic rela-tionships between the attack number and each of the input parameters through SaSAT's 'Sensitivity Plots' utility (e.g. see Figure 9); no non-monotonic relationships were found, and a clear increasing trend was observed for the attack number versus λ, the infectivity rate. Then, it was determined which parameters most influenced the attack number and by how much. To conduct this analysis, SaSAT's 'Sensitivity Analyses' utility was used. The calcula-tion of PRCCs was conducted; these are useful for ranking the importance of parameter-output correlations. Another method that we implemented for ranking was the calcula-tion of standardized regression coefficients; the advantage of these coefficients is the ease of their interpretation in how a change in one parameter can be offset by an appro-priate change in another parameter. A third method for ranking the importance of parameters, not previously used in analysis of theoretical epidemic models as far as we are aware, is factor prioritization by reduction of vari-ance. These indicators of importance of parameters
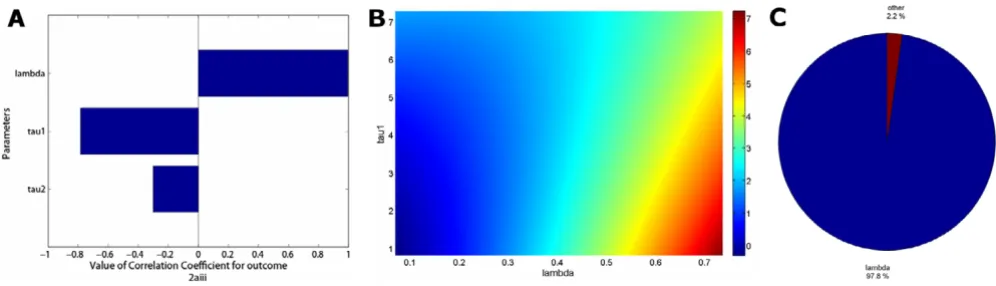
pro-vided consistent rankings, as shown in Table 2; we calculated these indices for linear, interaction, pure quad-ratic and full quadquad-ratic response hypersurfaces and they were all in very close agreement (all indices were equiva-lent to at least 2 decimal places for each statistical model and so we show results just for the full quadratic case (R2 = 0.997)). The rankings for all correlation coefficients can also be shown as a tornado plot (see Figure 10a).
The influence of combinations of parameters on outcome variables can be presented visually. Response surface methodology is a powerful approach for investigating the simultaneous influence of multiple parameters on an out-come variable by illustrating (i) how the outout-come variable will be affected by a change in parameter values; and (ii) how one parameter must change to offset a change in a second parameter. Figure 10b, from SaSAT's 'Sensitivity Plots' utility shows the pairings of the impact of infectivity rate (λ) and the incubation period (τ1) on the attack number. Factor prioritization by reduction of variance is a very useful and interpretable measure for sensitivity; it can be represented visually through a pie-chart for example (Fig. 10c).
Kolmogorov-Smirnov plots of each parameter displaying the CDFs with the greatest difference between parameter subsets contributing to a 'success' or 'failure' outcome for each parameter (see Table 1)
Figure 8
Kolmogorov-Smirnov plots of each parameter displaying the CDFs with the greatest difference between parameter subsets contributing to a 'success' or 'failure' outcome for each parameter (see Table 1): (a) λ, showing the largest maximum differ-ence between the two CDFs, (b) τ1, showing very little difference, and (c) τ2, showing little difference similar to τ1. In this example a 'success' is defined as the total number of infections less than 100 at the end of the epidemic.
Table 1: Results of dichotomous variable sensitivity analysis: listing of the most important parameters in determining whether or not less than 100 people are infected by the epidemic (as determined by logistic regression and the Kolmogorov-Smirnov test).
Parameter Logistic Regression (R2 = 0.95) Kolmogorov-Smirnov
infectivity rate (λ) p < 0.0001 odds > 108
p < 0.0001 maxd = 0.93 incubation period (τ1) p < 0.0001
odds 3.12 (2.34, 4.17)
p = 0.57 maxd = 0.05
infectious period (τ2) p = 0.04 odds 1.29 (1.01, 1.64)
Conclusion
In this paper we outlined the purpose and the importance of conducting rigorous uncertainty and sensitivity analy-ses in mathematical and computational modelling. We then presented SaSAT, a user-friendly software package for performing these analyses, and exemplified its use by investigating the impact of strategic interventions in the context of a simple theoretical model of an emergent epi-demic.
The various tools provided with SaSAT were used to deter-mine the importance of the three biological parameters (infectivity rate, incubation period and infectious period) in (i) determining whether or not less than 100 people will be infected during the epidemic, and (ii) contributing to the variability in the overall attack number. The various graphical options of SaSAT are demonstrated including: box plots to illustrate the results of the uncertainty analy-sis; scatter plots for assessing the relationships (including
monotonicity) of response variables with respect to input parameters; CDF and tornado plots; and response surfaces for illustrating the results of sensitivity analyses.
The results of the example analyses presented here are for a theoretical model and have no specific "real world" rel-evance. However, they do illustrate that even for a simple model of only three key parameters, the uncertainty and sensitivity analyses provide clear insights, which may not be intuitively obvious, regarding the relative importance of the parameters and the most effective intervention strategies.
We have highlighted the importance of uncertainty and sensitivity analyses and exemplified this with a relatively simple theoretical model and noted that such analyses are considerably more important for complex models; uncer-tainty and sensitivity analyses should be considered an essential element of the modelling process regardless of Scatter plots comparing the total number of infections (log10 scale) against each parameter
Figure 9
Scatter plots comparing the total number of infections (log10 scale) against each parameter: (a) τ1, shows some weak correla-tion, (b) τ2, shows little or no correlation, and (c) λ, showing a strong correlation (see Table 2 for correlation coefficients).
(a) Tornado plot of partial rank correlation coefficients, indicating the importance of each parameter's uncertainty in contrib-uting to the variability in the time to eradicate infection
Figure 10
the level of complexity or scientific discipline. Finally, while uncertainty and sensitivity analyses provide an effective means of assessing a model's "trustworthiness", their interpretation assumes model validity which must be determined separately. There are many approaches to model validation but a discussion of this is beyond the scope of the present paper. Here, with the provision of the easy-to-use SaSAT software, modelling practitioners should be enabled to carry out important uncertainty and sensitivity analyses much more extensively.
Appendix
SaSAT
Sampling and Sensitivity Analysis Tools.
Sampling
Selection of values from a statistical distribution defined with a probability density function for a range of possible values. For example, a parameter (α) may be defined to have a probability density function of a Normal distribu-tion with mean 10 and standard deviadistribu-tion 2. Sampling chooses N values from this distribution.
Mathematical/Theoretical/Computational Model
A set of mathematical equations that attempt to describe a system. Typically, the model system of equations is solved numerically with computer simulations. Mathe-matical models are different to statistical models, which are usually described as a set of probability distributions or equation to fit empirical data.
Input parameter/predictor/explanatory variable/factor
A constant or variable that must be supplied as input for a mathematical model to be able to generate output. For example, the diameter of a pipe would be an input param-eter in a model looking at the flow of water.
Outcome/Output/response variable
Data generated by the mathematical model in response to a set of supplied input parameters, usually relating to a specific aspect of the model, e.g., the amount of water flowing into a container from a pipe/s of a certain diame-ter.
Uncertainty Analysis
Method used to assess the variability (prediction impreci-sion) in the outcome variables of a model that is due to the uncertainty in estimating the input values.
Sensitivity Analysis
Method that extends uncertainty analysis by identifying which parameters are important in contributing to the prediction imprecision. It quantifies how changes in the values of input parameters alter the value of outcome var-iables. This allows input parameters to be ranked in order of importance, that is, the parameters that contribute the most to the variability in the outcome variable.
LHS
Latin Hypercube Sampling. This is an efficient method for sampling multi-dimensional parameter space to generate inputs for a mathematical model to generate outputs and conduct uncertainty analysis.
PRCC
Partial Rank Correlation Coefficient. A method of con-ducting sensitivity analysis.
Monotonic
A relationship or function which preserves a given trend; specifically, the relationship between two factors does not change direction. That is, as one factor increases the other factor either always increases or always decreases, but does not change from increasing to decreasing.
GUI
Graphical user interface.
Authors' contributions
AH wrote the graphics user interface code for SaSAT, developed the software package, wrote code for functions implemented in SaSAT, wrote the User Guide, performed analyses with the example model, produced all figures, and contributed to the Outline of Software section. DR and DW contributed to the overall conceptualisation and design of the project, developed code for the uncertainty and sensitivity algorithms. DR contributed to preparation of the manuscript. DW designed the example model, pre-pared the manuscript, and supervised the software design. Table 2: Results of sensitivity analysis: impact of the variability in the input variables in influencing variability in the attack number (total cumulative number of infected people), as determined by (i) partial rank correlation coefficients, (ii) standardized regression coefficients, and (iii) factor prioritization by reduction of variance.
Parameter Partial rank correlation
coefficient
Standardized regression coefficient
Sensitivity index (reduction of variance)
infectivity rate (λ) 0.995 0.982 97.7%
incubation period (τ1) -0.783 -0.146 2.1%
Additional material
Acknowledgements
The National Centre in HIV Epidemiology and Clinical Research is funded by the Australian Government Department of Health and Ageing and is affiliated with the Faculty of Medicine, University of New South Wales. DGR is supported by a National Health and Medical Research Council Capacity Building Grant in Population Health. DPW is supported by a Uni-versity of New South Wales Vice Chancellor's Research Fellowship and this project was supported by a grant from the Australian Research Council (DP0771620).
References
1. Iman RL, Helton JC: An Investigation of Uncertainty and Sensi-tivity Analysis Techniques for Computer Models. Risk Analysis
1988, 8(1):71-90.
2. Iman RL, Helton JC, Campbell JE: An Approach To Sensitivity Analysis Of Computer-Models. 1. Introduction, Input Varia-ble Selection And Preliminary VariaVaria-ble Assessment. Journal Of Quality Technology 1981, 13(3):174.
3. Iman RL, Helton JC, Campbell JE: An approach to sensitivity anal-ysis of computer-models. 2. Ranking of input variables, response-surface validation, distribution effect and tech-nique synopsis. Journal of Quality Technology 1981, 13(4):232. 4. Iman RL, Helton JC: An Investigation Of Uncertainty And
Sen-sitivity Analysis Techniques For Computer-Models. Risk Anal-ysis 1988, 8(1):71.
5. McKay MD, Beckman RJ, Conover WJ: A comparison of three methods for selecting values of input variables in the analysis of output from a computer code. Technometrics 2000, 42(1):55. 6. McKay MD, Beckman RJ, Conover WJ: Comparison of 3 methods for selecting values of input variables in the analysis of output from a computer code. Technometrics 1979, 21(2):239-245. 7. Wackerly DD, Medenhall W III, Scheaffer RL: Mathematical
Statis-tics with Applications. 6th edition. CA, USA.: Duxbury; 2002. 8. Saltelli A, Tarantola S, Campologno F, Ratto M: Sensitivity Analysis
in Practice: A Guide to Assessing Scientific Models. 1st edi-tion. Chichester, UK: John Wiley & Sons Ltd; 2004.
9. Blower SM, Dowlatabadi H: Sensitivity and uncertainty analysis of complex-models of disease transmission – an HIV model, as an example. International Statistical Review 1994, 62(2):229-243. 10. Stein M: Large sample properties of simulations using Latin
Hypercube Sampling. Technometrics 1987, 29:143-151. 11. Handcock MS: Latin Hypercube Sampling to Improve the
Effi-ciency of Monte Carlo Simulations: Theory and Implementa-tion in ASTAP, IBM Research Division, TJ Watson Research Center, RC 14546. 1989.
12. Saltelli A: Sensitivity Analysis for Importance Assessment. Risk Analysis 2002, 22(3):579-590.
13. DeVeaux RD, Velleman PF: Intro Stats. Pearson Education, Inc; 2004.
14. Iman RL, Conover WJ: Small Sample Sensitivity Analysis Tech-niques For Computer-Models, With An Application To Risk
Assessment. Communications In Statistics Part A-Theory And Methods
1980, 9(17):1749.
15. Blower SM, Hartel D, Dowlatabadi H, Anderson RM, May RM:
Drugs, sex and HIV: a mathematical model for New York City. Philos Trans R Soc Lond B Biol Sci 1991, 331(1260):171-187. 16. Blower SM, McLean AR, Porco TC, Small PM, Hopewell PC, Sanchez
MA, Moss AR: The intrinsic transmission dynamics of tubercu-losis epidemics. Nat Med 1995, 1(8):815-821.
17. Porco TC, Blower SM: Quantifying the intrinsic transmission dynamics of tuberculosis. Theor Popul Biol 1998, 54(2):117-132. 18. Sanchez MA, Blower SM: Uncertainty and sensitivity analysis of
the basic reproductive rate. Tuberculosis as an example. Am J Epidemiol 1997, 145(12):1127-1137.
19. Blower S, Ma L: Calculating the contribution of herpes simplex virus type 2 epidemics to increasing HIV incidence: treat-ment implications. Clin Infect Dis 2004, 39(Suppl 5):S240-247. 20. Blower S, Ma L, Farmer P, Koenig S: Predicting the impact of
antiretrovirals in resource-poor settings: preventing HIV infections whilst controlling drug resistance. Curr Drug Targets Infect Disord 2003, 3(4):345-353.
21. Blower SM, Chou T: Modeling the emergence of the 'hot zones': tuberculosis and the amplification dynamics of drug resistance. Nat Med 2004, 10(10):1111-1116.
22. Breban R, McGowan I, Topaz C, Schwartz EJ, Anton P, Blower S:
Modeling the potential impact of rectal microbicides to reduce HIV transmission in bathhouses. Mathematical Bio-sciences and Engineering 2006, 3(3):459-466.
23. Kleijnen JPC, Helton JC: Statistical analyses of scatterplots to identify important factors in large-scale simulations, 1: Review and comparison of techniques. Reliability Engineering & System Safety 1999, 65(2):147.
24. Seaholm SK: Software systems to control sensitivity studies of Monte Carlo simulation models. Comput Biomed Res 1988,
21(6):531-550.
25. Seaholm SK, Yang JJ, Ackerman E: Order of response surfaces for representation of a Monte Carlo epidemic model. Int J Biomed Comput 1988, 23(1–2):113-123.
26. Schroeder LD, Sqoquist DL, Stephan PE: Understanding regres-sion analysis. Sage Publications; 1986:31-32.
27. Turanyi T, Rabitz H: Local methods and their applications. In
Sensitivity Analysis Edited by: Saltelli A, Chan K, Scott M. New York: John Wiley; 2000.
28. Varma A, Morbidelli M, Wu H: Parametric Sensitivity in Chem-ical Systems. Cambridge: Cambridge Series in Chemical Engineer-ing; 1999.
29. Goldsmith CH: Sensitivity Analysis. In Encyclopedia of Biostatistics
Edited by: Armitage P. Colton T: John Wiley; 1998.
30. Campolongo F, Saltelli A, Jensen NR, Wilson J, Hjorth J: The Role of Multiphase Chemistry in the Oxidation of Dimethylsulphide (DMS). A Latitude Dependent Analysis. Journal of Atmospheric Chemistry 1999, 32:327-356.
31. Campolongo F, Tarantola S, Saltelli A: Tackling quantitatively large dimensionality problems. Computer Physics Communications
1999, 117:75-85.
32. Kioutsioukis I, Tarantola S, Saltelli A, Gatelli D: Uncertainty and global sensitivity analysis of road transport emission esti-mates. Atmospheric Environment 2004, 38:6609-6620.
33. Crosetto M, Tarantola S: Uncertainty and sensitivity analysis: tools for GIS-based model implementation. International Jour-nal of Geographic Information Science 2001, 15(4):415-437.
34. Pastorelli R, Tarantola S, Beghi MG, Bottani CE, Saltelli A: Design of surface Brillouin scattering experiments by sensitivity analy-sis. Surface Science 2000, 468:37-50.
35. Saltelli A, Ratto M, Tarantola S, Campolongo F: Sensitivity analysis practices: Strategies for model-based inference. Reliability Engineering & System Safety 2006, 91:1109-1125.
36. Saltelli A, Tarantola S: On the relative importance of input fac-tors in mathematical models: Safety assessment for nuclear waste disposal. Journal of the American Statistical Association 2002,
97(459):702-709.
37. Tabachnick B, Fidell L: Using Multivariate Statistics (Third Edi-tion). Harper Collins; 1996.
38. McCullagh P, Nelder JA: Generalized Linear Models (2nd Edi-tion). Chapman & Hall/CRC Press; 1990.
Additional file 1
Download SaSAT. Information for downloading SaSAT software.
Click here for file
[http://www.biomedcentral.com/content/supplementary/1742-4682-5-4-S1.pdf]
Additional file 2
User guide. User guide for SaSAT software package.
Click here for file
Publish with BioMed Central and every scientist can read your work free of charge "BioMed Central will be the most significant development for disseminating the results of biomedical researc h in our lifetime."
Sir Paul Nurse, Cancer Research UK
Your research papers will be:
available free of charge to the entire biomedical community
peer reviewed and published immediately upon acceptance
cited in PubMed and archived on PubMed Central
yours — you keep the copyright
Submit your manuscript here:
http://www.biomedcentral.com/info/publishing_adv.asp
BioMedcentral 39. Bender R, Grouven U: Ordinal logistic regression in medical
research. Journal of the Royal College of Physicians of London 1997,
31(5):546-551.
40. Hall GH, Round AP: Logistic regression – explanation and use. Journal of the Royal College of Physicians of London 1994, 28(3):242-246. 41. Hosmer D, Lemeshow S: Applied Logistic Regression. 2nd
edi-tion. New York: John Wiley and Sons, Inc; 2000.
42. Menard S: Applied logistic regression analysis (2nd Edition).
Thousand Oaks, CA: Sage Publications; 2002:23.
43. Hornberger GM, Spear RC: An approach to the preliminary analysis of environmental systems. Journal of Environmental man-agement 1981, 12:7-18.
44. Conover WJ: Practical nonparametric statistics. New York: John Wiley; 1971.
45. Massey FJ: The Kolmogorov-Smirnov Test for Goodness of Fit. Journal of the American Statistical Association 1951, 46:68-77. 46. Conover WJ: Practical Nonparametric Statistics (3rd edition).
New York: Wiley; 1999.
47. Nikiforov AM, Algorithm AS: Exact Smirnov two-sample tests for arbitrary distributions. Applied Statistics 1994, 43:265-284. 48. Kim PJ, Jennrich RI: Tables of the exact sampling distribution of
the two-sample Kolmogorov-Smirnov criterion. In Selected Tables in Mathematical StatisticsVolume 1. Providence: American Math-ematical Society; 1973.
49. Brauer F, Castillo-Chavez C: Mathematical Models in Population Biology and Epidemiology. New York: Springer-Verlag; 2001. 50. Anderson RM, May RM: Infectious Diseases of Humans. Oxford: