Open Access
Research
RNAstrand: reading direction of structured RNAs in multiple
sequence alignments
Kristin Reiche*
1and Peter F Stadler
1,2,3Address: 1Bioinformatics Group, Dept. of Computer Science, and Interdisciplinary Center for Bioinformatics, University of Leipzig, Härtelstraße 16-18, D-04107 Leipzig, Germany, 2Institute for Theoretical Chemistry, University of Vienna, Währingerstraße 17, A-1090 Wien, Austria and 3Santa Fe Institute, 1399 Hyde Park Rd., Santa Fe, NM 87501, USA
Email: Kristin Reiche* - [email protected]; Peter F Stadler - [email protected] * Corresponding author
Abstract
Motivation: Genome-wide screens for structured ncRNA genes in mammals, urochordates, and nematodes have predicted thousands of putative ncRNA genes and other structured RNA motifs. A prerequisite for their functional annotation is to determine the reading direction with high precision.
Results: While folding energies of an RNA and its reverse complement are similar, the differences are sufficient at least in conjunction with substitution patterns to discriminate between structured RNAs and their complements. We present here a support vector machine that reliably classifies the reading direction of a structured RNA from a multiple sequence alignment and provides a considerable improvement in classification accuracy over previous approaches.
Software: RNAstrand is freely available as a stand-alone tool from http://www.bioinf.uni-leipzig.de/Software/RNAstrand and is also included in the latest release of RNAz, a part of the Vienna RNA Package.
Introduction
Genome wide computational screens for structured ncRNA genes in mammals [1-3], urochordates [4], nema-todes [5], and drosophilids [6] resulted in tens of thou-sands putative structured ncRNAs. Functional and structural annotation of these predictions thus becomes a pressing problem. Evidence for evolutionary conservation of RNA structure alone usually does not distinguish very well between the two possible reading directions. This information, however, is crucial already for the most basic annotation information. Direction information is needed e.g. to determine whether a conserved RNA motif is intronic, located within a coding sequence or an
untrans-lated exon, an independent ncRNA, or one of the many classes of small RNAs associated with other transcripts [7].
The RNAstrand tool is designed specifically to predict the
reading direction of a multiple sequence alignment under
the assumption that the alignment contains an evolution-ary conserved RNA secondevolution-ary structure. Our task at hand is a conceptually simple two class prediction problem for which we employ a support vector machine (SVM) [8]. The basic idea is to devise descriptors that utilize both the small asymmetry in the energy rules [9] and the asymmet-ric effect of GU base pairs.
Published: 31 May 2007
Algorithms for Molecular Biology 2007, 2:6 doi:10.1186/1748-7188-2-6
Received: 12 April 2007 Accepted: 31 May 2007
This article is available from: http://www.almob.org/content/2/1/6
© 2007 Reiche and Stadler; licensee BioMed Central Ltd.
1 Methods
1.1 Selection of descriptors
Small differences in the measured folding energies between an RNA molecule and its reverse complement are captured by corresponding small asymmetries in the standard energy model used by thermodynamic folding algorithms [9,10]. These differences distinguish the two reading directions even in the absence of GU pairs. In addition, GU pairs have an asymmetric effect in multiple sequence alignments: Suppose a particular pair of
align-ment columns exhibits a GC → GU substitution in one
reading direction; this preserves base pairing and hence is consistent with a conserved structure. The reverse
comple-ment of the same aligncomple-ment, however, displays a GC →
AC substitution which is inconsistent with a conserved base pair. The patterns of structure conservation, and hence the consensus structure and its associated average folding energy, as computed by the RNAalifold algorithm [11], thus differ between the reading directions. In
con-trast, compensatory mutations, such as GC → AU do not
provide strand-specific information.
The effects of both the asymmetries of the energy rules and of the GU base pairs are conveniently captured in terms of thermodynamic quantities, more precisely, in terms of the folding energies of the consensus structure and the individual folding energies of a set of aligned RNAs. These parameters can be computed much more reliably than quantities that have to be derived from pre-dicted base pairs due to the limited accuracy of the struc-ture prediction algorithms on individual sequences [12]. We avoid the use of sequence motifs (e.g. [13]), since this bears the danger that the SVM is biased to the ncRNA fam-ilies in the training set and fails to distinguish plus and minus strands of other structured ncRNAs.
Here we use:
1) Average of the folding energies of the individual sequences contained in the alignment, computed by the minimum energy folding program RNAfold of the Vienna
RNA Package, version 1.6 [14] (meanmfe).
2) Mean of the energy z-scores of the individual sequences
contained in the alignment (meanz). The z-score is
defined as z = (E - )/σ, where and σare mean and
standard deviation of the folding energy distribution of shuffled (permuted) sequences. We use here the same
SVM-regression procedure as RNAz [15] to estimate the z
-scores from the sequence composition to avoid the time consuming sampling of shuffled alignments.
3) Folding energy of the consensus secondary structure of
the alignment computed by RNAalifold (consmfe). The
parameter is defined as the optimal average of the folding energies that can be achieved when all aligned sequences simultaneously fold into the same structure.
4) Structure conservation index (sci), which is defined as
the ratio of the consensus folding energy and the average
of the folding energies of the individual sequences, i.e. sci
= consmfe/meanmfe, [15]. An sci close to 1 indicates perfect structure conservation, while alignments without struc-tural conservation yield values close to 0. A more detailed
discussion of the sci can be found in [16] in the context of
RNA alignment.
The first two descriptors assess the thermodynamic stabil-ity of the folds, while the last two evaluate structural con-servation.
The reading direction of a structured ncRNA can be
iden-tified by evaluating the differences of the above descriptors
between both strands. To be precise, the difference ∆x of
descriptor x is defined as ∆x = x+ - x-, where x+ denotes the
value of x in reading direction of the input alignment and
x- the value of x in the reverse complementary alignment.
Hence, ∆meanmfe and ∆meanz capture the energetic
differ-ences between both strands, while ∆consmfe and ∆sci
describe the differences in structure conservation.
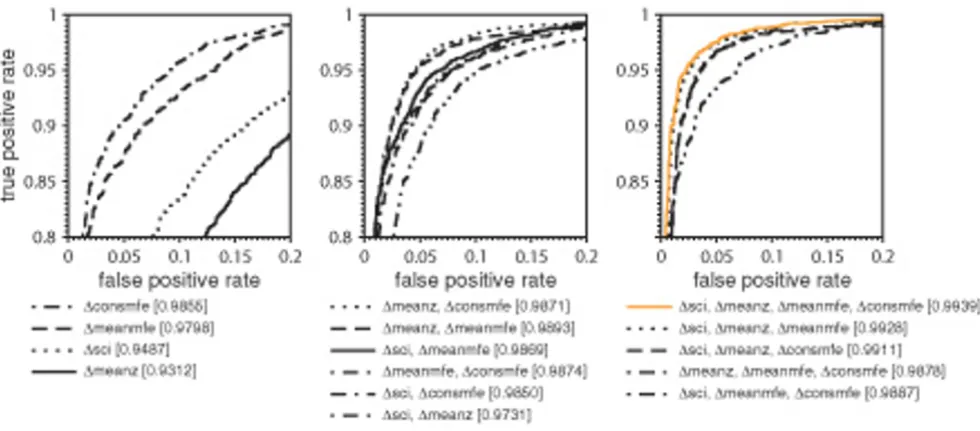
The proportion of true positive and false positive rate (ROC curve) for each combination of descriptors is sum-marized in Fig. 1. It reveals which combination of descrip-tors achieves optimal classification of the alignments. The ROC curves can be evaluated by the area under the curve
(AUC), which states the similarity of the ROC curve to a
step function. The steeper the true positive rate increases while staying at its maximum value for different values of false positive rates, the better the input alignments can be
separated. The best AUC of 99% is achieved when all four
descriptors are taken.
Note, that although sci = consmfe/meanmfe, i.e., these three
quantities are not independent, this is not the case for
their differences. ∆sci cannot be computed from ∆consmfe
and ∆meanmfe. Furthermore, for alignments where the structural conservation is very high in both reading
direc-tions the strand of the ncRNA cannot be inferred by ∆sci
alone. But the difference of consensus structure stability,
which is measured by ∆consmfe may still predict the strand
correctly.
Same holds for ∆meanz and ∆meanmfe. Both measure the
folding energy differences of the individual sequences, but do not capture identical features of the input alignment
nor can be transformed into each other. The mean z-score
compares the average stability of individual sequences to a random control set. Whereas the mean of minimum free
energies of individual sequences specifies the actual
observed minimum free energies. The difference in z
-scores describes the relative loss of stability compared to a random control set. It quantifies that the input alignment swaps from very stable to unstable between both strands. The difference in minimum free energy, on the other hand, is able to specify small changes in energies, which is needed to find the correct reading direction of the ncRNA in case both reading directions result in very stable struc-tures. An example are miRNAs, which are very stable on both strands but are nevertheless successfully classified by RNAstrand. Hence, all four descriptors carry different information.
The significance of differences in folding energies depends on the number of sequences in the input alignment,
denoted by n, and on sequence variation. The latter is
con-veniently quantified as the average pairwise sequence
identity H of both reading directions.
The strongest strand information comes from GU base pairs which are unpaired in the reverse complementary alignment. Hence, the relevance of differences depends also on the overall number of GU base pairs in the con-sensus structure. Therefore, we introduce
as last descriptor. denotes the number of GU
base pairs in the consensus secondary structure of the reading direction of the input alignment (reverse
comple-ment of the input aligncomple-ment), and and are the
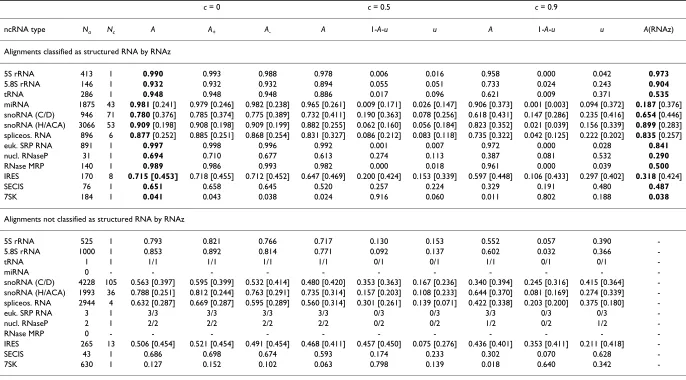
numbers of all base pairs in the consensus structure of the corresponding reading direction. Fig. 2 shows that align-ments in the reading direction of a tRNA can not as easy be separated from the reverse complementary alignments
by evaluating only ∆meanmfe, ∆meanz, ∆consmfe and ∆sci
as it is the case for alignments containing U70 snoRNAs. The majority of tRNAs have around 0–5% GU base pairs in their consensus secondary structure. (The percentage of
GU pairs is roughly λGU/2.) In contrast, the majority of
U70 snoRNAs have 10% to 20% GU base pairs in their
consensus structure. λGU allows the SVM to find suitable
classification values depending on the fraction of GU base pairs. Therefore, U70 snoRNAs as well as tRNAs are classi-fied correctly with high accuracies (U70: 1.0, tRNA: 0.94).
We regard GU base pair fraction rather of the consensus structure than of the predicted structures of the single sequences, as the structure prediction of RNAalifold is based on evolutionary information of a set of sequences and hence produces a fold more similar to the real struc-ture than RNAfold is able to predict from one single
λGU GU
all GU
all
n
n n
n
=( ++ + −− )×100,
nGU+ (nGU− )
nall+ nall− Receiver operating characteristic of all descriptor combinations
Figure 1
sequence. We did not introduce the difference of GU base pairs as a descriptor, because the error rate of such an descriptor depends largely on the correctness of the dicted secondary structure. Small errors in structure pre-diction have a large impact on the difference of GU base pairs. In contrast, the difference in structure stability and conservation regards all base pairs and hence depends only very weakly on the correctness of individual base pairs.
In summary, the SVM classification is based on seven
descriptors, of which four, ∆meanmfe, ∆meanz, ∆consmfe
and ∆sci directly measure differences between the reading
directions, while the remaining three, n, H, and λGU
pro-vide information on the structure of the input alignment
that allow the SVM to interpret the significance of strand differences.
1.2 Training of Support Vector Machine
Alignments for training were taken from the same sources as in [15] including representatives for rRNAs, spliceo-somal RNAs, tRNAs, miRNAs, small nucleolar RNAs, nuclear RNaseP and SRP RNA. Sequence similarity in this data set ranges from 47% to 99% mean pairwise identity in alignments of 40 nt to 400 nt length and of 2 to 6 sequences. The detailed distributions of mean pairwise identity, length, number of sequences and GU base pair content are given in the supplementary material (see Additional file 1). A total of 5886 ClustalW alignments, approximately equally representing these ncRNA families, were used for training after removing alignments that were not recognized as structured RNA by RNAz in both reading directions. This data set was splitted into two sub-sets of equal size, namely the positive and negative train-ing set. Alignments in the negative traintrain-ing set were transformed to the reverse complement and realigned with ClustalW as opposed to take just the reverse comple-mentary alignment of the structured RNA.
The number of sequences a training alignment contains is limited to 6 as the SVM regression procedure to estimate
the z-scores is trained with alignments of maximal 6
sequences [15]. In case an alignment has more than 6 sequences a subalignment with optimal mean pairwise identity may be chosen with the perl script rnazWin-dow.pl [17] of the RNAz package.
We use libsvm 2.8 [18] with SVM type C_SVC, a radial basis function (RBF) kernel, probability estimates and descriptor vectors scaled linearly to the interval [-1, +1]. The scaling avoids that descriptors which have a large var-iance dominate the classification. The values for the RBF
kernel parameters γand C were identified by a grid search
in the parameter space applying grid.py of the libsvm 2.8 package with a 5-fold cross-validation on the training data. Maximal prediction accuracy is achieved with
parameters C = 128 and γ= 0.5.
The SVM returns an estimated class probability p, that the
ncRNA is found in the reading direction of the input
alignment. We convert p into a score D = 2p - 1, so that D
≈ +1 means "RNA in reading direction of input
align-ment" while D ≈ -1 means "RNA is reverse complement of
input alignment".
2 Results
2.1 Testing the classifier
Classification performance is evaluated using 30920 auto-matically generated ClustalW alignments of 313 of the 503 ncRNA families from RFAM (version 7.0). All GU base pair dependency
Figure 2
GU base pair dependency. Scatter plots depicting separa-bility between both strands depending on GU base pair con-tent (histograms). Red data points denote alignments in the reading direction of the ncRNA, while black data points belong to their realigned reverse complements. Alignments of tRNAs and U70 snoRNAs do not have significantly differ-ent number of sequences nor differ significantly in mean pair-wise identity (see Additional file 1). That alignments in reading direction of U70 snoRNA are well separated from their reverse complements compared to alignments contain-ing tRNAs is due to high content of GU base pairs in the sec-ondary structure of U70 snoRNAs.
0 10 20 30 40 50 λGU 0
0.01 0.02 0.03 0.04 0.05 0.06 -0.4 -0.2 0 0.2 0.4 -30
-20 -10 0 10 20 30
∆
consmfe
tRNA (RF00005)
-0.4 -0.2 0 0.2 0.4 ∆sci -30
-20 -10 0 10 20 30
U70 snoRNA (RF00156)
-3 -2 -1 0 1 2 3 -20
-10 0 10 20
∆
meanmfe
-3 -2 -1 0 1 2 3 ∆meanz -20
-10 0 10 20
0 10 20 30 40 50 0
0.1 0.2 0.3 0.4
sequences attending at the training alignments were excluded from the test set. For each family at most 500 ClustalW alignments were randomly constructed each for 2 to 6 sequences, resulting in maximal 2500 alignments for a family. Since the alignments which were taken to train the SVM are no longer than 400 nt, have a minimal pairwise sequence identity of 60% and contain maximal six sequences, test alignments were created which meet the same criteria. For alignments which do not fall into those ranges probability estimates of the SVM need to be regarded with certainty. 8 families had no alignments between 40 and 400 nt and were hence discarded from the test set. 67 families are not included because they consist of only one or two sequences. 2 families had no sampled alignments with a mean pairwise sequence identity larger than 60%. Lastly, the sampled alignments of 113 families were not recognized as ncRNA by RNAz on at least one reading direction and were also discarded from the test data set. A list of families excluded from the test data can be found in the supplementary material (see Additional file 1). All alignments in the test set were used as positive test cases and their realigned reverse complements as neg-ative test cases.
Table 1 lists the classification rates for different threshold
values c, i.e., classifying the RNA as "plus strand" for D > c
and as "minus strand" for D < -c, while -c ≤D ≤c is
inter-preted as "undecided". We observe only a negligible loss
of accuracy when c is increased from 0 to 0.9. The
distri-bution of D (see Additional file 1) demonstrates that the
majority of alignments are classified correctly with high probability. However, RNAstrand fails to predict the cor-rect reading dicor-rection of 53 families (e.g. 7SK). The pre-dicted secondary structure of the reverse complementary alignment is much more stable for these examples than the ncRNA itself (see Additional file 1). On the other hand, RNAstrand is able to reliably capture the reading direction of most ncRNAs for which no representative was given in the training set, including RNase MRP, IRES, SECIS and 5.8S rRNA, which makes it suitable to predict the reading direction of novel ncRNA families.
To evaluate the performance of RNAstrand on alignments which have not been identified as structured RNA by RNAz, we constructed a second test set which only con-sists of alignments not classified as structured RNA by RNAz in both reading directions. This resulted in 207 families meeting the criteria described in the first para-graph of this section. The corresponding distributions are shown in the supplementary material (see Additional file 1). For those alignments a dramatic decrease of structure stability and conservation is observed which leads to smaller descriptor values (see Additional file 1). Hence, the classification performance is worse compared to RNAz-positive alignments (Table 1). However, for the
majority of alignments the correct reading direction was inferred.
Performance measures depending on the number of sequences in the input alignment, the length as well as the mean pairwise identity of the sequences are given in Table 2. The number of sequences of an alignment does not influence prediction performance significantly. But the more the sequences are conserved the better the overall classification accuracy. The fraction of correctly classified alignments is also very high in case of long sequences. For alignments of 100 to 200 nt length the accuracy is biased to miRNAs, which are well classified by RNAstrand.
The results highlight that our classification task has an intrinsic symmetry: the fraction of correctly classified alignments for the "plus strand" of a ncRNA should be similar to the accuracy of the "minus strand". However, we observe a small but noticeable bias to predict that the ncRNA lies in same reading direction as the input align-ment (Table 1). The SVM model was trained with different alignments in the positive and negative training sets, which results in an asymmetric model. If the same align-ments, but in different directions, were taken for training, the SVM model would be exactly symmetric. But training data should be independent in the different classes, hence we refrained from enforcing this exact symmetry to avoid potential overtraining artifacts. Another possibility to avoid asymmetry would be to take the averaged SVM sion values of both reading directions as the final deci-sion. But this has an unknown effect on the probability estimates.
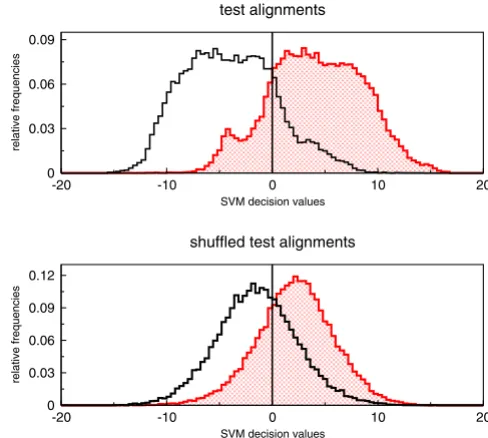
The distribution of decision values of the SVM is shown in Fig. 3. The majority of alignments were classified correctly. Most of them have large absolute decision values stating that they belong to the corresponding class with high probability. If RNAstrand is applied to shuffled align-ments the decision values are more concentrated around 0, but most of them are still classified correctly. To explain this observation we checked which combination of descriptors performs best on shuffled alignments. We trained a SVM model for each possible descriptor combi-nation and calculated the true and false positive rates at different decision levels by using plotroc.py of the libsvm 2.8 package [18]. The corresponding ROC curves are given
in Fig. 4 and indicate that except of ∆meanmfe all
descrip-tors classify shuffled alignments randomly. Individual shuffled sequences, presumably by virtue of their base composition (see Additional file 1), still contain informa-tion on the reading direcinforma-tion of the structured RNA which
is captured by ∆meanmfe. This observation implies that
Algorithms for Molecular Biology
20
07,
2
:6
ht
tp://
www.
a
lmob.or
g/conten Pa
ge 6 of
(page number not for citation purposes)
ncRNA type Na Nc A A+ A- A 1-A-u u A 1-A-u u A(RNAz)
Alignments classified as structured RNA by RNAz
5S rRNA 413 1 0.990 0.993 0.988 0.978 0.006 0.016 0.958 0.000 0.042 0.973
5.8S rRNA 146 1 0.932 0.932 0.932 0.894 0.055 0.051 0.733 0.024 0.243 0.904
tRNA 286 1 0.948 0.948 0.948 0.886 0.017 0.096 0.621 0.009 0.371 0.535
miRNA 1875 43 0.981 [0.241] 0.979 [0.246] 0.982 [0.238] 0.965 [0.261] 0.009 [0.171] 0.026 [0.147] 0.906 [0.373] 0.001 [0.003] 0.094 [0.372] 0.187 [0.376] snoRNA (C/D) 946 71 0.780 [0.376] 0.785 [0.374] 0.775 [0.389] 0.732 [0.411] 0.190 [0.363] 0.078 [0.256] 0.618 [0.431] 0.147 [0.286] 0.235 [0.416] 0.654 [0.446] snoRNA (H/ACA) 3066 53 0.909 [0.198] 0.908 [0.198] 0.909 [0.199] 0.882 [0.255] 0.062 [0.160] 0.056 [0.184] 0.823 [0.352] 0.021 [0.039] 0.156 [0.339] 0.899 [0.283] spliceos. RNA 896 6 0.877 [0.252] 0.885 [0.251] 0.868 [0.254] 0.831 [0.327] 0.086 [0.212] 0.083 [0.118] 0.735 [0.322] 0.042 [0.125] 0.222 [0.202] 0.835 [0.257]
euk. SRP RNA 891 1 0.997 0.998 0.996 0.992 0.001 0.007 0.972 0.000 0.028 0.841
nucl. RNaseP 31 1 0.694 0.710 0.677 0.613 0.274 0.113 0.387 0.081 0.532 0.290
RNase MRP 140 1 0.989 0.986 0.993 0.982 0.000 0.018 0.961 0.000 0.039 0.500
IRES 170 8 0.715 [0.453] 0.718 [0.455] 0.712 [0.452] 0.647 [0.469] 0.200 [0.424] 0.153 [0.339] 0.597 [0.448] 0.106 [0.433] 0.297 [0.402] 0.318 [0.424]
SECIS 76 1 0.651 0.658 0.645 0.520 0.257 0.224 0.329 0.191 0.480 0.487
7SK 184 1 0.041 0.043 0.038 0.024 0.916 0.060 0.011 0.802 0.188 0.038
Alignments not classified as structured RNA by RNAz
5S rRNA 525 1 0.793 0.821 0.766 0.717 0.130 0.153 0.552 0.057 0.390
-5.8S rRNA 1000 1 0.853 0.892 0.814 0.771 0.092 0.137 0.602 0.032 0.366
-tRNA 1 1 1/1 1/1 1/1 1/1 0/1 0/1 1/1 0/1 0/1
-miRNA 0 - - -
-snoRNA (C/D) 4228 105 0.563 [0.397] 0.595 [0.399] 0.532 [0.414] 0.480 [0.420] 0.353 [0.363] 0.167 [0.236] 0.340 [0.394] 0.245 [0.316] 0.415 [0.364] -snoRNA (H/ACA) 1993 36 0.788 [0.251] 0.812 [0.244] 0.763 [0.291] 0.735 [0.314] 0.157 [0.203] 0.108 [0.233] 0.644 [0.370] 0.081 [0.169] 0.274 [0.339] -spliceos. RNA 2944 4 0.632 [0.287] 0.669 [0.287] 0.595 [0.289] 0.560 [0.314] 0.301 [0.261] 0.139 [0.071] 0.422 [0.338] 0.203 [0.200] 0.375 [0.180]
-euk. SRP RNA 3 1 3/3 3/3 3/3 3/3 0/3 0/3 3/3 0/3 0/3
-nucl. RNaseP 2 1 2/2 2/2 2/2 2/2 0/2 0/2 1/2 0/2 1/2
-RNase MRP 0 - - -
-IRES 265 13 0.506 [0.454] 0.521 [0.454] 0.491 [0.454] 0.468 [0.411] 0.457 [0.450] 0.075 [0.276] 0.436 [0.401] 0.353 [0.411] 0.211 [0.418]
-SECIS 43 1 0.686 0.698 0.674 0.593 0.174 0.233 0.302 0.070 0.628
-7SK 630 1 0.127 0.152 0.102 0.063 0.798 0.139 0.018 0.640 0.342
returned a preferred reading direction for a non-structured
input alignment. We could have also removed ∆meanmfe
from the set of descriptors, because of this bias. However, due to its high sensitivity (Fig. 1) it seems preferable to keep it as descriptor, in particular since RNAstrand is designed to operate on structured RNAs only.
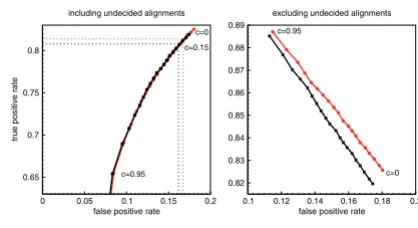
The best cutoff c can be found by plotting false positive
rates versus true positive rates at different c (Fig. 5). If
Youden's index Y, i.e., true positive rate minus false
posi-tive rate, is maximal, then the classification accuracy can-not be further improved by taking a larger cutoff [19]. We
observe Ymax ≈ 0.644 for c ≤ 0.15. Hence, a further increase
of c leads to a worse proportion of correctly and falsely
classified alignments. However, a large value of c assures
that the predicted reading direction is with high probabil-ity the correct reading direction, see Table 1 and the r.h.s. of Fig. 5.
2.2 Comparison to naïve approaches
A naïve way to determine the likely reading direction is to score an alignment and its reverse complement using RNAz, EvoFold, or another tool for recognizing structured RNAs. This approach was taken e.g. in [1,2,4,5]. A manual inspection of the data, however, showed that this approach is problematic in particular in those cases where RNAz scores are high for both reading directions. This is
the case in particular for microRNA precursors, but also for many other small house-keeping ncRNAs.
Table 1 gives the accuracy of RNAstrand compared to this simple approach, i.e., taking the strand with the larger RNAz probability. RNAstrand yields for all ncRNA types an improvement. The largest increase of classification accuracy is observed for miRNAs, RNase MRP, tRNAs, nuclear RNaseP and IRES. Table 3 shows that the reading direction is classified correctly in the majority of test align-ments by RNAstrand. The misclassification rate of the naïve approach is two times higher than that of RNAs-trand.
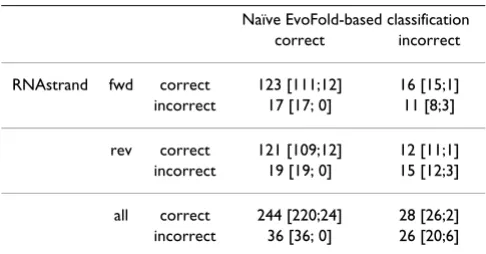
Finally, we compared the prediction accuracy of RNAs-trand with the sRNAs-trand prediction of EvoFold. Applying EvoFold to automatically created RNA alignments extracted from Rfam families is not easily feasible since EvoFold requires a meaningful phylogenetic tree (ideally estimated from neutrally evolving sites) as input. Such data are not available and cannot be generated easily for most combinations of Rfam sequences. The heuristic sug-Histogram of SVM decision values
Figure 3
Histogram of SVM decision values. Distribution of SVM decision values of RNAz-positive alignments. The upper his-togram belongs to all alignments of the test set. Whereas the lower one shows the distribution of the decision values for shuffled alignments. Columns of the test alignments were randomly permuted to create shuffled alignments. Red dot-ted bins denote alignments where the ncRNA has the same reading direction as the alignment. Black bins belong to align-ments where the ncRNA is contained in the reverse comple-ment. Note that the shuffling procedure does not completely destroy the direction information.
-20 -10 0 10 20
SVM decision values
0 0.03 0.06 0.09
relative frequencies
test alignments
-20 -10 0 10 20
SVM decision values
0 0.03 0.06 0.09 0.12
relative frequencies
shuffled test alignments Table 2: Accuracies depending on different alignment features.
c = 0
alignment feature N A A+ A
-NS = 2 4487 0.824 0.829 0.819
NS = 3 5311 0.833 0.830 0.837
NS = 4 6388 0.828 0.830 0.827
NS = 5 7234 0.797 0.805 0.789
NS = 6 7500 0.832 0.835 0.829
50 ≤ sequence identity < 70 13187 0.799 0.799 0.799 70 ≤ sequence identity < 80 12152 0.827 0.832 0.823 80 ≤ sequence identity < 90 5550 0.865 0.871 0.859 90 ≤ sequence identity < 100 31 0.903 0.871 0.935
40 ≤ length ≤ 100 11191 0.768 0.773 0.763
101 ≤ length ≤ 200 14180 0.853 0.856 0.851
201 ≤ length ≤ 300 1697 0.637 0.641 0.634
301 ≤ length ≤ 400 3852 0.945 0.945 0.945
all alignments 30920 0.822 0.825 0.819
Performance of RNAstrand depending on various alignment features, i.e. number of sequences (NS), sequence identity and alignment length. N : number of alignments in the test sets, A: accuracy, which is defined as the fraction of correctly classified input alignments, A+: accuracy of alignments in reading direction of ncRNA, A-: accuracy of reverse
gested in [2], namely to rescale a neighbor-joining tree generated from the input alignment, produced very poor classification results in most cases.
Hence, we use instead the subset of known ncRNAs among the 48479 EvoFold predictions in human assem-bly hg17 [2].
A blast search with E < 1e - 10 against NonCode [20],
Rfam [21], mirBase [22] and snoRNA-LBME-db [23] iden-tified only 248 unique known ncRNA loci in human. (Note, that tRNAs and most snRNAs are multi-copy genes and hence were deliberately excluded from the data in [2]). To compare strand predictions of EvoFold with RNAstrand the multiz8way alignments of 202 loci, which are completely covered by a blast hit, were reconstructed. The majority (177) were identified to be miRNA precur-sors as most of the EvoFold predictions in ref. [2] are short conserved hairpins. The direction of the blast hit indi-rectly determines the strand of the known ncRNA when it is compared to the strand prediction of EvoFold. For 14 (13 miRNAs and 1 U6atac) loci the multiple alignments could not be reconstructed. The remaining 188 align-ments were realigned and all which did not meet the pre-requisites of RNAstrand were discarded: 15 alignments were shorter than the minimum length for which RNAs-trand was trained with, 5 alignments had a mean pairwise identity smaller than 50%, and one alignment contained of too many gaps. This leaves 167 alignments for which the strand prediction of RNAstrand is compared to the strand prediction of EvoFold. Alignments containing
more than 6 sequences were reduced to 6 sequences by rnazWindow.pl which optimizes the final alignment for a mean pairwise identity.
The numbers in Table 4 show that the strand prediction of EvoFold is comparable to the strand prediction of RNAs-trand on this relative small test set, which is, however, dominated by microRNAs. We remark that EvoFold and RNAz are sensitive for ncRNAs of different base composi-tions and sequence similarities [3,24], so that neither of these programs can be (ab)used as universal strand-strand classificators.
Receiver operating characteristic of test alignments Figure 5
Receiver operating characteristic of test alignments. False positive rates of RNAz-positive test alignments versus true positive rates at different cutoff levels c. The left plot depicts rates in case undecided alignments are included in the calculation. Meaning that the true positive rate is defined as
, where tp denotes alignments which have been
correctly classified to contain the ncRNA in the same reading direction as the input alignment. fn is the number of align-ments which have been falsely classified to contain the ncRNA on the reverse complement, while u contains all alignments which contain the ncRNA in the same reading direction but RNAstrand were not able to predict a reading direction. False positive rate is defined respectively. The right handed plot discards unclassified alignments. Hence, the true
positive rate is defined as and the false positive rate
as . The curves for both SVM decision classes are
given. Red curves denote alignments containing the ncRNA in the reading direction of the input alignment. Black curves belong to alignments which contain the ncRNA on the reverse complementary strand. The values of c range from 0 to 0.95 in steps of 0.05.
0 0.05 0.1 0.15 0.2 false positive rate 0.65
0.7 0.75 0.8
true positive rate
including undecided alignments
0.1 0.12 0.14 0.16 0.18 0.2 false positive rate 0.82 0.83 0.84 0.85 0.86 0.87 0.88 0.89
excluding undecided alignments
c=0 c=0.95 c=0.95 c=0 c=0.15 tp tp+fn+u
tp tp+ fn
fp fp tn+ Receiver operating characteristic of all descriptor
combina-tions for shuffled alignments Figure 4
Receiver operating characteristic of all descriptor combinations for shuffled alignments. ROC curves of all descriptor combinations for shuffled alignments. Columns of test alignments were randomly permuted to create shuf-fled alignments. Corresponding AUC is given in brackets. ROC curves were computed by training a SVM model for each descriptor combination and testing the model on shuf-fled alignments by utilizing plotroc.py of the libsvm 2.8 pack-age [18]. Training was done with the original training set for RNAstrand. SVM parameter and kernel did not change, i.e. a radial basis function kernel with parameters C = 128 and γ= 0.5 were used.
0 0.2 0.4 0.6 0.8 1 false positive rate 1
∆sci, ∆meanz, ∆meanmfe, ∆consmfe [0.8257]
∆sci, ∆meanz, ∆meanmfe [0.8280]
∆meanz, ∆meanmfe, ∆consmfe [0.8200]
∆sci, ∆meanmfe, ∆consmfe [0.8146]
∆sci, ∆meanz, ∆consmfe [0.4993]
0 0.2 0.4 0.6 0.8 1 false positive rate 0 0.2 0.4 0.6 0.8 1
∆meanz, ∆meanmfe [0.8202]
∆sci, ∆meanmfe [0.8136]
∆meanmfe, ∆consmfe [0.7757]
∆sci, ∆meanz [0.5035]
∆sci, ∆consmfe [0.4999]
∆meanz, ∆consmfe [0.4999]
0 0.2 0.4 0.6 0.8 1 false positive rate 0 0.2 0.4 0.6 0.8 1
true positive rate
∆meanmfe [0.8150]
∆z [0.5041]
∆consmfe [0.5000]
3 Discussion
RNA molecules and their reverse complements in general form fairly similar secondary structures [25]. For individ-ual sequences, small differences between plus and minus strand arise from small asymmetries in the energy model [9]. In a multiple sequence alignment, GU pairs in an evo-lutionary conserved stem provide information on the cor-rect reading dicor-rection since their reverse complement, AC, is not a canonical base pair. Nevertheless, it is a surpris-ingly hard problem to recognize the correct reading direc-tion of a structured RNA from a multiple sequence alignment in practise. This is an important task in genome annotation, however, since without reliable strand infor-mation it is not even possible to determine whether an evolutionarily conserved secondary structure is located in an UTR or intron, or in an antisense transcript. The read-ing direction is also of obvious importance in context of recognizing class membership by means of short sequence motifs such as SMN-binding sites [26] or a Cajal body localization signal [27].
The RNAstrand tool presented in this contribution uses a SVM to predict strand information from a set of four ther-modynamic features that can readily be computed for any multiple sequence alignment based on well-established energy parameters and dynamic programming algo-rithms. We show here that, together with basic
informa-tion on the size, sequence and GU base pair variation in
the input alignment, these features are sufficient to deter-mine the reading direction of an RNA motif with an evo-lutionary conserved secondary structure. The tool RNAstrand achieves classification accuracies of 90% and above for most ncRNA families. On microRNAs, its per-formance is comparable to that of EvoFold. In applica-tions to data from organisms for which not much genomic DNA has been sequenced, RNAstrand has the advantage that it does not require fairly accurate estimates of evolutionary distances as input.
The main area of application for a tool like RNAstrand is of course in large scale surveys for evolutionary conserved ncRNAs. RNAstrand achieves a 2-fold reduction of mis-classifications on known ncRNAs compared to the naïve approach of determining the likely reading direction by comparing the scores of ncRNA detectors in both direc-tions in the case of RNAz. It has therefore been integrated into the current release 1.0 of the RNAz package [28].
Availability and requirements
Project name: RNAstrand
Project homepage: http://www.bioinf.uni-leipzig.de/Soft ware/RNAstrand/
Operating system(s): platform independent
Programming language: C
Requirements: Vienna RNA Package http://www.tbi.uni vie.ac.at/RNA and the LIBSVM library for support vector machines http://www.csie.ntu.edu.tw/~cjlin/libsvm/
License: GNU GPL.
Restrictions to use by non-academics: Note that a license
is needed to include source code from the Vienna RNA
Package in commercial software projects.
Additional material
Additional File 1
Supplementary material. Supplementary material to RNAstrand: reading direction of structured RNAs in multiple sequence alignments. Click here for file
[http://www.biomedcentral.com/content/supplementary/1748-7188-2-6-S1.pdf]
Table 4: Comparison of classification accuracies versus EvoFold.
Naïve EvoFold-based classification
correct incorrect
RNAstrand fwd correct 123 [111;12] 16 [15;1]
incorrect 17 [17; 0] 11 [8;3]
rev correct 121 [109;12] 12 [11;1]
incorrect 19 [19; 0] 15 [12;3]
all correct 244 [220;24] 28 [26;2]
incorrect 36 [36; 0] 26 [20;6]
Strand prediction of RNAstrand compared to naïve prediction of EvoFold. The first row of the table refers to alignments of known ncRNA loci given in the direction of the ncRNA. The second row belongs to the corresponding reverse complementary alignments. The last row summarizes the first and second row. First numbers in brackets give classifications of alignments containing miRNAs and
Naïve RNAz-based classification
correct incorrect
RNAstrand fwd correct 17961 7579
incorrect 1570 3810
rev correct 17855 7521
incorrect 1676 3868
all correct 35816 15100
incorrect 3246 7678
Publish with BioMed Central and every scientist can read your work free of charge
"BioMed Central will be the most significant development for disseminating the results of biomedical researc h in our lifetime."
Sir Paul Nurse, Cancer Research UK
Your research papers will be:
available free of charge to the entire biomedical community
peer reviewed and published immediately upon acceptance
cited in PubMed and archived on PubMed Central
yours — you keep the copyright
Submit your manuscript here:
http://www.biomedcentral.com/info/publishing_adv.asp
BioMedcentral
Acknowledgements
We thank Ivo L. Hofacker and Stefan Washietl for valuable comments, and an anonymous referee for his ideas concerning the "mysterious" residual bias. This work was supported in part by the DFG Bioinformatics Initiative (BIZ-6/1-2) and the State of Saxony.
References
1. Washietl S, Hofacker IL, Stadler PF: Mapping of conserved RNA secondary structures predicts thousands of functional non-coding RNAs in the human genome. Nat Biotechnol 2005,
23(11):1383-1390.
2. Pedersen JS, Bejerano G, Siepel A, Rosenbloom K, Lindblad-Toh K, Lander ES, Kent J, Miller W, Haussler D: Identification and Classi-fication of Conserved RNA Secondary Structures in the Human Genome. PLoS Comput Biol 2006, 2(4):e33.
3. Washietl S, Pedersen JS, Korbel JO, Gruber A, Hackermüller J, Hertel J, Lindemeyer M, Reiche K, Stocsits C, Tanzer A, Ucla C, Wyss C, Antonarakis SE, Denoeud F, Lagarde J, Drenkow J, Kapranov P, Gin-geras TR, Guigó R, Snyder M, Gerstein MB, Reymond A, Hofacker IL, Stadler PF: Structured RNAs in the ENCODE Selected Regions of the Human Genome. Gen Res 2007 in press. 4. Missal K, Rose D, Stadler PF: Non-coding RNAs in Ciona
intesti-nalis. Bioinformatics 2005, 21(Suppl 2):ii77-ii78.
5. Missal K, Zhu X, Rose D, Deng W, Skogerbø G, Chen R, Stadler PF:
Prediction of Structured Non-Coding RNAs in the Genome of the Nematode Caenorhabitis elegans. J Exp Zoolog B Mol Dev Evol 2006, 306(4):379-392.
6. Rose DR, Hackermüller J, Washietl S, Findeiß S, Reiche K, Hertel J, Stadler PF, Prohaska SJ: Computational RNomics of Drosophi-lids. BMC Genomics 2007 in press.
7. Kapranov P, Cheng J, Dike S, Nix D, Duttagupta R, Willingham AT, Stadler PF, Hertel J, Hackermüller J, Hofacker IL, Bell I, Cheung E, Drenkow J, Dumais E, Patel S, Helt G, Madhavan G, Piccolboni A, Sementchenko V, Tammana H, Gingeras TR: RNA Maps Reveal New RNA Classes and a Possible Function for Pervasive Transcription. Science 2007.
8. Cristianini N, Shawe-Taylor J: An Introduction to Support Vector Machines Cambridge UK: Cambridge University Press; 2000. 9. Mathews DH, Sabina J, Zuker M, Turner H: Expanded Sequence
Dependence of Thermodynamic Parameters Provides Robust Prediction of RNA Secondary Structure. J Mol Biol 1999, 288:911-940.
10. Lu ZJ, Turner DH, Mathews DH: A set of nearest neighbor parameters for predicting the enthalpy change of RNA sec-ondary structure formation. Nucleic Acids Res 2006,
34:4912-4924.
11. Hofacker IL, Fekete M, Stadler PF: Secondary Structure Predic-tion for Aligned RNA Sequences. J Mol Biol 2002,
319:1059-1066.
12. Doshi KJ, Cannone JJ, Cobaugh CW, Gutell RR: Evaluation of the suitability of free-energy minimization using nearest-neigh-bor energy parameters for RNA secondary structure predic-tion. BMC Bioinformatics 2004, 5:105.
13. Carter RJ, Dubchak I, Holbrook SR: A computational approach to identify genes for functional RNAs in genomic sequences.
Nucl Acids Res 2001, 29(19):3928-3938.
14. Hofacker IL, Fontana W, Stadler PF, Bonhoeffer LS, Tacker M, Schus-ter P: Fast Folding and Comparison of RNA Secondary Struc-tures. Monatsh Chem 1994, 125:167-188.
15. Washietl S, Hofacker IL, Stadler PF: Fast and reliable prediction of noncoding RNAs. Proc Natl Acad Sci USA 2005, 102:2454-2459. 16. Gardner PP, Wilm A, Washietl S: A benchmark of multiple sequence alignment programs upon structural RNAs. Nucl Acids Res 2005, 33:2433-2439.
17. Washietl S: rnazWindow.pl. [http://www.tbi.univie.ac.at/~wash/ RNAz/man/rnazWindow.html].
18. Chang CC, Lin CJ: LIBSVM: a library for support vector machines 2001 [http://www.csie.ntu.edu.tw/~cjlin/libsvm].
19. Youden WJ: Index for rating diagnostic tests. Cancer 1950,
3:32-35.
20. Liu C, Bai B, Skogerbœ G, Cai L, Deng W, Zhang Y, Bu D, Zhao Y, Chen R: NONCODE: an integrated knowledge database of non-coding RNAs. Nucleic Acids Res 2005, 33:D112-D115.
21. Griffiths-Jones S, Moxon S, Marshall M, Khanna A, Eddy SR, Bateman A: Rfam: annotating non-coding RNAs in complete genomes.
Nucleic Acids Res 2005, 33:D121-D124.
22. Griffiths-Jones S: The microRNA Registry. Nucl Acids Res 2004,
32:D109-D111.
23. Lestrade L, Weber MJ: snoRNA-LBME-db, a comprehensive database of human H/ACA and C/D box snoRNAs. Nucleic Acids Research 2006, 34:D158-D162.
24. The ENCODE Project Consortium: Identification and analysis of functional elements in 1% of the human genome by the ENCODE pilot project. Nature 2007 in press.
25. Fontana W, Stadler PF, Bornberg-Bauer EG, Griesmacher T, Hofacker IL, Tacker M, Tarazona P, Weinberger ED, Schuster P:
RNA Folding Landscapes and Combinatory Landscapes. Phys Rev E 1993, 47:2083-2099.
26. Yong J, Golembe TJ, Pellizzoni DJBL, Dreyfuss G: snRNAs Contain Specific SMN-Binding Domains That Are Essential for snRNP Assembly. Mol Cell Biol 2004, 24:2747-2756.
27. Richard P, Darzacq X, Bertrand E, Jády BE, Verheggen C, Kiss T: A common sequence motif determines the Cajal body-specific localization of box H/ACA scaRNAs. EMBO J 2003,
22:4283-4293.