R E S E A R C H
Open Access
Principal component analysis based
unsupervised feature extraction applied to
budding yeast temporally periodic gene
expression
Y-h Taguchi
Correspondence: [email protected] Department of Physics, Chuo University, 1-13-27 Kasuga, Bunkyo-ku, 112-8551 Tokyo, Japan
Abstract
Background: The recently proposed principal component analysis (PCA) based unsupervised feature extraction (FE) has successfully been applied to various bioinformatics problems ranging from biomarker identification to the screening of disease causing genes using gene expression/epigenetic profiles. However, the conditions required for its successful use and the mechanisms involved in how it outperforms other supervised methods is unknown, because PCA based unsupervised FE has only been applied to challenging (i.e. not well known) problems.
Results: In this study, PCA based unsupervised FE was applied to an extensively studied organism, i.e., budding yeast. When applied to two gene expression profiles expected to be temporally periodic, yeast metabolic cycle (YMC) and yeast cell division cycle (YCDC), PCA based unsupervised FE outperformed simple but powerful
conventional methods, with sinusoidal fitting with regards to several aspects: (i) feasible biological term enrichment without assuming periodicity for YMC; (ii) identification of periodic profiles whose period was half as long as the cell division cycle for YMC; and (iii) the identification of no more than 37 genes associated with the enrichment of biological terms related to cell division cycle for the integrated analysis of seven YCDC profiles, for which sinusoidal fittings failed. The explantation for differences between methods used and the necessary conditions required were determined by comparing PCA based unsupervised FE with fittings to various periodic (artificial, thus pre-defined) profiles. Furthermore, four popular unsupervised clustering algorithms applied to YMC were not as successful as PCA based unsupervised FE. Conclusions: PCA based unsupervised FE is a useful and effective unsupervised method to investigate YMC and YCDC. This study identified why the unsupervised method without pre-judged criteria outperformed supervised methods requiring human defined criteria.
Keywords: Principal component analysis, Feature extraction, Budding yeast, Cell division cycle, Gene expression
TaguchiBioData Mining (2016) 9:22 Page 2 of 23
Background
Small-sample-large-feature problems, which occur when limited numbers of samples are available despite a large number of associated features, are common when biomedi-cal/genomic data sets are analyzed. This is because the number of features is often equal to or greater than the number of genes (i.e., tens of thousands), whereas the number of samples are usually as small as the number of patients (in vivo study) or cell lines (in vitro study), i.e. a few hundred but often fewer than ten. The recently proposed princi-pal component analysis (PCA) based unsupervised feature extraction (FE) [1–12] is an effective method to overcome these difficulties. Previously, PCA based unsupervised FE successfully identified stable (relatively insensitive to sample selection) sets composed of limited numbers of circulating microRNA that discriminated between multiple dis-eases (putative universal disease biomarkers), genes associated with aberrant promoter methylation commonly found among three distinct autoimmune diseases by integrating promoter methylation profiles from three distinct autoimmune diseases, and candidate disease-causing genes ranging from cancers to neurodegenerative diseases by integrat-ing distinct expression profiles (genomic data and DNA methylation, mRNA and miRNA profiles, mRNA expression and promoter methylation). Despite several successful stud-ies, the use of this methodology is not widely supported, possibly because no criteria regarding its successful use and the mechanisms involved in how it outperforms other methods have been reported. This lack of knowledge is because PCA based unsupervised FE was previously applied to challenging problems that other conventional methods can-not deal with to demonstrate superiority to existing methods. Without a comparison of results, the reasons why PCA based unsupervised FE can outperform other conventional methods cannot be determined.
In this study, we applied PCA based unsupervised FE to a well-established and exten-sively studied problem; namely the identification ofSaccharomyces cerevisiaegenes that exhibit temporal periodic expression. Because budding yeast genes have been ascribed well-defined functions to a greater degree than for other organisms, the suitability of genes identified by PCA based unsupervised FE can be evaluated. Specifically, two kinds of gene expression profiles measured under distinct conditions - yeast metabolic cycle (YMC) and yeast cell division cycle (YCDC) - were analyzed such that evaluations made were not strictly dependent upon the specific example. We found that fitting to the assumed functions including frequently employed sinusoidal functions is often erroneous and this might explain why conventional and supervised methods are often outperformed by unsupervised methodologies that do not assume the length of period as well as func-tional forms to be fitted. This also generally demonstrates the disadvantage of employing model-based methodologies because they are popular or commonly used. To our knowl-edge, this is the first successful unsupervised identification of budding yeast genes that exhibit temporal periodicity without specifying the length of period or accessing the information of known (previously reported) cell cycle regulated genes.
Results
PCA based unsupervised FE applied to yeast metabolic cycle
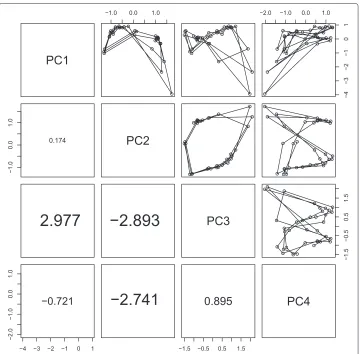
Fig. 1Upper triangle: scatter plots in YMC between thekth (1≤k≤4) PC loadings,vkj− vkjj, 1≤j≤M, whereMis the number of time points.Lower triangle: winding numberW(M−1);W(M−1)at thekth row andk(<k)th column correspond to the scatter plot at the symmetric position, i.e., at thekth row andkth column. Time dependence of PC2 and PC3 loadings are shown in Fig. 3b. The contributions of PC loadings are 88.7, 6.2, 2.1 and 0.6 %, respectively, indicating that PC loadings,vkj,k=2, 3, with contributions as small as a few percent that correspond to tens of genes when the total number of genes correspond to thousands, cannot be disregarded
identification of winding numbers and scatter plots of PC loadings. Because the first four PC loadings exhibited limit cycles when combined with any of the other four, the four PCs were used for PCA based unsupervised FE (see Methods and Fig. 2). The list of genes identified by PCA based unsupervised FE is shown in Additional file 1: Table S1A.
To identify the biological significance of the identified genes, the identified genes were uploaded to g:profiler [14], an enrichment analysis server. Although the full list of enriched Gene Ontology (GO) terms and pathways is available in Additional file 2: Table S2A, some specific examples are discussed below.
TaguchiBioData Mining (2016) 9:22 Page 4 of 23
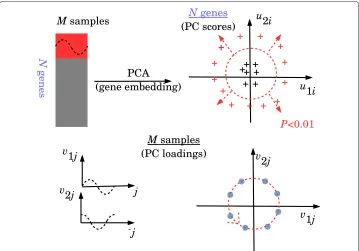
Fig. 2Schematic of PCA based unsupervised FE. In gene expression analyses (top left), limited genes (red) exhibit periodic motion. After gene embedding (top right), genes exhibiting periodic motion (red crosses) are identified as outliers if the BH criterion adjustedP-values are lower than 0.01 (or 0.05) assuming that the PC score attributed to each gene obeys Gaussian distribution. This is because PC loading attributed to each sample exhibits periodic motion (bottom)
Genes and Genomes (KEGG) pathways were significantly enriched including reasonable pathways, such as “TCA cycle”, “Ribosome” and “metabolic pathways”. Twenty-one signif-icantly enriched REACTOME pathways were mainly related to metabolism. All of these enrichments suggested the successful identification of critical genes in YMC using PCA based unsupervised FE without specifying the length of period. To our knowledge, this is the first successful identification of cell cycle regulated genes without using the length of period or accessing the information of known (previously reported) cell cycle regulated genes.
a
b
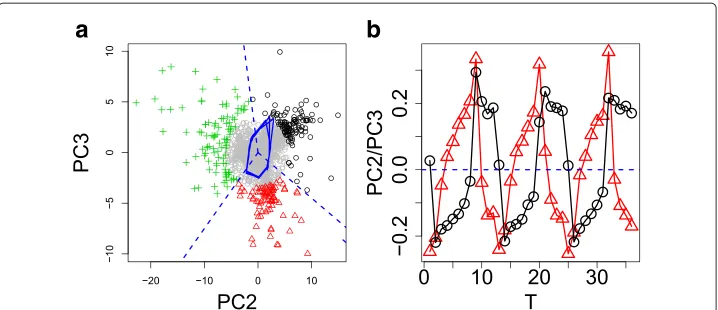
Fig. 3aTwo dimensional embeddings of gene expression in YMC using PC2 and PC3 scoresukj,k=2, 3, (the list of genes is shown in Additional file 1: Table S1B).Black circle,red triangles, andgreen crossesrepresent genes extracted andgray circlesrepresent other genes. Biological terms enriched in genes shown asblack circles,red trianglesandgreen crossesare available in columns Cluster_1, Cluster_2, and Cluster_3 in Additional file 4: Table S3, respectively. Colors correspond to clusters identified by K-means.Solid blue lines represent PC2 and PC3 loadings andbroken blue linesrepresent the boundary between the three clusters.b Time dependence of PC2 (black) and PC3 (red) loadingsukj,k=2, 3
angular variables, but with two-dimensional Cartesian coordinates. This suggested that PCA based unsupervised FE successfully identified three clusters coincident with phase variables during cell division cycles in an unsupervised manner without specifying the length of period. This demonstrates the superiority of PCA based unsupervised FE over other methods.
To confirm the superiority of PCA based unsupervised FE, we separately uploaded three groups of genes to g:profiler (Additional file 4: Table S3). These groups represented three distinct biological functions - ribosomes, mitochondria, and cell division - which were identified [13] as three functional groups assigned to three groups of genes. Thus, PCA based unsupervised FE without specifying the length of cell cycle period successfully identified the three functional gene groups identified by Tu et al. after their sophisticated and careful inspection of gene expression. Thus, PCA based unsupervised FE identified gene expression similar to supervised methods.
TaguchiBioData Mining (2016) 9:22 Page 6 of 23
We also investigated protein-protein interactions (PPI) among genes identified by PCA based unsupervised FE using PC1, PC2, PC3 and PC4 (genes listed in Additional file 1: Table S1A). We uploaded the list of genes to the STRING server [15], which integrates various pairwise interactions between proteins. PPI enrichment estimated by STRING, which identified 419 genes among 422 uploaded genes, was 12,525, compared with the expected number, 5.50×10³(P= 0). Thus, there was highly significant PPI enrichment between the selected genes.
PCA based unsupervised FE applied to yeast cell division cycle
Although PCA based unsupervised FE was successfully applied to YMC, we confirmed its usefulness using another example, YCDC. Although YCDC is a yeast biological pro-cess that exhibits temporally periodic oscillations of gene expression, in contrast to the self-induced nature of YMC, YCDC is initiated from the artificially arrested G1 state; thus it is expected to differ from YMC. PCA based unsupervised FE was applied to seven of eight gene expression profiles in cyclebase [16], which ranks genes based upon both periodicity and the amplitude of gene expression. One set of data [17] was excluded because de Lichtenberg et al. pre-screened genes based upon previous studies. Because PCA based unsupervised FE screens significant genes as outliers, it does not function without the inclusion of non-outliers (seemingly non-significant) genes. Winding num-ber analysis was applied and a pair of PCs that exhibited limit cycle were identified (Additional file 5: Figure S1). PCA based unsupervised FE identified more than 100 genes for each profile (list of genes shown in Additional file 1: Table S1C to S1I). Identified genes were uploaded to g:profiler independently (Additional file 6: Table S4, columns A to G correspond to Additional file 5: Figure S1A to S1G). A large number of iden-tified biological terms were significantly enriched (Fig. 4) and were specifically related to cell division cycle, e.g., “cell cycle”, “cell cycle process”, “cell cycle phase transition”, “mitotic cell cycle”, “mitotic cell cycle process”, “DNA metabolic process”, “DNA repair”, (GO BP terms enriched in all seven experiments), “protein-DNA complexes”, “replica-tion fork”, “nuclear replica“replica-tion fork”, (GO CC terms enriched in all seven experiments) “cyclin-dependent protein serine/threonine kinase regulatory activity” (a GO MF term enriched in all seven experiments), “missmatch repair”, “cell cycle - yeast”, “DNA repli-cation” (KEGG pathways enriched in all seven experiments), “cell cycle”, “mitotic G1 - G1/S phases”, “mitotic G2 - G2/M phases”, (REACTOME pathways enriched in all seven experiments), and MCM1 and MCM1+SFF TF motifs (enriched in all seven
exper-iments). Fkh2 was previously recognized as a critical component of the MCM1-SFF
complex for the regulation of cell cycle-dependent gene expression [18] and regulates the cell division cycle of Schizosaccharomyces pombe[19]. Thus, PCA based unsuper-vised FE identified many biological terms specific to the cell division cycle for all seven experiments.
Fig. 4Number of biological terms enriched in each experiment (YCDC [16]). Key for color bars and individual experiments:gray barscorrespond to Additional file 5: Figure S1A, Additional file 1: Table S1C and Additional file 6: Table S4A,black barscorrespond to Additional file 5: Figure S1B, Additional file 1: Table S1D and Additional file 6: Table S4B,magenta barscorrespond to Additional file 5: Figure S1C, Additional file 1: Table S1E and Additional file 6: Table S4C,green barscorrespond to Additional file 5: Table Figure S1D, Additional file 1: Table S1F and Additional file 6: Table S4D,blue barscorrespond to Additional file 5: Figure S1E, Additional file 1: Table S1G and Additional file 6: Table S4E,cyan barscorrespond to Additional file 5: Figure S1F, Additional file 1: Table S1H and Additional file 6: Table S4F, andpink barscorrespond to Additional file 5: Figure S1G, Additional file 1: Table S1I and Additional file 6: Table S4G
Integration of YCDC gene expression using PCA based unsupervised FE
PCA based unsupervised FE identified common genes over seven experiments
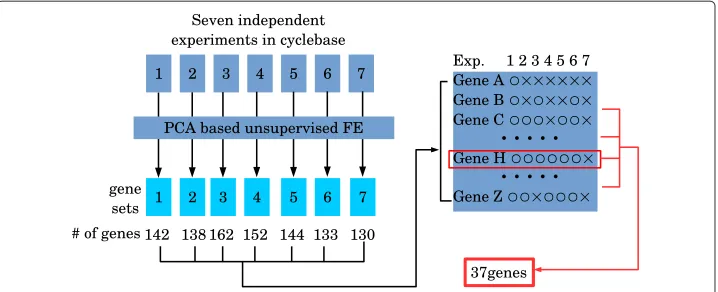
Although we demonstrated PCA based unsupervised FE was successful for YMC and YCDC, the most important advantage compared with conventional (supervised) FE was integration. Because cyclebase is the integrated analysis of multiple cell division cycle gene expressions, it is the correct target for comparisons with integrated analysis using PCA based unsupervised FE. For integrated analyses by PCA based unsupervised FE, we used genes commonly selected among the seven experiments (see Fig. 5). Thirty-seven genes were identified in six or more of the seven experiments (list of genes is shown in Additional file 1: Table S1J). This was remarkable, because several hundred genes were selected from each experiment, which included several thousand genes. The probabil-ity that as many as 37 genes were accidentally identified in six of seven independent experiments is extremely small.
Enrichment analyses via YeastMine and g:profiler
TaguchiBioData Mining (2016) 9:22 Page 8 of 23
Fig. 5Schematic of integrated analysis of YCDC by PCA based unsupervised FE. After PCA based unsupervised FE was applied to each of seven experiments, seven sets of genes were identified. Then, the frequency of each gene identified within the seven sets of genes was counted. Thirty-seven genes were associated with more than or equal to six counts
To confirm the superiority of PCA based unsupervised FE over cyclebase, genes were uploaded to an alternative enrichment server, YeastMine [22] (full list of results is shown in Additional file 8: Table S6). YeastMine was employed as well as g:profiler because it specifically targets yeasts. Thus, slight differences missed by g:profiler might be detected by YeastMine. Table 1 shows the top five GO BP terms/publications for both gene sets. As expected, YeastMine reported a clear superiority of PCA based unsu-pervised FE over cyclebase. GO BP terms enriched in genes identified by PCA based unsupervised FE were directly related to the cell division cycle, whereas genes from cyclebase were not. For publication enrichment, PCA based unsupervised FE outper-formed cyclebase, because the top ranked publication for genes identified by PCA based unsupervised FE included 20 genes and studied cell division cycle while the genes iden-tified by cyclebase only included seven genes and did not directly study cell division cycle.
Gene–gene interactions via identification servers, STRING and GeneMania
We also uploaded 37 genes identified by PCA based unsupervised FE and 36 genes extracted from cyclebase to the STRING server, which identified 155 PPIs and 101 PPIs, respectively (P =0 for both) while the expected number of PPIs was 30 and 22, respec-tively. Although both were significant, genes identified by PCA based unsupervised FE identified more PPIs (1.5-fold greater).
Two sets of genes were additionally uploaded to GeneMania [23], another gene–gene interaction identification server. Again, this analysis demonstrated greater numbers of gene–gene interactions between genes identified by PCA based unsupervised FE than those by cyclebase (Fig. 6). Thus, independent of the servers employed, genes identified by PCA based unsupervised FE interacted with each other to a greater degree than those identified by cyclebase.
Taken together, these findings indicate the superiority of PCA based unsupervised FE compared with cyclebase with regards to integrated analysis and enrichment anal-yses of identified genes. These results demonstrate how PCA based unsupervised FE outperformed sinusoidal fitting.
Discussion
Comparison with synthetic data sets
To confirm the superiority of PCA based unsupervised FE over FEs based on sinusoidal fittings, we applied both to synthetic data sets (see Methods).Pvalues were attributed to each gene by either PCA based unsupervised FE using the first and second PC score determined by gene embedding or sinusoidal regression.P-values were adjusted by the Benjamini and Hochberg (BH) criterion [24] and genes associated with adjustedP-values less than 0.01 were selected. Table 2 shows the confusion matrixes averaged over 100 independent ensembles with changing noise-signal ratioAfrom 1 to 6 (gene expression with largerAwas more disturbed (non-sinusoidal)). PCA based unsupervised FE always achieved 100 % accuracy independent of the amount ofA, while the accuracy achieved by sinusoidal fitting gradually deceased asAincreased. This suggested the superiority of PCA based unsupervised FE over sinusoidal regression.
Taguchi
BioData
M
ining
(2016) 9:22
Page
10
of
23
Table 1Top five GO BP term/publication enrichments reported by YeastMine [22] in genes identified by either PCA based unsupervised FE or cyclebase
PCA based unsupervised FE Cyclebase
GO BP Term p-Value # GO BP Term p-Value #
Cell cycle [GO:0007049] 5.32E-10 24 Chromosome organization [GO:0051276] 1.13E-8 20 Cell cycle process [GO:0022402] 3.08E-8 21 Telomere maintenance via recombination [GO:0000722] 3.34E-8 8 Mitotic cell cycle [GO:0000278] 4.45E-8 17 DNA metabolic process [GO:0006259] 3.50E-8 19 Mitotic cell cycle process [GO:1903047] 2.23E-7 16 Telomere maintenance [GO:0000723] 2.07E-6 9 Cell division [GO:0051301] 1.02E-6 15 Anatomical structure homeostasis [GO:0060249] 2.07E-6 9
Publication PMID p-Value # Publication PMID p-Value #
Clustering time-varying gene expression profiles using scale-space signals
Genome-wide array-CGH analysis reveals YRF1 gene copy number variation that modulates genetic stability in distillery yeasts
[16452778] 9.74E-24 20 [26384347] 2.80E-12 7
Serial regulation of transcriptional regulators in the yeast cell cycle Transcriptional effects of the potent enediyne anti-cancer agent Calicheamicin gamma(I)(1)
[11572776] 6.14E-17 16 [11880039] 1.11E-11 7
Identification of a core set of signature cell cycle genes whose relative order of time to peak expression is conserved across species
Linking DNA replication checkpoint to MBF cell-cycle transcription reveals a distinct class of G1/S genes
[22135306] 6.34E-12 10 [22333912] 2.32E-11 11
Identification of sparsely distributed clusters of cis-regulatory elements in sets of co-expressed genes
Mcm1p-induced DNA bending regulates the formation of ternary transcription factor complexes
[15155858] 3.71E-10 9 [12509445] 2.35E-11 8
Computational reconstruction of transcriptional regulatory modules of the yeast cell cycle
A genetic screen for yeast genes induced by sustained osmotic stress
[17010188] 4.17E-10 12 [12868060] 1.82E-10 7
a b
Fig. 6Gene-gene interactions identified by GeneMania [23]. Genes identified by (a) PCA based unsupervised FE and (b) cyclebase.Purple: co-expression,green: genetic interaction,pink: physical interactions,orange: predicted,blue: co-localization
PC scores attributed to each gene (red open circles in Additional file 9: Figure S2(A)). As shown in Additional file 9: Figure S2(B), circular structures were fully independent of sinusoidal shapes of PC loadings attributed to samples. Despite this, successful regres-sion analysis between pre-defined non-sinusoidal periodic functions (CjandSj) and PC
loadings (vkj,k= 1, 2) suggested the ability of PCA based unsupervised FE to reproduce
original non-sinusoidal functional forms (Additional file 9: Figure S2(C) and (D)). Of note, PCA based unsupervised FE correctly identified non-sinusoidal periodic gene expres-sion. This might explain why PCA based unsupervised FE performed well even when gene expression profiles were far from sinusoidal as shown Additional file 5: Figure S1. This supports the robustness of PCA based unsupervised FE and the superiority over sinusoidal regression based FE.
Table 2Confusion matrixes for synthetic data sets
A 1 2 3
PCA P≥0.01 P<0.01 P≥0.01 P<0.01 P≥0.01 P<0.01
i>100 9900 0 9900 0 9900 0
i≤100 0 100 0 100 0 100
Regression P≥0.01 P<0.01 P≥0.01 P<0.01 P≥0.01 P<0.01
i>100 9900 0 9900 17 9900 48
i≤100 0 100 0 83 0 52
A 4 5 6
PCA P≥0.01 P<0.01 P≥0.01 P<0.01 P≥0.01 P<0.01
i>100 9900 0 9900 0 9900 0
i≤100 0 100 0 100 0 100
Regression P≥0.01 P<0.01 P≥0.01 P<0.01 P≥0.01 P<0.01
i>100 9900 64 9900 72 9900 85
i≤100 0 36 0 28 0 15
TaguchiBioData Mining (2016) 9:22 Page 12 of 23
Usage of g:profiler instead of DAVID
g:profiler was used as an enrichment analysis server instead of the more popular The Database for Annotation, Visualization and Integrated Discovery (DAVID) [25] because our preliminary experiments suggested DAVID identifies less enrichments than g:profiler, which allows DAVID to enhance the superiority of PCA based unsupervised FE more than g:profiler. DAVID overlooked enrichments in 36 genes extracted from cyclebase, while g:profiler did not. In the integrated analysis of YCDC, DAVID did not identify the enrich-ments of cell division cycle specific GO BP terms in 36 genes extracted from cyclebase including “cell division”, “cell cycle phase”, “M phase”, “mitosis”, “regulation of cell cycle”, and “M phase of mitotic cell cycle”, which were identified by g:profiler. Because the pri-mary purpose of this study was not to demonstrate superiority, but to investigate why PCA based unsupervised FE was superior, too large an outperformance of PCA based unsupervised FE should be avoided. Thus, we decided to use g:profiler instead of DAVID.
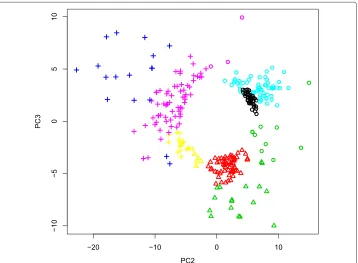
The feasibility of three clusters identified in Fig. 3
The number of clusters in Fig. 3 was assumed to be three based upon a previous study [13]. This estimation was not based upon our own analysis. To determine whether a clus-ter number of three was justified, we applied a Gaussian mixture clusclus-tering algorithm that reports the optimal number of clusters in a data driven way (see Methods). Figure 7 shows the comparison of clustering between K-means and Gaussian mixer. The optimal number of clusters identified by Gaussian mixture was not three, which we employed to perform K-means (Fig. 3). However, the seven clusters identified did not contradict the three clusters identified by K-means. Table 3 shows a comparison between the two iden-tified clusterings. Cluster 1 ideniden-tified by K-means was mostly composed of clusters 1 and
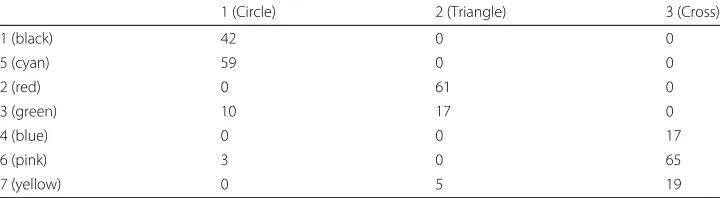
Table 3Comparison between clusters identified by K-means and Gaussian mixture shown in Fig. 7
1 (Circle) 2 (Triangle) 3 (Cross)
1 (black) 42 0 0
5 (cyan) 59 0 0
2 (red) 0 61 0
3 (green) 10 17 0
4 (blue) 0 0 17
6 (pink) 3 0 65
7 (yellow) 0 5 19
Rows: Gaussian mixture, columns: K-means
5 identified by Gaussian mixture; cluster 2 identified by K-means was mostly composed of clusters 2 and 3 identified by Gaussian mixture; and cluster 3 identified by K-means was mostly composed of clusters 4, 6 and 7 identified by Gaussian mixture. Although there were some discrepancies (cluster 3 identified by Gaussian mixtures was divided into clusters 1 and 2 identified by K-means, while a few genes within clusters 6 and 7 identified by Gaussian mixture were classified into K-means-identified clusters 1 and 2 that differed from cluster 3 where the majority of genes in clusters 6 and 7 identified by Gaussian mixture belong), the majority of genes were similarly clustered between K-means and Gaussian mixture.
The detailed analysis given bymclustis shown in Additional file 10: Figure S3 also strengthens the feasibility of assuming a cluster number of three. The dependence of Bayesian information criterion (BIC) upon cluster numbers showed a quick increase of BIC up to three clusters while BIC increased slowly between cluster numbers 3 and 7. This suggested that the cluster number of three was of primary importance. In addition, both “Classification Uncertainty” and “log Density Contour Plot” clearly show three clusters, not seven. Taken together, we assumed the three clusters in Fig. 3 were feasible.
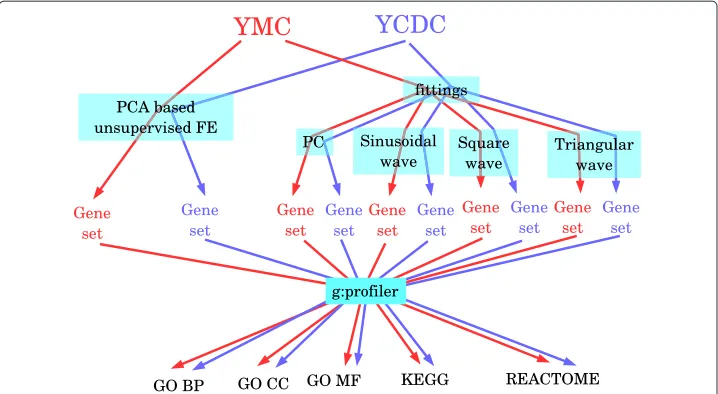
Comparison between PCA based unsupervised FE and FE based on fitting to various periodic functions using biological term enrichments
TaguchiBioData Mining (2016) 9:22 Page 14 of 23
Fig. 8Schematic of comparisons between PCA based unsupervised FE and FE based on fittings to various periodic functions
was successfully suppressed as intended. However, Venn diagrams did not show much distinction between YMC and YCDC but exhibited a distinction between PCA based unsupervised FE and FE based upon fittings; genes identified by PCA based unsuper-vised FE were always accompanied by biological terms not enriched in fittings that was not dependent on how many enrichments were identified in genes identified by PCA based unsupervised FE. For example, three of five REACTOME pathways enriched in YCDC only identified by PCA based unsupervised FE were “Mitotic G2-G2/M phases”, “G2/M Transition”, and “Cyclin A/B1 associated event during G2/M transition”, which are highly cell division cycle specific. Ten GO CC terms enriched in YCDC only identified by PCA based unsupervised FE included “cell periphery”, “cell wall” and “fungal type cell wall”, which are also highly cell division cycle specific. Thus, PCA based unsupervised FE can identify biological terms not detected by FE based upon fittings, despite the selec-tion of gene expression profiles to which PCA based unsupervised FE achieved the least performance.
TaguchiBioData Mining (2016) 9:22 Page 16 of 23
Suppose thatx(t)is a gene expression time course of a gene at timetandx(t)is com-posed of two parts; i) a part not coincident with the considered functional form (thus, apparently assumed to be biologically irrelevant, noisy) partxn(t)and ii) a significant part
xs(t)that is coincident with the considered functional forms, e.g., PCs or various
peri-odic functions (Fig. 11), i.e.,x(t) = xn(t)+xs(t). Fitting to PCs evaluates each gene by
the ratio ofxs(t)tox(t)because it makes use of the correlation betweenx(t)andxs(t),
while PCA based unsupervised FE evaluates the amount ofxs(t)because it measures the
projection onto the plane spanned by two PCs used for FE. This is the main difference between the two methodologies. Because a projection-based approach, i.e., PCA based unsupervised FE, seems to outperform other FEs based upon fittings, rankings based upon projections are more biologically feasible in the present study than those based upon correlations.
This may be reasoned biologically as follows: genes often have multi-functional effects, thusxn(t)should not be regarded as a penalty, but should be simply ignored, becausexn(t)
may not be noise but is considered not to have a function, e.g., housekeeping genes. Alter-natively the superiority of projection to correlation may also be interpreted biologically as follows: under biological situations where periodic motions are strongly induced, many genes passively exhibit periodic gene expression. This phenomenon can be observed in other organisms; for example, although many genes in cyanobacteria exhibit circadian rhythms, they are suppressed by the knockout of a small number of genes [26]. Therefore, sinusoidal fittings are not always a good strategy to identify genes that induce circadian rhythms, because passively oscillating genes may also exhibit circadian rhythm. Similarly, in YMC and YCDC, simple fittings to periodic functions or PCs are inferior to PCA based unsupervised FE, which consider projections ontoxs(t)that exhibit biologically feasible
periodic motion rather than a correlation betweenx(t)andxs(t).
This is illustrated in Fig. 10, which shows a Venn diagram in YMC between genes iden-tified by PCA based unsupervised FE using only PC2 and PC3, genes selected based on fittings to PC2 and PC3, and genes identified by PCA based unsupervised FE using PC1, PC2, PC3 and PC4. As discussed above, the genes in YMC identified by PCA based unsu-pervised FE using PC1, PC2, PC3, and PC4 were biologically feasible. Genes identified by PCA based unsupervised FE using only PC2 and PC3 almost overlapped with the subset of genes identified by PCA based unsupervised FE using PC1, PC2, PC3 and PC4, while genes selected by FE based on fittings to PC2 and PC3 do not. This suggests that projec-tion is better than correlaprojec-tion ifxn(t)cannot be definitely considered to be noise, and thus
biologically irrelevant.
Comparisons with other unsupervised clustering and embedding methods
Previous unsupervised studies of YMC/YCDC
Fig. 10 Venn diagram between genes identified by PCA based unsupervised with PC2 and PC3 (gray), with PC1, PC2, PC3 and PC4 (green) and by FE based upon fittings to PC2 and PC3 (red), in YMC [13]
be unsupervised. To decide which cluster should be used for FE, they selected clusters associated with known cell division cycles. This is a potential limitation because gene expression profiles associated with a period distinct from the cell cycle period might be missed. Another example is a study by Rowicka et al. [28], who identified cell cycle regulated genes without specifying cell division cycle using an entropy method; how-ever, they extracted genes associated with gene expression similar to known cell cycle regulated genes. Thus, to our knowledge, no methods as unsupervised as ours have successfully identified cell cycle regulated genes. The only assumption we made was that gene expression must be periodic (i.e., winding number analysis) regardless of the period.
Other unsupervised clustering
TaguchiBioData Mining (2016) 9:22 Page 18 of 23
Other unsupervised embedding methodologies
We also investigated replacing PCA with other embedding methods. The usage of ker-nel tricks [29] together with an embedding method was unsuccessful because it provided nothing to correspond with PC loadings, which enables the biological interpretation of embeddings and specification of which PCs should be used for FE. In contrast, independent component analysis (ICA) [30] could replace PCA, because it provides mix-ing weights that correspond to PC loadmix-ings. However, after replacmix-ing PCA with ICA for YMC analyses, we found that ICA often provided more than two almost identical profiles as independent components, because ICA attempts to maximize the overall (aver-age) mutual independences among components; thus, local independence (independence among a specific pair of components) is not guaranteed. Furthermore, ICA does not pro-vide variables that can be used to evaluate the importance of a PC in PCA. Therefore, identifying components used for FE in ICA is more difficult. Currently we do not have anything to replace PCA in PCA based unsupervised FE.
Conclusions
In this study, we applied the recently proposed PCA based unsupervised FE to two bud-ding yeast cell division time course data sets. It outperformed conventional supervised sinusoidal fitting methodologies, which demonstrated the superiority of the unsupervised method over the supervised method. This might explain why PCA based unsupervised FE often outperformed supervised methods when previously applied to various prob-lems. A comparison study between PCA based unsupervised FE and other fitting based FEs identified the mechanism involved in why PCA based unsupervised FE outperforms sinusoidal fitting based FEs.
Methods
Relationships between the figures and tables
Because we have presented many figures and tables whose relationships are very com-plicated, these are explained in Additional file 14: Figure S4. Please note that Additional file 2: Table S2 and Additional file 6: S4A are equivalent to Additional file 11: Table S7A and Additional file 12: S8A, to enhance their understanding.
Gene expression profiles
The YMC gene expression profiles analyzed were downloaded from the Gene Expression Omnibus (GEO) with GEO ID GSE3431. A file “GSE3431_series_matrix.txt” included in “Series Matrix File(s)” was downloaded. YCDC gene expression was downloaded from cyclebase [16]. They were normalized to have a mean of 0 and a variance of 1 within each sample (i.e., N1 ixij=0 and N1ix2ij=1, whereN is the total number of genes. No
further normalization procedures were applied).
PCA based unsupervised FE
Briefly, PCA based unsupervised FE, in contrast to the ordinary usage of PCA, uses features (genes) embedded into the low dimensional space rather than samples. After specifying PCs that exhibit biological significance, features as outliers along the specified PC are extracted as important features. The philosophy behind this methodology is that if a set of features have common dependence upon samples, no matter what they are, they are more likely to construct PCs because PCs represent the majority of behaviors. Samples dependent on PCs likely represent biological significance, e.g., the distinction between control and treated samples. Although there is no evidence to support this hypothe-sis, it is a simple methodology that is not computationally challenging. Gene expression profiles are normalized to have a mean of zero and unit variance before applying PCA.
Gene embedding by PCA
Suppose that we have mRNA expressionxij ofith mRNA ofjth sample. It is also
sup-posed that N1 Ni=1xij=0 and N1Ni=1x2ij = 1.Xis the matrix whose element isxij. In
contrast to the usual usage of PCA, where samples are embedded, genes (mRNAs) are embedded in the PCA based upon unsupervised FE. Thenkth PC scoreukiattributed to
ith gene can be computed as the element of eigenvectorukof the Gram matrixG≡XXT,
XXTuk=λkukwhereλkis eigen value ordered such thatλk+1< λk. Thekth PC loading
vkj attributed tojth sample can be computed as the element ofvk = XTuk, which is the
eigenvector of the matrixXTX, becauseXTXvk=XTXXTuk=XTλkuk =λkvk.
Winding number analysis
To identify limit cycles represented by the series of vectors composed of pairs of PC
load-ings, we usedvkj,k ≡
vkj− vkjj
vkj− vkjj
,j = 1,· · ·,M, where Mis the number of time
points andvkjj= M1 jvkjis used to introduce winding number analysis. Winding
num-ber represents the numnum-ber of times “orbits” rotate around the origin. Winding numnum-ber, W, is defined asW(M)≡jM=1θ2jπ,j+1,M <M, whereθj,j+1represents the
incremen-tal (signed) angle between subsequent vectorsvkj,kandvkj+,k1, which is specifically defined
asθj,j+1≡
vkj,k·vkj+,k1
|vkj,k||vjk+,k1|sign
vkj,k×vkj+,k1
where sign(x)takes±1 dependent upon the sign
ofx. We extracted outliers along the pair ofkth andkth PC loadings associated with the largest| W(M−1) |within the rangek,k ≤ 4, because orbits do not seem to be limit cycles for some pairk,k > 4 with sufficiently large| W(M−1) |. In addition, for the gene expression shown in Additional file 5: Figure S1D, time pointsj>30 were excluded when computing PC scores used for FE, because the time pointsj> 30 seemingly devi-ated from limit cycles and using pointsj > 30 substantially decreased the number of genes extracted as outliers.
Feature extraction
Gene embedding was performed in PCA based unsupervised FE. Then after identifying a setkof PCs whose PC loading were coincident with the distinction between treated
and control samples, outlier genes were identified by assuming a Gaussian distribution of
PC scores usingχsquare distribution,Pi =P
k∈k
uki σk 2 >x
, whereP[>x] is the
TaguchiBioData Mining (2016) 9:22 Page 20 of 23
σkis the standard deviation ofkth PC scores. Then, if BH criterion [24] adjustedPi<0.01
(for YMC) orPi<0.05 (for YCDC), theith gene is identified as an outlier.
Enrichment analysis using g:profiler and YeastMine
Extracted gene IDs in YMC and YCDC were converted to gene symbols based on the probe annotation file available at GEO ID: GPL90 (although GPL90 was associated with GEO ID GSE3431, we used it for cyclebase and unified analysis). A list of gene symbols were uploaded to the “Cocoa:Compact Compare of Annotations” pages included in the g:profiler web pages. Output was extracted as either an Excel or PDF file by specifying the output type option. Gene symbols were also uploaded to YeastMine.P-values were adjusted by specifying the BH criterion.
K-means clustering and Gaussian mixture
PC2 and PC3 scores of extracted genes were processed by thekmeansfunction included in R [34]. To compensate for the initial configuration dependence of K-means, majority clustering was identified within 100 trials by specifying nstart=100. Gaussian mix-ture clustering was performed for the same gene set using theMclustfunction in the
mclustpackage [35] and R [34] with default settings.
PPI identification via STRING and gene–gene interaction identification via GeneMania For both servers, gene symbols used for enrichment analyses were uploaded. For STRING, after selecting the “multiple proteins” menu, organism was specified in the pull down menu below (“Saccharomyces cerevisiae”). “PPI enrichment p-value” will appear under the “Analysis” tab. For GeneMania, in “Customise Advanced options” menu, both “Max resultant genes/attributes” were set to zero to identify only interactions within the uploaded genes.
Regression analysis for FE based on fitting
Gene expression profiles were fitted toward the following regression function:x(t) = C0+C1f(t)+C2f
Fig. 11 Periodic fitting functionsf(t)(left) andf(t+T4): sinusoidal (green), square (blue) and triangular (cyan) wave functions; colors correspond to those used in Fig. 9
Synthetic data set
Supposexij is the gene expression of theith gene at thejth sample.i = 1,. . ., 104,j =
1,. . ., 102.
S0j = sin 2π
25(jmod 25)
Cj0 = cos 2π
25(jmod 25)
Sj = S0j + jSmod 25
Cj1 = Cj0+ Cjmod 25
Cj = Cj1−Sj
jCj1Sj
jS2j
x0ij =
Cjcosδi+Sjsinδi, i≤102
ij, i>102
xij =
x0ij
1 100
j
x0ij−1001 jx0ij
2
where jSmod 25, Cjmod 25,δi, ij are uniform random numbers in the range of
[−A,A] , [−A,A] , [ 0, 2π] , and [−1, 1], respectively. These correspond to the linear combinations of noise added/orthogonalized sinusoidal functions ranging over four periods.Arepresents the ratio of noise-to-signal (pure sinusoidal function); a largerA causesCjandSjto become more distant from pure sinusoidal functions. Please note that
CjandSjforj=1,. . .102remain as complete periodic functions despite the addition of
noises, jSmod 25and Cjmod 25, because noises are also periodic functions. P-values were attributed toxijassuming the sinusoidal regression equation
xij=αiCj0+βiS0j +γi
whereαi,βiandγi are regression coefficients. Thelmfunction in R [34] was used for
TaguchiBioData Mining (2016) 9:22 Page 22 of 23
Additional files
Additional file 1: Table S1.The list of genes selected by PCA based unsupervised FE for various experiments (data sets). See sheet 1 for more details regarding which sheet corresponds to which experiments. (XLSX 31 kb)
Additional file 2: Table S2.Enrichment analyses by g:profiler for the genes listed in Table S1A. (PDF 992 kb)
Additional file 3:Document S1. Genes shown in Fig. 3. Black circles, red triangles, and green crosses are annotated as Cluster_1, Cluster_2, and Cluster_3, respectively. (PDF 19.2 kb)
Additional file 4: Table S3.Enrichment analyses by g:profiler for the genes listed in document S1. (PDF 1361 kb)
Additional file 5: Figure S1.Winding numbers and scatter plots of seven YCDC data sets. (PDF 61.7 kb)
Additional file 6: Table S4.Enrichment analyses by g:profiler for the genes listed in Table S1C to S1I, each of which corresponds to A to G, respectively. (PDF 235 kb)
Additional file 7: Table S5.Enrichment analyses by g:profiler for the genes listed in Table S1J (PCA) and S1K (CYCLEBASE). (PDF 433 kb)
Additional file 8: Table S6.Enrichment analysis by YeastMine, the rest of Table 1. (XLSX 114 kb)
Additional file 9: Figure S2.PCA based unsupervised FE results for synthetic data (A=1, 2, 3, 4, 5, 6). Representative examples (one of 100 ensembles, from which the averages shown in Table 2 were taken). (A) The first and second PCA scores attributed to genes. Red open circles correspond to genes associated with significant adjustedP-values (<0.01), which are equivalent to genesi≤102. (B) The first and second PC loading attributed to each sample. Black: 1≤j≤25, red: 26≤j≤50, green: 51≤j≤75, blue: 76≤j≤100. (C) Regression analysis,Cj=av1j+bv2j. Black:Cj, red: fitted results. Blue:C0
j. (D) Regression analysis,Sj=av1j+bv2j. Black:Sj, red: fitted results. Blue:S0j. (PDF 402 kb)
Additional file 10: Figure S3.Detailed results obtained from mclust (Gaussian mixture). (PDF 30.5 kb)
Additional file 11: Table S7.Enrichment analyses by g:profiler for the YMC genes that correspond to Figure 9A to 9E. (PDF 229 kb)
Additional file 12: Table S8.Enrichment analyses by g:profiler for YCDC, cdc28-13 cells from the study by Cho et al [20], genes that correspond to Figure 9F to 9J. (PDF 1259 kb)
Additional file 13:Document S2. Performances of four other unsupervised clustering methods. (PDF 252 kb)
Additional file 14: Figure S4.Relationship between figures and tables. (PDF 114 kb)
Additional file 15:Reviewer reports and AU response to reviewers. (DOCX 35.8 kb)
Abbreviations
BH, Benjamini and Hochberg; BIC, Bayesian information criterion; BP, biological process; CC, cellular component; DAVID, the database for annotation, visualization and integrated discovery; FE, feature extraction; GEO, gene expression omnibus; GO, gene ontology; ICA, independent component analysis; KEGG, Kyoto encyclopedia of genes and genomes; MF, molecular function; PC, principal component; PCA, principal component PI, protein-protein interactions; YCDC, yeast cell division cycle; YMC, yeast metabolic cycle
Competing interests
The author declares that he has no competing interests.
Authors’ contributions
YHT planned and performed all analyses and wrote the paper.
Acknowledgements
This work was supported by the Japan Society for the Promotion of Science, KAKENHI (No. 26120528). I would like to thank the constructive comments from two reviewers (Additional file 15).
Funding
This work was supported by the Japan Society for the Promotion of Science, KAKENHI (No. 26120528). Funding agency was committed with none of the design of the study and collection, analysis, and interpretation of data and in writing the manuscript.
Availability of data and materials
All of data sets were downloaded from GEO and cyclebase. Thus, freely available for all people.
Received: 8 October 2015 Accepted: 26 May 2016
References
1. Taguchi YH, Iwadate M, Umeyama H. Principal component analysis-based unsupervised feature extraction applied to in silico drug discovery for posttraumatic stress disorder-mediated heart disease. BMC Bioinforma. 2015;16(1):139. 2. Taguchi Y-h, Iwadate M, Umeyama H, Murakami Y, Okamoto A. Heuristic principal component analysis-aased
unsupervised feature extraction and its application to bioinformatics In: Wang B, Li R, Perrizo W, editors. Big Data Analytics in Bioinformatics and Healthcare. Pennsylvania: IGI global; 2015. p. 138–62.
3. Taguchi Y-h, Okamoto A. Principal component analysis for bacterial proteomic analysis In: Shibuya T, Kashima H, Sese J, Ahmad S, editors. Pattern Recognition in Bioinformatics. LNCS, vol. 7632. New York: Springer; 2012. p. 141–52. 4. Murakami Y, Toyoda H, Tanahashi T, Tanaka J, Kumada T, Yoshioka Y, Kosaka N, Ochiya T, Taguchi YH.
5. Ishida S, Umeyama H, Iwadate M, Taguchi YH. Bioinformatic screening of autoimmune disease genes and protein structure prediction with FAMS for drug discovery. Protein Pept Lett. 2014;21(8):828–39.
6. Taguchi YH, Murakami Y. Principal component analysis based feature extraction approach to identify circulating microRNA biomarkers. PLoS ONE. 2013;8(6):66714.
7. Kinoshita R, Iwadate M, Umeyama H, Taguchi YH. Genes associated with genotype-specific DNA methylation in squamous cell carcinoma as candidate drug targets. BMC Syst Biol. 2014;8 Suppl 1:4.
8. Taguchi YH, Murakami Y. Universal disease biomarker: can a fixed set of blood microRNAs diagnose multiple diseases? BMC Res Notes. 2014;7:581.
9. Murakami Y, Tanahashi T, Okada R, Toyoda H, Kumada T, Enomoto M, Tamori A, Kawada N, Taguchi YH, Azuma T. Comparison of Hepatocellular Carcinoma miRNA Expression Profiling as Evaluated by Next Generation Sequencing and Microarray. PLoS ONE. 2014;9(9):106314.
10. Umeyama H, Iwadate M, Taguchi YH. TINAGL1 and B3GALNT1 are potential therapy target genes to suppress metastasis in non-small cell lung cancer. BMC Genomics. 2014;15 Suppl 9:2.
11. Taguchi Y-h. Integrative analysis of gene expression and promoter methylation during reprogramming of a non-small-cell lung cancer cell line using principal component analysis-based unsupervised feature extraction. In: Intelligent Computing in Bioinformatics. LNCS, vol. 8590. Heidelberg: Springer; 2014. p. 445–55.
12. Taguchi YH. Identification of more feasible microRNA-mRNA interactions within multiple cancers using principal component analysis based unsupervised feature extraction. Int J Mol Sci. 2016;17(5):696.
13. Tu BP, Kudlicki A, Rowicka M, McKnight SL. Logic of the yeast metabolic cycle: temporal compartmentalization of cellular processes. Science. 2005;310(5751):1152–8.
14. Reimand J, Arak T, Vilo J. g:Profiler–a web server for functional interpretation of gene lists (2011 update). Nucleic Acids Res. 2011;39(Web Server issue):307–15.
15. Szklarczyk D, Franceschini A, Wyder S, et al. STRING v10: protein-protein interaction networks, integrated over the tree of life. Nucleic Acids Res. 2015;43(Database issue):447–52.
16. Santos A, Wernersson R, Jensen LJ. Cyclebase 3.0: a multi-organism database on cell-cycle regulation and phenotypes. Nucleic Acids Res. 2015;43(Database issue):1140–4.
17. de Lichtenberg U, Wernersson R, Jensen TS, Nielsen HB, Fausbøll A, Schmidt P, Hansen FB, Knudsen S, Brunak S. New weakly expressed cell cycle-regulated genes in yeast. Yeast. 2005;22(15):1191–201.
18. Pic A, Lim FL, Ross SJ, Veal EA, Johnson AL, Sultan MR, West AG, Johnston LH, Sharrocks AD, Morgan BA. The forkhead protein Fkh2 is a component of the yeast cell cycle transcription factor SFF. EMBO J. 2000;19(14):3750–761. 19. Bulmer R, Pic-Taylor A, Whitehall SK, Martin KA, Millar JB, Quinn J, Morgan BA. The forkhead transcription factor
Fkh2 regulates the cell division cycle of Schizosaccharomyces pombe. Eukaryot Cell. 2004;3(4):944–54.
20. Cho RJ, Campbell MJ, Winzeler EA, Steinmetz L, Conway A, Wodicka L, Wolfsberg TG, Gabrielian AE, Landsman D, Lockhart DJ, Davis RW. A genome-wide transcriptional analysis of the mitotic cell cycle. Mol Cell. 1998;2(1):65–73. 21. Gauthier NP, Larsen ME, Wernersson R, de Lichtenberg U, Jensen LJ, Brunak S, Jensen TS. Cyclebase.org–a
comprehensive multi-organism online database of cell-cycle experiments. Nucleic Acids Res. 2008;36(Database issue):854–9.
22. Balakrishnan R, Park J, Karra K, Hitz BC, Binkley G, Hong EL, Sullivan J, Micklem G, Cherry JM. YeastMine–an integrated data warehouse for Saccharomyces cerevisiae data as a multipurpose tool-kit. Database (Oxford). 2012;2012:062.
23. Zuberi K, Franz M, Rodriguez H, Montojo J, Lopes CT, Bader GD, Morris Q. GeneMANIA prediction server 2013 update. Nucleic Acids Res. 2013;41(Web Server issue):115–22.
24. Benjamini Y, Hochberg Y. Controlling the false discovery rate: A practical and powerful approach to multiple testing. J R Stat Soc Ser B Methodol. 1995;57(1):289–300.
25. Huang daW, Sherman BT, Lempicki RA. Systematic and integrative analysis of large gene lists using DAVID bioinformatics resources. Nat Protoc. 2009;4(1):44–57.
26. Nakahira Y, Katayama M, Miyashita H, Kutsuna S, Iwasaki H, Oyama T, Kondo T. Global gene repression by KaiC as a master process of prokaryotic circadian system. Proc Natl Acad Sci USA. 2004;101(3):881–5.
27. Tamayo P, Slonim D, Mesirov J, Zhu Q, Kitareewan S, Dmitrovsky E, Lander ES, Golub TR. Interpreting patterns of gene expression with self-organizing maps: methods and application to hematopoietic differentiation. Proc Natl Acad Sci USA. 1999;96(6):2907–912.
28. Rowicka M, Kudlicki A, Tu BP, Otwinowski Z. High-resolution timing of cell cycle-regulated gene expression. Proc Natl Acad Sci USA. 2007;104(43):16892–97.
29. Schiilkopf B. The kernel trick for distances. In: Advances in Neural Information Processing Systems 13: Proceedings of the 2000 Conference. Cambridge, USA: MIT Press; 2001. p. 301.
30. Hyvärinen A. Fast and robust fixed-point algorithms for independent component analysis. IEEE Trans Neural Netw. 1999;10(3):626–34.
31. Taguchi YH. Identification of aberrant gene expression associated with aberrant promoter methylation in primordial germ cells between E13 and E16 rat F3 generation vinclozolin lineage. BMC Bioinforma. 2015;16 Suppl 18:16. 32. Taguchi YH, Iwadate M, Umeyama H. Heuristic principal component analysis-based unsupervised feature
extraction and its application to gene expression analysis of amyotrophic lateral sclerosis data sets. In:
Computational Intelligence in Bioinformatics and Computational Biology (CIBCB), 2015 IEEE Conference On; 2015. p. 1–10. doi:10.1109/CIBCB.2015.7300274.
33. Murakami Y, Kubo S, Tamori A, Itami S, Kawamura E, Iwaisako K, Ikeda K, Kawada N, Ochiya T, Taguchi YH. Comprehensive analysis of transcriptome and metabolome analysis in Intrahepatic Cholangiocarcinoma and Hepatocellular Carcinoma. Sci Rep. 2015;5:16294.
34. R Core Team. R: A Language and Environment for Statistical Computing. Vienna: R Foundation for Statistical Computing; 2014. http://www.R-project.org/. Accessed 8 Oct 2015.
![Fig. 4 Number of biological terms enriched in each experiment (YCDC [16]). Key for color bars and individualfile 1: Table S1F and Additional file 6: Table S4D,S1F, Additional file 1: Table S1H and Additional file 6: Table S4F, andAdditional file 1: Table S1G and Additional file 6: Table S4E,experiments: gray bars correspond to Additional file 5: Figure S1A, Additional file 1: Table S1C and Additionalfile 6: Table S4A, black bars correspond to Additional file 5: Figure S1B, Additional file 1: Table S1D andAdditional file 6: Table S4B, magenta bars correspond to Additional file 5: Figure S1C, Additional file 1: TableS1E and Additional file 6: Table S4C, green bars correspond to Additional file 5: Table Figure S1D, Additional blue bars correspond to Additional file 5: Figure S1E, cyan bars correspond to Additional file 5: Figure pink bars correspond to Additional file 5:Figure S1G, Additional file 1: Table S1I and Additional file 6: Table S4G](https://thumb-us.123doks.com/thumbv2/123dok_us/356046.1528165/7.595.119.477.84.370/individualfile-additional-andadditional-additional-additionalfile-andadditional-additional-additional.webp)
![Table 1 Top five GO BP term/publication enrichments reported by YeastMine [22] in genes identified by either PCA based unsupervised FE or cyclebase](https://thumb-us.123doks.com/thumbv2/123dok_us/356046.1528165/10.794.63.701.147.442/table-publication-enrichments-reported-yeastmine-identified-unsupervised-cyclebase.webp)
![Fig. 6 Gene-gene interactions identified by GeneMania [23]. Genes identified by (FE and (predicted,a) PCA based unsupervisedb) cyclebase](https://thumb-us.123doks.com/thumbv2/123dok_us/356046.1528165/11.595.117.481.542.724/interactions-identified-genemania-genes-identified-predicted-unsupervisedb-cyclebase.webp)