RESEARCH ARTICLE
Adsorption of copper (II) on mesoporous
silica: the effect of nano-scale confinement
Andrew W. Knight, Austen B. Tigges and Anastasia G. Ilgen
*Abstract
Nano-scale spatial confinement can alter chemistry at mineral–water interfaces. These nano-scale confinement effects can lead to anomalous fate and transport behavior of aqueous metal species. When a fluid resides in a nano-porous environments (pore size under 100 nm), the observed density, surface tension, and dielectric constant diverge from those measured in the bulk. To evaluate the impact of nano-scale confinement on the adsorption of copper (Cu2+), we performed batch adsorption studies using mesoporous silica. Mesoporous silica with the narrow distribu-tion of pore diameters (SBA-15; 8, 6, and 4 nm pore diameters) was chosen since the silanol funcdistribu-tional groups are typical to surface environments. Batch adsorption isotherms were fit with adsorption models (Langmuir, Freundlich, and Dubinin–Radushkevich) and adsorption kinetic data were fit to a pseudo-first-order reaction model. We found that with decreasing pore size, the maximum surface area-normalized uptake of Cu2+ increased. The pseudo-first-order kinetic model demonstrates that the adsorption is faster as the pore size decreases from 8 to 4 nm. We attribute these effects to the deviations in fundamental water properties as pore diameter decreases. In particular, these effects are most notable in SBA-15 with a 4-nm pore where the changes in water properties may be responsible for the enhanced Cu mobility, and therefore, faster Cu adsorption kinetics.
Keywords: Nano-scale confinement, Adsorption isotherm, Adsorption kinetics, Mesoporous silica
© National Technology of Engineering Solutions of Sandia, LLC 2018. This article is distributed under the terms of the Creative Commons Attribution 4.0 International License (http://creat iveco mmons .org/licen ses/by/4.0/), which permits unrestricted use, distribution, and reproduction in any medium, provided you give appropriate credit to the original author(s) and the source, provide a link to the Creative Commons license, and indicate if changes were made. The Creative Commons Public Domain Dedication waiver (http://creat iveco mmons .org/publi cdoma in/zero/1.0/) applies to the data made available in this article, unless otherwise stated.
Introduction
Developing a better understanding of the chemistry at mineral surfaces is critical to predict the fate and trans-port of chemical species in soils, sediments, and in porous rocks [1]. Interfacial processes, taking place at the atomic scale: ~ 10−10 m can manifest all the way to
the scale of planet Earth: ~ 107 m, and the chemistry at
surfaces depend on the spatial environment of the sur-face [2]. Nano-scale confined domains are ubiquitous in the environment and exist in tight rocks (i.e. shale), where large fraction of pores are in the nano-scale range [2, 3]. These domains have been recognized as an impor-tant factor in the selective permeability of tight rocks, a phenomenon largely attributed to the compressed elec-trical double layer at the water–solid interface as the pores decrease in size [2]. These nano-scale domains can be defined as microporous (< 2 nm pore diameter), mesoporous (2–50 nm pore diameter), and macroporous
(> 50 nm pore diameter) [4, 5]. When fluids reside in these nano-pores, the observed thermodynamic proper-ties of these systems deviate from those measured in bulk non-confined phases [6]. Previous research has shown, that with decreasing pore size, the fundamental prop-erties of water change, which is expected to affect the adsorption of ions at mineral–water interfaces. Examples of these deviations in water properties include a decrease in the dielectric constant (as much as a 50% decrease with a 1.2 nm pore) [7, 8], density, and surface tension when the pore size is less than 5 nm [9]. These deviations are largely attributed to the high ratio of mineral-surface-bound (structured) water in nano-scale confined systems relative to bulk water [9].
Stimulated by the advances in the nanotechnology industry, nanogeochemistry has emerged as an active field of research and has led to numerous observations of size-dependent phenomena, including metal adsorp-tion on mineral surfaces [2]. Propagated from changes in water properties, an observed decrease in the solvation energies and an increase in the formation of inner-sphere
Open Access
*Correspondence: [email protected]
complexes of metal cations can lead to enhanced adsorp-tion [2, 10, 11]. Research has demonstrated these effects, showing an enhanced adsorption of arsenic (As) on ordered mesoporous alumina compared to non-porous activated alumina [12], and enhanced copper (Cu) and uranium (U) adsorption with decreasing hematite par-ticle size [13, 14]. Furthermore, the adsorption mode for various adsorbed metals on zeolites with nanopores changed from outer sphere to inner sphere as the pore became smaller [15–17]. The adsorption of Cu on zeolites with narrow pores (0.26–0.74 nm) has been investigated with electron paramagnetic resonance spectroscopy and demonstrated an enhanced adsorption and increased inner sphere coordination in the zeolites with the small-est pores [15]. While these studies have illustrated the deviation in thermodynamic properties when mineral particles are limited to nano-scale, using natural mineral surfaces (i.e. hematite) or compared porous versus non-porous material, there has yet to be a study that takes a systematic approach to evaluate the adsorption proper-ties of metal cations as a function of discrete incremental changes in the pore size.
In this study, the adsorption of Cu2+ was evaluated on mesoporous silica. Copper was chosen as an analyte because it is an important naturally-occurring trace ele-ment with abundance in the Earth’s crust of 50 mg kg−1
[18]. Copper is mined for its wide use in industrial appli-cations, and as a result, can reach toxic concentrations in environmental systems [18–22]. At trace concentrations, Cu is essential for life, and is involved in many enzymatic reactions in mammals [18]. Industrially, Cu has appli-cations in the electrical industry, in the production of alloys, as a catalysis, and much more [18, 19]. As a result, the total anthropogenic discharge ranges from 35,000 to 90,000 metric tons per year [18]. Therefore, Cu is a common environmental pollutant where most of the Cu release is resulting from acid mine drainage and landfill leachates [19]. Understanding the adsorption properties of Cu and how the adsorption properties are impacted by nano-scale confinement is important in broadening our understanding of the fate and transport of Cu in a variety of complex environmental and geological systems. Addi-tionally, using Cu2+ to probe the reactivity of confined interfaces, allowed us to quantify size-dependent behav-ior. Previous research has investigated the adsorption of Cu2+ on functionalized ordered mesoporous silica and alumina to assess Cu2+ removal for water treatment pur-poses [21–23]. Adsorption was significantly enhanced by the addition of functional groups N-[3-(trimethoxysilyl) propyl]-ethylenediamine, from 0.036 mmol Cu g−1 on
unmodified silica to 0.261 mmol Cu g−1 on
functional-ized silica [22]. Modifying the silica substrate allowed for significant removal of Cu2+ from aqueous solution, but in
doing so, the pore geometry, volume, and reactivity were altered; and no longer represented an environmentally equivalent (e.g. silicate) system. To evaluate the effects of nano-scale confinement with environmentally relevant reactive surfaces, we focused on unmodified mesoporous silica to present the first study, to our knowledge, that directly investigated the impact of pore size on the Cu2+ adsorption kinetics and uptake.
Ordered mesoporous silica is an ideal candidate to assess the impacts of nano-scale confinement on the adsorption of Cu2+. These materials are synthetically produced via a surfactant template, creating chemically stable high surface area structures with uniform pores and a narrow distribution of pore diameters [23]. These synthetic mesoporous materials are representative of the reactive surface sites typical on mineral surfaces, contain-ing silanol functional groups (i.e. silicates) [24]. For our investigations, we utilized three analogues mesoporous silica substrates (SBA-15) with different size pore diame-ters, 8 nm 15-8), 6 nm 15-6), and 4 nm (SBA-15-4) diameter, all having cylindrical pore geometry. These SBA-15 siliceous materials are produced by tem-plating triblock copolymers to create a two-dimensional hexagonal array of non-intersecting cylindrical pores [25,
26]. This range of pore diameters (8, 6, and 4 nm) repre-sents the scale at which nano-scale confinement effects have been determined to be most significant [8, 9]. We hypothesized that the adsorption of Cu2+ on mesoporous silica is pore size dependent, and suspect, as pore size decrease and confined water properties emerge, Cu2+ adsorption will be enhanced.
The goal of this study was to systematically assess the surface complexation of Cu2+ under nano-scale con-finement in model mesoporous materials using batch adsorption isotherms and kinetics studies. The adsorp-tion isotherms were fit to adsorpadsorp-tion isotherm mod-els (Langmuir, Freundlich, and Dubinin–Radushkevich) to extract adsorption parameters, and pseudo-first-order kinetics model to extract rate constants. This data was used to evaluate the impact of nano-scale confinement on the surface area normalized adsorptive behavior of Cu2+ on mesoporous silica.
Experimental section General
All reagents used for batch adsorption studies were reagent grade or higher, including copper(II) nitrate trihydrate (Cu(NO3)2·3H2O), ammonium nitrate
(NH4NO3), nitric acid (HNO3), and ammonium
hydrox-ide (NH4OH) (Sigma-Aldrich, St. Louis, MO). Ultrapure
HNO3 (ULTREX II, J. T. Baker, Thermo Fisher Scientific,
via inductively coupled plasma mass spectrometer (ICP-MS) (NexION 350D, Perkin Elmer, Waltham, MA). All gasses and cryogenic liquids used for ICP-MS analysis and Brunauer–Emmett–Teller (BET) surface area analysis were ultrapure quality grade (Matheson, Basking Ridge, NJ) including liquid and gaseous argon (Ar) and nitrogen (N2), along with helium (He) gas. All mesoporous
materi-als were purchased from Sigma Aldrich (Sigma Aldrich, St. Louis, MO). These materials included SBA-15-8, SBA-15-6, SBA-16-4 correspond to hexagonally ordered cylindrical pores with diameters of 4, 6, and 8 nm. Milli-Q H2O (Barnstead NANOpure Diamond, resistivity of
18.2 MΩ*cm, 0.2 μm filtered and UV irradiated) was used in the preparation of all solutions and suspensions.
BET surface area and pore size determination
The BET surface area for each mesoporous material was obtained using two different BET surface area analyz-ers, an ASAP 2020 (Micrometrics, Norcross, GA) and a TriStar (Micrometrics, Norcross, GA). The procedure on both instruments was the same. Approximately 200 mg of dry mesoporous material was transferred into a tarred BET tube equipped with an airtight cap. The samples were degassed at 300 °C for 4 h and backfilled with inert He gas. Following the sample degas, the mass of the sample was updated to account for mass changes in the resulting from the degas. Next, the liquid N2 Dewar was
filled, a thermal jacket was placed on the BET tube, the tube was placed in the sample holder, and the analysis was started. The surface area analyzer determined the BET surface area and the non-local density functional theory (NLDFT) method was used to determine pore diameter and volume for each SBA-15 substrate [26, 27].
Thermogravimetric analysis
Thermogravimetric analysis (TGA; Thermal Analysis, SDT Q600, New Castle, DE) was performed on SBA-15-4, SBA-15-6, and SBA-15-8 to estimate the hydroxyl group density. Prior to analysis each silica material was thoroughly rinsed and dried. Briefly, approximately 600 mg of mesoporous material was added to centri-fuge bottle with 200 mL of Milli-Q water and mixed on a shaker table (Orbital-Genie, Scientific Industries, INC, Bohemia, New York). Following shaking for 24 h the materials were filtered (45 μm, Pall Corporation, Ann Arbor, MI), and rinsed with Milli-Q water and sus-pended in 200 mL of Milli-Q water. This process was repeated two additional times. Following the final rinse, the mesoporous materials were transferred to a scintilla-tion vial and placed in the oven (45 °C) for at least 48 h. Once dry, roughly 10 mg silica was transferred to a tarred TGA crucible (100 μL, Robocasting, Albuquerque, NM) and placed in the TGA furnace. The flow rate of Ar was
100 mL/min with an experimental sequence: (i) 20 min room temperature isothermal to equilibrate, (ii) ramp temperature at 10 °C/min from room temperature to 1000 °C.
Batch adsorption and adsorption isotherms
Batch adsorption isotherm experiments were performed to evaluate the adsorption of Cu2+ on 15-8, SBA-15-6, and SBA-15-4. The SBA-15 materials were rinsed prior to use, as described above (same method as TGA). Following being rinsed and dried, approximately 20 mg was weighed out and transferred to a 50 mL centrifuge tube with 5 mL of 10 mM NH4NO3 and rehydrated for
at least 24 h. The electrolyte, NH4NO3, was chosen as
the background electrolyte to prevent adding any metal cationic species to compete for surface adsorption sites. Following 24 h, Cu(NO3)2 was added to each 50 mL
cen-trifuge tube with a concentration of Cu2+ ranging from 5 to 300 μM from a stock Cu(NO3)2 solution and brought
up to 10 mL total volume with Milli-Q water. The pH was adjusted using dilute solutions of HNO3 and NH4OH to
achieve a final pH of 6.0 ± 0.1 and final ionic strength of 10 ± 1 mM. Under these experimental conditions the dominant aqueous Cu species is Cu2+ (roughly 96%, estimated using Visual MINTEQ 3.1) [28]. A detailed Cu speciation diagram is provided in Additional file 1: Figure S1. The contents were mixed via shaker table for 24 h. After mixing, the samples were centrifuged (Allegra 25R, Beckman Coulter, Indianapolis, IN) at 3000 rpm for 10 min to separate the solid mesoporous silica from the supernatant electrolyte solution. To fully separate the phases and remove any suspended mesoporous silica, the supernatant was transferred to a 10 mL syringe fit with a 0.20 μm nylon filter (Millex-GN, EMD Millipore, Bill-erica, MA) and the contents pushed through to a 15 mL centrifuge tube. Ultra pure 6 M HNO3 was added to each
sample (10 μL mL−1) for sample preservation to keep
Cu2+ cations from hydrolyzing and precipitating.
The samples were diluted to a concentration range suit-able for Cu quantification via ICP-MS (10–2000 ppb). Dilutions were performed using Ultrapure 2% HNO3 by
a factor of 2, 5, 10, or 50 and kept in the refrigerator until the ICP-MS analysis. The experimental data was fit to three adsorption isotherm models: Langmuir, Freundlich, and Dubinin–Radushkevich.
Langmuir adsorption isotherm
The Langmuir adsorption model represents homogenous adsorption behavior in which the adsorbate occurs at def-inite sites and does not exceed monolayer coverage [29,
are all equally probable for adsorption [29, 31, 32]. The Langmuir adsorption equation is shown in Eq. 1 [29, 33],
where KL is the Langmuir constant (L/μmol), and qm−L
is the surface area normalized maximum adsorption of Cu (μmol/m2). The experimental data was fit to the
lin-ear form of the Langmuir adsorption isotherm is shown in Eq. 2.
From the Langmuir adsorption model we estimated the dimensionless equilibrium parameter (RL) shown in
Eq. 3.
The equilibrium parameter provides an understand-ing of the favorability of the adsorption as a function of the initial concentration of adsorbate, when RL > 1 the
adsorption is unfavorable, 0 < RL < 1 the adsorption is
favorable, and when R = 0 the adsorption is irreversible [30, 34].
Freundlich adsorption isotherm
In contrast to the Langmuir adsorption model, in which surface does not exceed monolayer coverage of the adsorbate, the Freundlich adsorption model describes heterogeneous adsorption behavior in which the adsorp-tion coverage can exceed monolayer coverage [35]. The Freundlich adsorption equation is shown in Eq. 4,
where KF is related to the surface area normalized
maxi-mum adsorption of Cu (μmol/m2) and n is dimensionless
term that indicates the extent of surface heterogeneity. The linear form of the Freundlich adsorption model is shown in Eq. 5.
It should be noted that the Freundlich isotherm does not accurately determine the absolute maximum adsorbed Cu [36]. This is due to the fact that qe is directly
proportional to [Cu2+]
eq, and therefore qe will increase (1)
qe=
KLqm−L[Cu]eq 1+KL[Cu]eq
(2) 1
qe
= 1
qm−L
+ 1
KLqm[Cu]eq
(3) RL=
1 1+KL[Cu]inital
(4) qe=KF[Cu]
1
n
eq
(5) logqe=logKF+
1
nlog [Cu]eq
as [Cu2+]
eq increases. Yet, the KF value can be used as a
qualitative comparison to assess the relative adsorption maximum values of Cu on mesoporous silica surfaces.
Dubinin–Radushkevich adsorption isotherm
The final adsorption isotherm considered to evalu-ate the adsorption of Cu on mesoporous mevalu-aterials was the Dubinin–Radushkevich adsorption isotherm. This empirical adsorption model was first used to describe a pore filling mechanism and is generally used to express adsorption processes that occur via homogeneous and heterogeneous processes [37]. Equation 6 is the Dubinin– Radushkevich adsorption model,
where qm−DR is the maximum surface area normalized
amount of Cu adsorbed on the mesoporous surfaces (μmol/m2), and k
DR is proportional to the adsorption
energy (mol2/kJ2). The Polanyi potential, ε, is defined by
Eq. 7 [38],
where R is the gas constant (kJ/K*mol) and T is the tem-perature (K). The linear form of the Dubinin–Radushk-evich adsorption model is shown by Eq. 8.
The fitting parameters qm−DR and kDR are determined
by the intercept and slope, respectively, of a the linear line when plotted ln (qe) versus ε2.
Kinetic studies
Kinetic studies were performed to determine the rate law of the Cu adsorption on mesoporous materials, and to quantify the effect of nano-scale confinement on the adsorption rates. For these studies, 100 mg of hydrated mesoporous silica was transferred to a 100 mL beaker with 25 mL of 10 mM NH4NO3, a stir bar set to
vigor-ously mix the solution at 300 rpm and enough DI water to achieve a final volume of 50 mL. The solution pH was adjusted using HNO3 and NH4OH to a pH = 6.0 ± 0.1.
Following the pH adjustment, a known amount of Cu2+ was spiked into the solution (5–10 μM Cu). The time and pH were recorded at this point and represented time = 0. The pH was continuously monitored by the pH probe as 3 mL aliquots were removed at set time points during the experiment and transferred to a 10 mL syringe and filtered into a 15 mL centrifuge tube containing 30 μL ultra pure 6 M HNO3. The kinetic studies ran for 6 h to (6)
qe=qm−DR∗e−kDRε2
(7)
ε=RT ∗ln
1+ 1 [Cu]eq
(8)
establish an equilibrium value for adsorbed Cu (qe). This
procedure was repeated at three concentrations of Cu2+ for each silica material.
Following the kinetic experiments, the samples repre-senting unique time points (minutes) were diluted by a factor of 3 with Ultrapure 2% HNO3 for Cu quantification
by ICP-MS. The diluted samples were kept in the refrig-erator until sample analysis for Cu.
Pseudo‑first‑order adsorption kinetics
Batch kinetic adsorption studies were performed and fit to a pseudo-first-order reaction model. The rate con-stants for the adsorption of Cu on SBA-15-4, SBA-15-6, and SBA-15-8 were determined from the model fit. The pseudo-first-order reactions occur when the reaction is second order, however, one of the reactants is in excess and largely remains unchanged [39]. In this case, three different dilute initial Cu2+ concentrations were reacted with 100 mg of mesoporous material. This is consistent with the fact that we had low Cu2+ concentrations and high silica reactive surface area.
The rate law representing a pseudo-first-order reaction is shown in Eq. 9.
Since the concentration of the reactive surface is in excess and essentially remains unchanged throughout the reaction coordinate, the rate equation can be reduced to Eq. 10:
where k′ is related to k and the reactive surface concerta-tion [39]. The integrated pseudo-first-order rate equation is shown in Eq. 11,
where, qe is the equilibrium adsorbed Cu, qt is the adsorbed Cu at time = t, k is the pseudo-first-order rate constant (min−1), and t is time (min).
Copper analysis
The Cu content in each sample was quantified by ICP-MS as described previously [40]. Briefly, standards
(9) Rate=k∗[ReactiveSurface][Cu]
(10)
Rate=k′[Cu]
(11) ln(qe−qt)=lnqe−kt
were prepared with concentrations ranging from 10 to 2000 ppb and used to generate a calibration curve to determine concentration of Cu in each sample from intensity. The stock solutions and reference solutions of identical experimental matrix (in the absence of SBA-15) were analyzed with the samples. The surface area nor-malized amount of adsorbed Cu (q), in μmol/m2, was
determined from Eq. 12:
where [Cu]i and [Cu]eq are the initial and equilibrium
concentrations (measured by ICP-MS) of Cu in μM, v is the volume in L, m is the mass of mesoporous material in g, and A is the surface area of that mesoporous materi-als as determined by BET surface area analyzer in m2/g.
The q values were then used to determine adsorption iso-therm fits and kinetic rates of Cu adsorption on SBA-15-8, SBA-15-6, and SBA-15-4 substrates.
Results and discussion
From studies investigating Cu adsorption on SBA-15-8, SBA-15-6, and SBA-15-4, we systemically evaluated the effects of nano-scale confinement. The sum of these effects provide insight into how nano-scale confinement can enhance metal adsorption in meso- and nano-porous materials.
BET surface area and pore size distribution
The BET surface areas, pore diameters, pore volumes, and percent pore surface area were determined for each SBA-15 used in this study. The results are summarized in Table 1. Surface area and pore size distributions were evaluated on two different BET analyzers as the experi-mental surface area trend did not agree with the surface areas provided by the supplier. However, the average pore diameter trend did agree with the supplier reported value. We observed a decrease in the total BET surface areas of 661 ± 5 m2/g, 603 ± 16, and 582 ± 13 m2/g as the
pore size decreased from 7.0 ± 0.3, 5.2 ± 0.2, 4.4 ± 0.1 nm for SBA-15-8, SBA-15-6, and SBA-15-4, respectively. Furthermore, a recent study demonstrated a similar trend
(12) q=
[Cu]i−[Cu]eq
∗v
(m∗A)
Table 1 Pore size and BET surface area of SBA-15-8, SBA-15-6, and SBA-15-4
The BET surface areas were used to calculate the surface area normalized Cu adsorption
Material Pore size (nm) BET surface area
(m2/g) Pore volume (cm
3/g) % surface area
from pores –OH-density (–OH/nm2)
with synthesized SBA-15 substrate, as the pore diam-eter decreased, the BET surface area decreased as well [25]. The experimental values of the BET surfaces areas reported in Table 1 were used to normalize the adsorp-tion of Cu to the total surface area of the substrate.
The pore diameters were determined using the NLDFT method [26, 27]. The pore size distribution plots are shown in Additional file 1: Figure S2. The mesopore diameter is relatively narrow distribution resulting in average pore diameters and volumes reported in Table 1. As reported in previous pore size distributions of SBA-15 materials, there are micropores present as well [26,
41, 42]. The mesopores exist in the main channels as templated from the removal of the calcined surfactant, whereas the micropores co-exist due to intrawall pores that develop as a consequence of the removal of the sur-factant template creating structural irregularities [43]. This can be seen in the SBA-15-4 plot (Additional file 1: Figure S2), in which the pore size distribution is bimodal with peaks centered around 4.4 and 2 nm. In contrast, the SBA-15-8 (Additional file 1: Figure S2) shows a pri-mary contribution from the mesopores centered around 8 nm, and a small contribution of micropores centered around 2 nm. For this study, we considered the average pore size diameter to assess the effects of nano-scale con-finement. While the observed effects may be attributed to the increased presence of micropores, the micropores are defined by one data point and we believe appropriate nano-scale confinement conclusions can be drawn from adsorption deviations of Cu with these substrates.
Thermogravimetric analysis
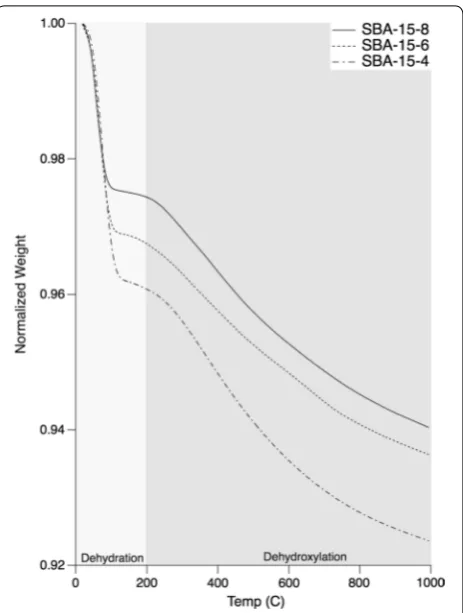
The results of the TGA analysis are shown in Fig. 1. This plot shows the percent mass loss of 8, SBA-15-6, and SBA-15-4 as a function of temperature. From the TGA plots the surface –OH group density was estimated and reported in Table 1. The first observable mass loss feature in Fig. 1 between 20 and 200 °C was attributed to presence of physisorbed water [44]. Following the water loss, the mass loss from 200 to 1000 °C was primar-ily attributed to surface dehydroxylation [44]. There are likely to be internal –OH groups, however, these groups are not typically dehydroxylated until > 900 °C [44]. As a result, the average –OH surface densities (–OH/nm2)
were determined to be 1.8 ± 0.2, 1.9 ± 0.2, 2.1 ± 0.2 for SBA-15-8, SBA-15-6, and SBA-15-4, respectively. These –OH surface densities strongly agree with previously reported accessible –OH densities of SBA-15 of 1.7 – OH/nm2 [45, 46]. The –OH density also corresponds
with the observed wettability, as seen by the magnitude of desorption of physisorbed water. An increase in the –OH density would lead to a more hydrophilic surface.
The –OH group density appears to inversely correlate with the pore size.
Cu adsorption isotherms and nano-scale confinement effects
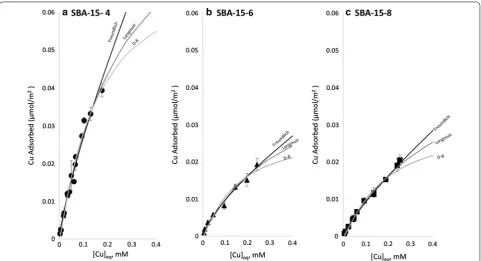
The adsorption of Cu on SBA-15-8, SBA-15-6, and SBA-15-4 are shown in Fig. 2, where the amount of Cu (μmol m−2) adsorbed was plotted versus the equilibrium
concentration of Cu2+. The data was fit to adsorption isotherm models: Langmuir [29], Freundlich [35], and Dubinin–Radushkevich [37]. Copper adsorption onto the surface of SBA-15 was poor overall, with the maxi-mum measured surface loading of Cu of 0.020 ± 0.001, 0.019 ± 0.002, and 0.039 ± 0.002 μmol m−2 of substrate
for SBA-15-8, SBA-15-6, and SBA-15-4, respectively, when [Cu]initial = 300 μM. The maximum measured
sur-face loading of Cu was equal within experimental error for SBA-15-8 and SBA-15-6, however for SBA-15-4, the maximum measured surface loading was nearly double. While we did observe differences in the surface –OH group densities (1.8 vs 2.1 –OH/nm2 for SBA-15-8 and
SBA-15-4), we believe those differences are not suffi-cient to explain the observed differences between SBA-15-4 over SBA-15-6 and SBA-15-8. To add, the available reactive surface –OH sites remained in 100-fold excess to the maximum Cu values all cases. Because the num-ber of –OH groups remains in 100-fold excess over adsorbed Cu atoms, we believe that the observed differ-ences in adsorption should be attributed to the effects of nano-scale confinement. Likewise, the estimated percent of occupied –OH surface sites (assuming mono-dentate inner-sphere Cu adsorption complex [19]) never exceed 1%. These calculations may suggest that Cu requires a specific surface conformation of silanol groups to bind [46]. This hypothesis will be investigated by X-ray adsorption spectroscopic studies.
The adsorption of Cu was fit to Langmuir, Freundlich, and Dubinin–Radushkevich isotherms using IGOR Pro 7 curve fitting using equations representing each model. For these studies pH = 6 was chosen because Cu2+ is the dominant aqueous species (Additional file 1: Figure S1, [Cu] = 0.1 mM), as well as our target initial concentra-tions of Cu2+ were below the solubility limit; however, at [Cu]initial > 0.3 mM, Cu began to precipitate. Further,
pH = 6 was chosen to maximize the adsorption of Cu, based on the previous adsorption studies which illus-trated that Cu was poorly adsorbed onto amorphous silica at pH < 6 [19, 20]. For these reasons; (i) limited Cu solubility, (ii) relatively poor Cu adsorption, all three adsorption isotherms were close to being linear (Fig. 2), and could be fit with either of the three isotherm models,
Fig. 2 Adsorption isotherm plots showing the adsorption of Cu on mesoporous materials. a Cu adsorption on SBA-15-4. b Cu adsorption on SBA-15-6 and c Cu adsorption on SBA-15-8 fit with Langmuir, Freundlich and Dubinin–Radushkevich isotherm models
Table 2 Fitting parameters obtained from the linear transformation of the data for Langmuir, Freundlich, and Dubinin– Radushkevich adsorption models
Material Langmuir fit Freundlich fit Dubinin–Radushkevich fit
Substrate KL, L/µmol qm−L, µmol/m2 r2 n KF (µmol/m2) r2 KD–R, mol2/kJ2 qm−DR µmol/m2 r2
as seen from r2 values > 96% (and most fits were > 99%) in
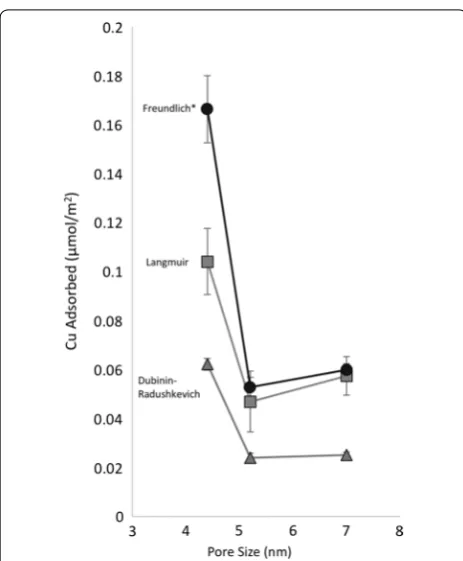
Table 2. The observed trends were consistent among each of the adsorption models. It was observed that SBA-15-4 had the largest uptake of Cu (normalized to the surface area), followed by SBA-15-6 and SBA-15-8; which were generally within experimental error as seen in Fig. 3 and Table 2. Figure 3 presents the surface area normalized adsorption maximum values as a function of pore size for each adsorption isotherm model. It is important to note, that as a result of the range limitation of the adsorption isotherm and low adsorption, the isotherms are limited to mostly the linear region. Because of this, the uncer-tainties of the maximum adsorption values are relatively large. Even so, the observed differences in the surface area normalized adsorption of Cu on silica with differ-ent pore sizes illustrates nano-scale confinemdiffer-ent effects. These effects are quantified from the terms qm−L, KF,
and qm−DR; referring the model determined maximum
adsorption value for Langmuir, Freundlich, and Dubinin– Radushkevich isotherm, respectively. While the adsorp-tion of Cu on SBA-15-8 and SBA-15-6 were within error (for Langmuir and Dubinin–Radushkevich) or slightly different (Freundlich), the adsorption of Cu on SBA-15-4
was significantly enhanced for all isotherm models. This observation agrees with previously reported results sug-gesting enhanced metal cation adsorption when pore sizes or particles are less than 5 nm [2, 9].
An assessment of the qualitative adsorption parame-ters (KL, n, and KD–R) shows that the adsorption affinities
are generally similar for all three silica materials [29, 35,
37]. The qualitative adsorption parameter KL and KD–R
(KD–R term in inversely proportional to adsorption
affin-ity) suggest the adsorption affinity in the Langmuir and Dubinin–Radushkevich isotherm models are pore size dependent, while n has no pore size dependency trend as shown in Table 2. These terms qualitatively describe the adsorption affinity, suggesting there may be an increased adsorption affinity of Cu as the pore size decreases.
Additional information can be gleaned from the values of KL. From the KL value, RL can be approximated from
Eq. 3. A plot of RL versus [Cu]initial (Additional file 1:
Fig-ure S3) estimates the reaction coordinate based upon dif-ferences in the KL values. The values of RL decrease with
increasing Cu2+ concentration and remain between 1 and 0. This shows, as Cu2+ increases in the system, sur-face sites become occupied, thus the sursur-face reaction decreases, but remains favorable. It was also found that the KL for SBA-15-4 pore was the lowest, indicating the
most rapid decay of the RL term as a function of [Cu]initial.
At the maximum [Cu]initial = 0.3 mM, the RL values are
0.63, 0.55 and 0.48 for 15-8, 15-6, and SBA-15-4, respectively. At the maximum adsorbed values of Cu, only 1% of the total –OH groups were occupied. The reactive surface sites are in excess compared to Cu and therefore the reaction favors the formation of surface complexes. Because these values are between 1 and 0, the surface adsorption reaction is still favorable; which sug-gests either, (i) the monolayer surface coverage has not reached a maximum value, or (ii) that multi-layer adsorp-tion (i.e. dimerizaadsorp-tion, polymerizaadsorp-tion, or precipitaadsorp-tion) occurs even at low surface coverages.
Additional work is planned to assess the coordination chemistry of Cu as a function of pore size to determine whether mechanistic changes result from nano-scale confinement. The current reaction condition, pH = 6, is above the point of zero charge, pzc, of SBA-15 silica
(pzc = 4.2) [47]. As a result, the silica surface is expected
to be negatively charged, and the electrostatic interac-tions could be driving forces leading to the adsorption of free Cu2+ cations onto the silica surface. Building off the X-ray absorption data analysis by Cheah et al., Cu forms inner-sphere surface complexes with amor-phous silica [19, 20]. Additional analyses observed short Cu–Cu distances (2.58–2.59 Å), suggesting the forma-tion of dimeric species adsorbed onto the amorphous silica surface. The bonding mode was concluded to be
mono-dentate, demonstrated from the presence of only one unique Cu–Si distance (~ 3.0 Å), whereas a biden-tate-bridging bonding mode would have resulted in two unique Cu–Si distances, distinguishable spectroscopi-cally [19, 20]. However, with decreasing pore size, to a pore regime where nano-scale confinement effects may become apparent, it is unclear if the adsorption mode and Cu adsorption complex geometry would remain con-stant. Ferreira et al. demonstrated that Cu contains two electron orbitals of similar energy, therefore is subject to Jahn–Teller distortion in its octahedral coordination environment—creating a weak point in the hydration shell [15, 17]. As a consequence, Cu was shown to change its coordination environment from outer-sphere to inner-sphere when adsorbed in narrow pores of mor-denite (limiting pore diameter 0.26 nm) [15, 17]. As shown by the significantly enhanced surface area normal-ized adsorption of Cu on SBA-15-4 over SBA-15-6 and SBA-15-8, our data may suggest changes in the adsorp-tion complex geometry due to changes in water prop-erties and steric strain of pore confinement. Our data agrees with previous studies showing that the changes in water properties and subsequent tendency for cations to form inner-sphere complexes preferentially enrich trace elements in nanopores [48, 49]. Wang et al. demonstrated a nearly 10-fold increase in the surface area normalized adsorption of both zinc (Zn2+) and arsenate (AsO
43−)
on nano-porous alumina compared to alumina particles. Wang et al. attributed the observed increase in adsorp-tion to the increase in the surface charge density inside nano-pores, and the impact of a larger proportion of structured water on ion hydration [2, 48, 50]. Further-more, another study of uranium U6+ adsorption and des-orption on mesoporous silica (MCM-41), demonstrated the formation of polymeric species—and eventual pre-cipitation—inside the pores [51]. It is possible that the surface area normalized adsorption of Cu is enhanced in small mesopores (4 nm) due to Cu losing it hydration shell thus increasing its reactivity towards dimerization and surface adsorption.
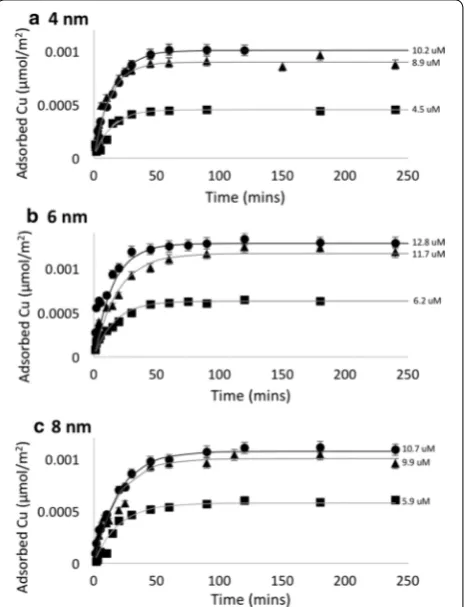
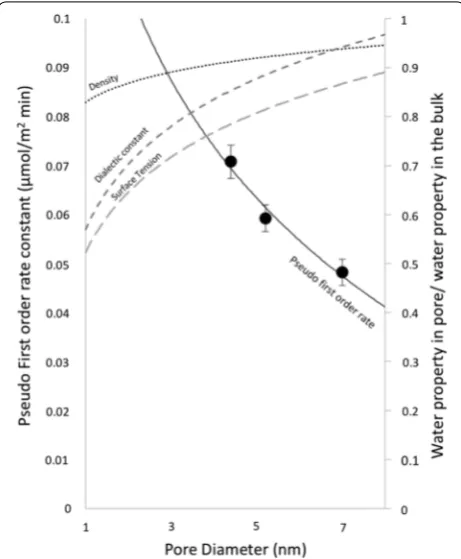
Effect of nano-scale confinement on adsorption kinetics The surface area-normalized time dependent Cu adsorp-tion on SBA-15-8, SBA-15-6, and SBA-15-4 fit with pseudo-first-order kinetic model is shown in Fig. 4. The adsorption rate constants were obtained from the slope of the linear regression fit to the integrated rate equation. The experimentally determined rate constants show that the adsorption of Cu on SBA-15-4 is fastest, as is summa-rized in Fig. 5. The rate constants representing the adsorp-tion kinetics of Cu on mesoporous silica are 0.048 ± 0.003, 0.059 ± 0.003, and 0.071 ± 0.003 μmol/m2min for
SBA-15-8, SBA-15-6, and SBA-15-4, respectively.
As seen in Fig. 5, the pseudo-first-order kinetic rates are inversely proportional to pore diameter; as the pore diameter decreases, the kinetic rate increases. Previous studies have summarized the dependence of surface ten-sion [9], density [9], and dielectric constant [8] of water. Those parameters were approximated from the publi-cations and added to Fig. 5 to compare to our data. As seen from Fig. 5, the changes in density, surface tension, and dielectric constant of water have a negative correla-tion with the adsorpcorrela-tion kinetics quantified in our study. From these trends, we have concluded that the rate of Cu adsorption could be related to the decrease in the surface tension, density, and dielectric constant of water. These changes in water properties could increase the propensity of Cu to lose its hydration sphere and from inner-sphere complexes with the surface. We believe it is reasonable that these changes in the water properties will impact the rate of adsorption of Cu; as the pore decreases in size, a decrease in surface tension and density would allow more rapid flow inside the pores; a decrease in the dielectric constant would lead to a decrease in the hydration energy of the Cu atom, thus allowing for more rapid adsorption on the surface.
Intraparticle diffusion
Further data interpretation of the Cu adsorption kinet-ics was evaluated using the Weber and Morris intrapar-ticle diffusion model [31, 33, 52, 53]. This model provides additional information regarding the modes of adsorp-tion and breaks down the adsorpadsorp-tion rate into external mass transfer and intraparticle diffusion steps [34]. The intraparticle model suggests that adsorption occurs via three steps:
1. External mass transfer of adsorbate from the bulk solution to the adsorbent surface;
2. Adsorbate diffusion from external surface into the adsorbent pores;
3. Adsorption of adsorbate at the surface reactive sites.
Step three is assumed to be rapid in comparison to the two diffusion steps; therefore, the overall rate is a com-bination of external mass transfer and intraparticle dif-fusion [31, 52]. The intraparticle diffusion plots were generated by plotting qt versus t0.5, as described in Eq. 13.
(13)
qt=kit0.5
where ki is the diffusion rate constant m2µ∗molmin0.5 . The
resulting plots from this model are best represented with a multi-linear regression. The multi-linearity represents the rate dependency on film diffusion early in the reac-tion, and the eventual rate dependence on intraparticle diffusion in later time regimes [21, 52]. For our analysis, we utilized the Piecewise Linear Regression (PLR) Excel Spreadsheet made available to us [52]. This spreadsheet performs a statistical analysis based upon F-ratio and evi-dence testing to determine the best fit of the intraparticle diffusion plot [52].
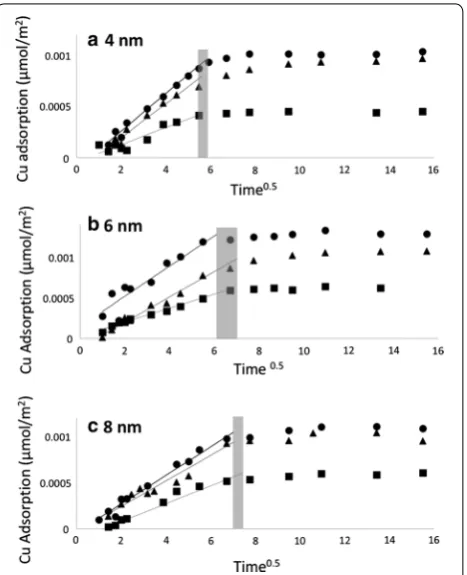
The intraparticle diffusion plots are shown in Fig. 6. Each intraparticle diffusion plot was fit using the PLR spreadsheet and fit with linear segments and breakpoints of those functions that best represented the system. As a general trend, our data shows adsorption begins with a period of rapid film diffusion, followed by subsequent slower adsorption step representing intraparticle dif-fusion, until equilibrium is reached. Each kinetic pro-file was fit with two linear segments and the slopes of the film diffusion section was fit to the plots in Fig. 6. The breakpoints were calculated to be 50 ± 2, 49 ± 1, and 32 ± 8 min for 8, 6, and SBA-15-4, respectively. These breakpoints were calculated as an average from various initial concentrations of Cu. From the breakpoints, the time regimes dependent on external mass transfer or intraparticle diffusion were established and fit with linear regression lines.
The slopes of linear segments, ki, describing the
exter-nal mass transfer for SBA-15-8, SBA-15-6, and SBA-15-4 represent the diffusion rate constant. The ki values versus
the qmax is shown in Fig. 7. As the qmax increases, the ki
value increases. This suggests that with higher [Cu2+] in the system, the external mass transfer from the bulk to the silica film is more rapid. This observed trend is true for all three SBA-15 substrates. Additionally, the curves in Fig. 7 for SBA-15-8 and SBA-15-6 are nearly identical, however the curve representing the relationship between ki and qeq for SBA-15-4 is different. From this plot, it can
be concluded that the film diffusion rate for Cu adsorp-tion on SBA-15-4 is more rapid than on the larger pores. Once again, this can be attributed to the net effects of changes to the water properties (i.e. dielectric constant, density, and surface tension) and subsequent interaction of water with Cu and water with the silica surface.
Conclusions and future work
This experimental study presents a systematic approach to quantify the effects of nano-scale confinement on metal adsorption. While nano-scale confinement effects have been observed in mesoporous systems, this is the
first, to our knowledge, study quantifying nano-scale con-finement effects on the adsorption of Cu on mesoporous silica. Through an analysis of the surface area normalized adsorption isotherms and adsorption kinetics of Cu on SBA-15-8, SBA-15-6, ad SBA-15-4, we concluded that nano-scale confinement enhances both the adsorption maximum, and Cu adsorption reaction rate. Evidence of this is shown in the significant increase in the surface area normalized adsorption maximum of Cu on SBA-15-4 compared to both SBA-15-6 and SBA-15-8 across all isotherm models. Further, the pseudo-first-order reac-tion rate constant increased with decreasing pore size. The intraparticle diffusion model was applied, and it illustrates that external mass transfer diffusion constant increases with decreasing pore size, and we postulate that this rapid film diffusion in 4 nm pores was responsible for the observed increase in reaction rate. Future work should address molecular-scale speciation of Cu associ-ated with mesoporous silica surfaces, using spectroscopic approaches.
We believe this study will aid in the understanding of the impacts of cation adsorption in geologically relevant mesopores. This will increase our ability to anticipate cation fate and transport in shales and tight rocks. Fur-ther studies are needed to assess the metal coordination environment as a function of pore size, and correlate any changes in coordination number or bond angles or dis-tances to the observed changes in macroscopic adsorp-tion behavior.
Authors’ contributions
AGI led project development, AGI and AWK designed experimental program and analyzed data. ABT assisted with data collection. All authors, contributed to writing the manuscript. All authors read and approved the final manuscript.
Acknowledgements
The authors would like to thank Eric Coker for collecting BET on mesoporous silica samples. This work was supported by the US Department of Energy, Office of Science, Office of Basic Energy Sciences, Chemical Sciences, Geosciences and Biosciences Division. Sandia National Laboratories is a multimission laboratory managed and operated by National Technology and Additional file
Additional file 1: Figure S1. A copper speciation diagram as a function of solution pH. Figure S2. The NLDFT pore size distribution plots of SBA-15-8, SBA-15-6, and SBA-15-4. Figure S3. A plot showing the Langmuir equilibrium parameter, RL, versus the initial copper concentration. Fig. 6 Intraparticle diffusion plots for the adsorption of Cu with on a
SBA-15-4, b SBA-15-6, and c SBA-15-8. The section of the intraparticle diffusion model representing the external mass transfer was fit with a linear regression line based upon Piecewise Linear Regression [52]. The shaded regions represent the time break points used for the slope analysis
Engineering Solutions of Sandia, LLC., a wholly owned subsidiary of Honeywell International, Inc., for the U.S. Department of Energy’s National Nuclear Secu-rity Administration under contract DE-NA-0003525.
Competing interests
The authors declare that they have no competing interests.
Publisher’s Note
Springer Nature remains neutral with regard to jurisdictional claims in pub-lished maps and institutional affiliations.
Received: 26 February 2018 Accepted: 8 June 2018
References
1. Weber WJ, Huang WL (1996) A distributed reactivity model for sorption by soils and sediments. 4. Intraparticle heterogeneity and phase-distribu-tion relaphase-distribu-tionships under nonequilibrium condiphase-distribu-tions—response. Environ Sci Technol 30(10):3130–3131
2. Wang YF et al (2003) Surface chemistry of mesoporous materials: effect of nanopore confinement. Struct Prop Relationsh Oxide Surf Interfaces II 751:121–125
3. Ilgen AG et al (2017) Shales at all scales: exploring coupled processes in mudrocks. Earth Sci Rev 166:132–152
4. Sing KSW et al (1985) Reporting physisorption data for gas solid systems with special reference to the determination of surface-area and porosity (Recommendations 1984). Pure Appl Chem 57(4):603–619
5. Logar NZ, Kaucic V (2006) Nanoporous materials: from catalysis and hydrogen storage to wastewater treatment. Acta Chim Slov 53(2):117–135
6. Levinger NE (2002) Water in confinement. Science 298(5599):1722–1723 7. Marti J et al (2006) Molecular dynamics simulation of liquid water
confined inside graphite channels: dielectric and dynamical properties. J Phys Chem B 110(47):23987–23994
8. Senapati S, Chandra A (2001) Dielectric constant of water confined in a nanocavity. J Phys Chem B 105(22):5106–5109
9. Takei T et al (2000) Changes in density and surface tension of water in silica pores. Colloid Polym Sci 278(5):475–480
10. Nelson JM et al (2014) Probing the mechanisms of pore size depend-ent geochemistry: effects of meso-confinemdepend-ent on Zn sorption in mesoporous silica. In: abstracts of papers of the American chemical society, vol 247
11. Zimmerman AR et al (2004) Protection of mesopore-adsorbed organic matter from enzymatic degradation. Environ Sci Technol 38(17):4542–4548
12. Kim YH et al (2004) Arsenic removal using mesoporous alumina prepared via a templating method. Environ Sci Technol 38(3):924–931
13. Madden AS, Hochella MF, Luxton TP (2006) Insights for size-dependent reactivity of hematite nanomineral surfaces through Cu2+ sorption. Geochim Cosmochim Acta 70(16):4095–4104
14. Zeng H et al (2009) Nanoscale size effects on uranium(VI) adsorption to hematite. Environ Sci Technol 43(5):1373–1378
15. Ferreira DR et al (2012) An electron paramagnetic resonance spec-troscopy investigation of the retention mechanisms of Mn and Cu in the nanopore channels of three zeolite minerals. Clays Clay Miner 60(6):588–598
16. Ferreira DR, Schulthess CP, Giotto MV (2012) An investigation of strong sodium retention mechanisms in nanopore environments using nuclear magnetic resonance spectroscopy. Environ Sci Technol 46(1):300–306
17. Ferreira DR, Schulthess CP, Kabengi NJ (2012) Calorimetric evidence in support of the nanopore inner sphere enhancement theory on cation adsorption. Soil Chem 77:94–99
18. Moore JW (1991) Copper, in inorganic contaminants of surface water: research and monitoring priorities. Springer, New York
19. Cheah SF, Brown GE, Parks GA (1998) XAFS spectroscopy study of Cu(II) sorption on amorphous SiO2 and gamma-Al2O3: effect of substrate and
time on sorption complexes. J Colloid Interface Sci 208(1):110–128
20. Cheah SF, Brown GE, Parks GA (2000) XAFS study of Cu model com-pounds and Cu2+ sorption products on amorphous SiO
2,
gamma-Al2O3, and anatase. Am Miner 85(1):118–132
21. Rengaraj S et al (2004) Removal of copper from aqueous solution by aminated and protonated mesoporous aluminas: kinetics and equilib-rium. J Colloid Interface Sci 273(1):14–21
22. Chiron N, Guilet R, Deydier E (2003) Adsorption of Cu(II) and Pb(II) onto a grafted silica: isotherms and kinetic models. Water Res 37(13):3079–3086
23. Aguado J et al (2009) Aqueous heavy metals removal by adsorp-tion on amine-funcadsorp-tionalized mesoporous silica. J Hazard Mater 163(1):213–221
24. Pinkas J (2005) Chemistry of silicates and alumino silicates. Ceram-Silik 49(4):287–298
25. Ojeda ML et al (2003) On comparing BJH and NLDFT pore-size distribu-tions determined from N(2) sorption on SBA-15 substrata. Phys Chem Chem Phys 5(9):1859–1866
26. Ravikovitch PI, Neimark AV (2001) Characterization of micro- and mesoporosity in SBA-15 materials from adsorption data by the NLDFT method. J Phys Chem B 105(29):6817–6823
27. Carrott MMLR et al (2001) Adsorption of nitrogen, neopentane, n -hex-ane, benzene and methanol for the evaluation of pore sizes in silica grades of MCM-41. Microporous Mesoporous Mater 47(2–3):323–337 28. Ndungu K (2012) Model predictions of copper speciation in coastal
water compared to measurements by analytical voltammetry. Environ Sci Technol 46(14):7644–7652
29. Langmuir I (1918) The adsorption of gases on plane surfaces of glass, mica and platinum. J Am Chem Soc 40:1361–1403
30. Elkady MF, El-Aassar MR, Hassan HS (2016) Adsorption profile of basic dye onto novel fabricated carboxylated functionalized co-polymer nanofibers. Polymers 8(5):177
31. Nethaji S, Sivasamy A, Mandal AB (2013) Adsorption isotherms, kinetics and mechanism for the adsorption of cationic and anionic dyes onto carbonaceous particles prepared from Juglans regia shell biomass. Int J Environ Sci Technol 10(2):231–242
32. Smith KS (1999) Metal sorption on mineral surfaces: an overview with examples relating to mineral deposits. In: Plumblee GS, Logsdon MJ (eds) The environmental geochemistry of mineral deposits. Society of Economic Geologists, Inc, Littleton, pp 161–182
33. Mahmoud MA (2015) Kinetics and thermodynamics of aluminum oxide nanopowder as adsorbent for Fe(III) from aqueous solution. Beni-Suef Univ J Basic Appl Sci 4(2):142–149
34. Vadivelan V, Kumar KV (2005) Equilibrium, kinetics, mechanism, and process design for the sorption of methylene blue onto rice husk. J Colloid Interface Sci 286(1):90–100
35. Freundlich H (1906) Concerning adsorption in solutions. Zeitschrift Fur Physikalische Chemie-Stochiometrie Und Verwandtschaftslehre 57(4):385–470
36. Everett JA (ed) (1998) Adsorption models in adsorption of metals by geomedia. Academic Press, San Diego
37. Dabrowski A (2001) Adsorption—from theory to practice. Adv Colloid Interface Sci 93(1–3):135–224
38. Polanyi M (1963) Potential theory of adsorption. Science 141(358):1010 39. Corbett JF (1972) Pseudo first-order kinetics. J Chem Educ 49(10):663 40. Creed J, Brockhoff C, Martin T (1994) EPA method 200.8, revision 5.4.
Determination of trace elements in waters and wastes by inductively coupled plasma—mass spectrometry. U.E.P. Agency, Knoxville 41. Pollock RA et al (2011) Size and spatial distribution of micropores in
SBA-15 using CM-SANS. Chem Mater 23(17):3828–3840 42. Galarneau A et al (2001) True microporosity and surface area of
mesoporous SBA-15 silicas as a function of synthesis temperature. Langmuir 17(26):8328–8335
43. Kruk M et al (2000) Characterization of the porous structure of SBA-15. Chem Mater 12(7):1961–1968
44. Zhuravlev LT (2000) The surface chemistry of amorphous silica. Zhurav-lev model. Colloids Surf A Physicochem Eng Aspects 173(1–3):1–38 45. Ide M et al (2013) Quantification of silanol sites for the most common
46. Giret S, Hu Y, Masoumifard N, Boulanger J, Juere E, Kleitz F, Lariviere D (2018) Selective separation and preconcentration of scadium with mesoporous silica. Appl Mater Interfaces 10:448–457
47. Kosmulski M (2009) pH-dependent surface charging and points of zero charge. IV. Update and new approach. J Colloid Interface Sci 337(2):439–448
48. Wang YF et al (2003) Nanogeochemistry: geochemical reactions and mass transfers in nanopores. Geology 31(5):387–390
49. Kalluri RK, Konatham D, Striolo A (2011) Aqueous NaCl solutions within charged carbon-slit pores: partition coefficients and density distributions from molecular dynamics simulations. J Phys Chem C 115(28):13786–13795
50. Wang YF (2014) Nanogeochemistry: nanostructures, emergent proper-ties and their control on geochemical reactions and mass transfers. Chem Geol 378:1–23
51. Singer DM, Guo H, Davis JA (2014) U(VI) and Sr(II) batch sorption and diffusion kinetics into mesoporous silica (MCM-41). Chem Geol 390:152–163
52. Malash GF, El-Khaiary MI (2010) Piecewise linear regression: a statisti-cal method for the analysis of experimental adsorption data by the intraparticle-diffusion models. Chem Eng J 163(3):256–263