R E S E A R C H
Open Access
Mathematically optimized cryoprotectant
equilibration procedures for cryopreservation of
human oocytes
Allyson Fry Davidson
1, James D Benson
2and Adam Z Higgins
1** Correspondence:adam.higgins@ oregonstate.edu
1School of Chemical, Biological and
Environmental Engineering, Oregon State University, 102 Gleeson Hall, Corvallis, Oregon 97331-2702, USA Full list of author information is available at the end of the article
Abstract
Background:Simple and effective cryopreservation of human oocytes would have an enormous impact on the financial and ethical constraints of human assisted reproduction. Recently, studies have demonstrated the potential for cryopreservation in an ice-free glassy state by equilibrating oocytes with high concentrations of cryoprotectants (CPAs) and rapidly cooling to liquid nitrogen temperatures. A major difficulty with this approach is that the high concentrations required for the
avoidance of crystal formation (vitrification) also increase the risk of osmotic and toxic damage. We recently described a mathematical optimization approach for designing CPA equilibration procedures that avoid osmotic damage and minimize toxicity, and we presented optimized procedures for human oocytes involving continuous changes in solution composition.
Methods:Here we adapt and refine our previous algorithm to predict
piecewise-constant changes in extracellular solution concentrations in order to make the predicted procedures easier to implement. Importantly, we investigate the effects of using alternate equilibration endpoints on predicted protocol toxicity. Finally, we compare the resulting procedures to previously described experimental methods, as well as mathematically optimized procedures involving continuous changes in solution composition.
Results:For equilibration with CPA, our algorithm predicts an optimal first step consisting of exposure to a solution containing only water and CPA. This is predicted to cause the cells to initially shrink and then swell to the maximum cell volume limit. To reach the target intracellular CPA concentration, the cells are then induced to shrink to the minimum cell volume limit by exposure to a high CPA concentration. For post-thaw equilibration to remove CPA, the optimal procedures involve exposure to CPA-free solutions that are predicted to cause swelling to the maximum volume limit. The toxicity associated with these procedures is predicted to be much less than that of conventional procedures and comparable to that of the corresponding procedures with continuous changes in solution composition.
Conclusions:The piecewise-constant procedures described in this study are
experimentally facile and are predicted to be less toxic than conventional procedures for human oocyte cryopreservation. Moreover, the mathematical optimization approach described here will facilitate the design of cryopreservation procedures for other cell types.
Keywords:Optimization, Toxicity, Vitrification, Cell membrane transport, Permeability
Introduction
Cryopreservation theoretically allows nearly indefinite storage of viable biological ma-terial [1]. Conventional cryopreservation techniques are usually thought of as slow-cooling methods (~1°C/min) that utilize relatively low (1 to 2 mol/L) concentrations of cryoprotectants (CPAs) such as glycerol, ethylene glycol, or dimethyl sulfoxide. Al-though these conventional techniques are sufficient for many cell types, this approach is less successful for cells that have a reduced tolerance to sub-physiologic temperatures (e.g. oocytes [2,3]) or are easily damaged by extracellular ice formation (e.g., three di-mensional tissues [4,5]). For these sensitive cell types, an alternative cryopreservation technique widely known as vitrification may be used that preserves cells in a glassy state devoid of ice crystals.
In order to completely avoid the liquid to crystal phase transition, these vitrification techniques require combinations of very high cooling and warming rates (typically >>100°C/min) with cryopreservation solutions that contain very high concentrations of CPA (typically > 5 mol/L). In addition to avoiding damage associated with ice forma-tion, vitrification techniques are appealing because they require much less precise cool-ing rates compared to conventional methods, and as such can be implemented without costly or complicated controlled rate freezing devices.
However, there is a high cost associated with these techniques: the equilibration of cells with and from high CPA concentrations (CPA addition and removal, respectively) dramatically increases the risk of damage due to osmotically driven cell volume changes and CPA induced cytotoxicity. Volumetric damage can be caused by rapid exposure to anisosmotic media, during which the differential permeability of water and CPA drives a biphasic volume response. This damage occurs when the cell either rapidly loses and then slowly regains its intracellular water in traditional CPA addition schemes, or vice versa with traditional removal schemes. These responses, if large enough, may drive the cell beyond critical volumes known as osmotic tolerance limits, outside of which irre-versible cell damage occurs [6,7]. Additionally, high CPA concentrations also increase the risk of cell damage or death due to chemical toxicity; it has been claimed that pre-venting toxicity is the biggest challenge in achieving successful vitrification [8].
Rational design approaches combine mathematical models and cell biophysical pa-rameters to predict optimized CPA addition and removal procedures. Because the dam-age due to extending cell volumes beyond osmotic tolerance limits is relatively well understood, the most common rational design method has been to use membrane transport equations and osmotic tolerance limits to predict multi-step procedures that prevent osmotic damage [9-11]. With an argument that cytotoxicity due to CPA expos-ure is time-sensitive, rational design strategies have also been extended to reduce toxic damage by minimizing the duration of the CPA addition and removal procedures while still maintaining cell volumes between osmotic tolerance limits [12,13].
computerized control. Moreover, because most previous rationally designed procedures used an isosmotic volume as the final state for CPA addition and removal [9,10], our previous study used an isosmotic volume to define the target final cellular state. This final state may be less optimal than one where the cell is dehydrated to its osmotic tol-erance limit at the end of CPA loading. In fact there has been discussion in the litera-ture about the advantages of cooling in a pre-dehydrated state (see, e.g., [17]).
In the current study, we describe adaptations to our previous algorithm in order to make the predicted procedures easier to implement. The minimization of a toxicity cost function remains the basis of our algorithm. However, instead of predicting procedures with continuous concentration changes, the new algorithm predicts multi-step proce-dures with piecewise constant changes in the CPA and non-permeating solute concen-trations. Also, rather than specifying an isotonic final cell volume, the new algorithm uses the intracellular CPA concentration to define the target final state, which allows exploration of alternate final cell volumes. We predict procedures for the addition and removal of vitrification solutions for human oocytes; a valuable, clinically relevant, and challenging to cryopreserve cell type. Our results demonstrate the potential to signifi-cantly reduce the toxicity of vitrification procedures with an experimentally and clinic-ally facile CPA equilibration protocol.
Methods
Our approach for optimizing CPA addition and removal procedures involves minimization of a toxicity cost function subject to cell membrane transport equations and cell volume state constraints. To achieve this minimization, we used cell membrane transport predic-tions to both evaluate the state dependent toxicity cost function and to ensure that cell vol-umes did not violate the osmotic tolerance constraints. To model the cellular state, we used the nondimensional form of the two parameter membrane transport model [16,18]:
dw
dτ¼−m1−m2þ
1þs
w ;
ds
dτ¼b m2−s
w
;
ð1Þ
where w is the intracellular water volume normalized to the water volume under iso-tonic conditions, sis the moles of intracellular CPA normalized to the moles of intra-cellular solute under isotonic conditions, τis a dimensionless temporal variable,b is a dimensionless relative permeability constant, and m1and m2are the extracellular
con-centrations (in molal units) of non-permeating solute and CPA, respectively, normal-ized to the isotonic solute concentration (0.3 Osm/kg).
For human oocytes exposed to ethylene glycol (EG) at 22°C, published membrane permeability values yield a relative permeability constant ofb= 1.62 [19]. These perme-ability values also result in a dimensional time (in minutes) that is 4.33 times larger than the nondimensional time. Osmotic tolerance data for human oocytes [7,20] were used to define constraints on the cell volume, yielding
0:47≤wþγs≤1:67; ð2Þ
As in our previous study, we used a toxicity cost function based on published toxicity data for exposure of cartilage [14] and fibroblasts [15] to dimethyl sulfoxide. The cost function can be expressed as
Jα¼
Z τf
0
sα
wαdτ; ð3Þ
where α= 1.6 is a constant describing the concentration dependence of the toxicity rate, andτfis the total duration of the procedure [16].
In the previous implementation of our optimization approach [16], we defined the goal state (i.e., the desired final state at the end of the procedure) as a specific set of state variable values, wf andsf. In particular, for addition of EG, we used the valueswf= 0.67 and sf= 19.9, which correspond to an intracellular EG concentration of 6 mol/L (sf/wf= 30) and a cell volume equivalent to the isotonic cell volume (wf+γsf= 1). To en-sure that the optimization algorithm terminated at the goal state, we minimized a cost function equal to
Jα;ε¼JαþJε; ð4Þ
where Jεis a cost associated with the proximity of the final state to the goal state, and is defined as
Jε¼1ε w τf −wf2þs τf −sf2
: ð5Þ
In the present study, we investigated an alternative definition of the goal state. Rather than uniquely specifying the values of both wf and sf, we chose a specific intracellular EG concentration as the goal state. This goal state definition is consistent with the pur-pose of CPA loading for vitrification methods: to achieve an intracellular CPA concen-tration that enables vitrification of the intracellular solution at practicable cooling and warming rates. For example, if we wish to achieve an intracellular EG concentration of 6 mol/L, then our goal state is sf/wf= 30, defining a line in the s, w state space. For CPA removal, we define the goal state as sf/wf= 0, again not limiting our goal state to an isotonic volume. With the goal state defined in this way, we redefined the proximity cost as
Jε¼1ε s τ f
wð Þτf −
sf
wf
2
: ð6Þ
We usedε= 10−3for CPA addition andε= 10−1for CPA removal, which was found to result in convergence near the goal state.
One of the goals of the present study was to modify the optimization approach to yield procedures that are easier to implement experimentally. Thus we examined proce-dures consisting of piecewise constant concentration profiles for m1(τ) and m2(τ). We considered both two-step and three-step procedures—procedures with either two or three step-changes in the extracellular concentration. In the case of two-step proce-dures, the parameters to be optimized consist of the duration of the first step, the con-centrations m1 and m2 in the first step, the duration of second step and the concentrations m1 and m2in the second step, resulting in a total of 6 parameters. A total of 9 parameters are required for parameterization of three-step procedures. Unless otherwise noted, the concentration parameters to be optimized were bounded between a lower limit of m= 0 and an upper limit of m= 80. This corresponds with a maximal EG concentration of 60% w/w, or about 10.3 mol/L.
A convenient outcome of assuming piecewise constant concentration profiles for m1(τ) andm2(τ) is that an analytical solution to system (1) is available whenm1andm2 are constant [21]. The use of the analytical solution dramatically improves the conver-gence speed and the stability of the calculation in comparison to the use of numerical methods for solving the differential equations. As described in Benson et al. [21], the basic approach for finding the analytical solution is to define a grouped variable that in-cludes both the time and the cell water volume in order to convert the membrane transport model into a set of linear differential equations that can be solved using standard methods (see, e.g., [22]). In terms of the nondimensional variables in system (1), the new time-like variablexis defined by the relationship
dx¼ 1
wdτ: ð7Þ
The time variable transformation alters the cost function (Eq. 3) that now may be re-written equivalently in terms ofx,
Jα¼
Z xf
0
sα
wα−1dx; ð8Þ
allowing the calculation and optimization to occur completely in the time transform space with the attendant exact solutions. The analytical solutions for wand sin terms of the variablexare provided in theAppendix.
condition; i.e., we simply replaced the previous end point penalty cost function Jε
(Eq. 5) with its new expression (Eq. 6).
Results
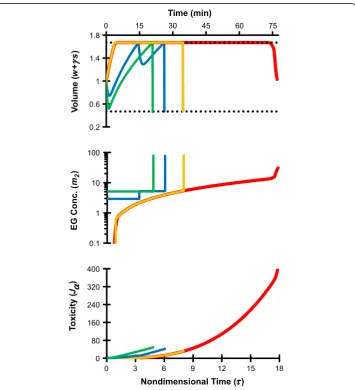
To allow storage of oocytes in an ice-free glassy state it is first necessary to equilibrate the cells in a sufficiently concentrated CPA solution so that the sample vitrifies during cooling and does not devitrify (crystallize) during warming. We initially considered 6 mol/L EG to be a“vitrifiable”concentration, and used an intracellular EG concentra-tion of 6 mol/L as the target state at the end of CPA loading. Figure 1 compares two
Figure 1Comparison of mathematically optimized protocols for equilibration of human oocytes with EG.All of the procedures terminated at a goal state withsf/wf= 30, which is equivalent to an
intracellular EG molality of 9 Osm/kg, or a molar concentration of about 6 mol/L. The red line shows results from our previous study [16], which involved piecewise linear parameterization ofm1(τ) andm2(τ) and a
goal state fixed at the isotonic cell volume. The orange line shows results for the same piecewise linear parameterization ofm1(τ) andm2(τ), but with a goal state that was not fixed at a specified final volume. The
green and blue lines show two-step and three-step piecewise constant procedures, which also had goal states that were not fixed at a specific final volume. The horizontal dotted lines in the top figure show the osmotic tolerance limits. Note that the nondimensional EG concentrationm2can be converted to molal
different strategies for defining the target final state (i.e., the goal state) in the optimization algorithm. The first strategy was that of our previous study where the goal state satisfied the following two conditions: (1) an intracellular EG concentration of 6 mol/L (sf/wf= 30), and (2) a final cell volume equal to the isotonic cell volume (wf +
γsf= 1). For the second strategy, the goal state still consisted of an intracellular EG con-centration of 6 mol/L (sf/wf= 30), but the final cell volume was not specified. To com-pare these goal state definitions, EG loading procedures were designed using a piecewise linear parameterization of the extracellular concentrations m1 and m2 (i.e., the concentrations were allowed to vary continuously with time); the resulting proce-dures are shown with red and orange lines, respectively. In both cases, the mathematic-ally optimized procedures called for a non-permeating solute concentration m1 that was zero throughout the EG addition process. Thus, all EG loading solutions contained only EG and water. Also, for both approaches the cells were initially induced to swell to the maximum cell volume limit (as defined in Eq. 2) by exposure to hypotonic solu-tion. In this swelling phase of the procedure, very little EG was loaded into the cells, because the extracellular solution contained a very low EG concentration. Once the upper volume limit was reached, the EG concentration was increased and maintained near osmotic equilibrium at a concentration that resulted in a volumetric influx of EG that was exactly balanced by efflux of water. The resulting constant-volume period can be thought of as the EG loading phase of the procedure. At the end of the EG loading phase, the extracellular EG concentration was abruptly increased, causing the cells to shrink rapidly due to water efflux. This shrinkage concentrated the intracellular EG that had been introduced during the loading phase. When the goal state consisted of an intracellular EG concentration of 6 mol/L and a final cell volume that was equal to the isotonic volume, cell shrinkage at the end of EG loading terminated at the isotonic cell volume, as expected. However, when the goal state was defined as 6 mol/L EG without specifying the final cell volume, shrinkage terminated at the minimum volume limit. Because of this additional shrinkage a relatively short EG loading phase was required to achieve the goal concentration. This shorter EG loading phase corresponded with a tenfold reduction in the toxicity cost (Jα) associated with the CPA addition process, as
shown in the bottom panel of Figure 1.
larger than that obtained using the corresponding piecewise linear procedure. Table 1 summarizes the toxicity costs associated with each of the four different EG loading pro-cedures described above.
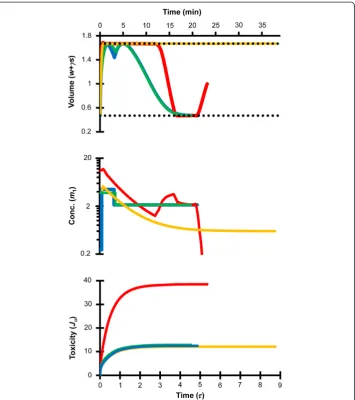
Figure 2 examines the effect of the mathematical optimization approach on proce-dures for removal of 6 mol/L EG from human oocytes. In all cases, the initial state for EG removal was assumed to be the corresponding final state after EG addition shown in Figure 1. All of the optimized EG removal procedures consisted of exposure to solu-tions containing non-permeating solutes, but lacking EG. In addition, all of the proce-dures resulted in swelling to the maximum volume limit. The red line shows the results of our previous study, which assumed a piecewise linear concentration profile and a goal state fixed at the isotonic cell volume. For comparison, the orange line shows the piecewise linear procedure that is obtained when the final cell volume is not fixed. As shown in the bottom panel of Figure 2, the predicted toxicity cost Jα was substantially
higher in our previous study. This is primarily a result of differences in the cell volume before initiating the EG removal process. In our previous study, the cells were at their isotonic volume at the end of EG addition and hence started at the isotonic volume for EG removal. In contrast, the procedure designed without specifying the final cell vol-ume started with the cell volvol-ume at the minimum volvol-ume limit. Consequently, swelling to the maximum volume limit resulted in greater dilution of the intracellular EG, lead-ing to a lower toxicity cost. Two-step and three-step piecewise constant procedures are shown with green and blue lines, respectively. Both procedures were designed using a goal state that was not fixed at the isotonic cell volume. The toxicity cost associated with the two-step and three-step procedures was nearly identical to that obtained using the corresponding piecewise linear procedure, but much lower than the piecewise lin-ear procedure with an isotonic final cell volume. In general, EG removal is predicted to be less toxic than EG addition, as can be seen by comparing the toxicity costs shown in Figures 1 and 2. These results are summarized in Table 1.
Although we nominally considered 6 mol/L EG to be a vitrifiable concentration to design the CPA addition and removal procedures shown in Figures 1 and 2, the actual concentration needed to vitrify depends on the cooling and warming rates. Therefore, in Figure 3 we examine the effect of increasing the goal state concentration on two-step and three-two-step piecewise constant EG addition procedures. In general, the final step of the EG addition procedure was short and consisted of rapid shrinkage to the minimum volume limit. However, as can be seen in Figure 3A, two-step procedures
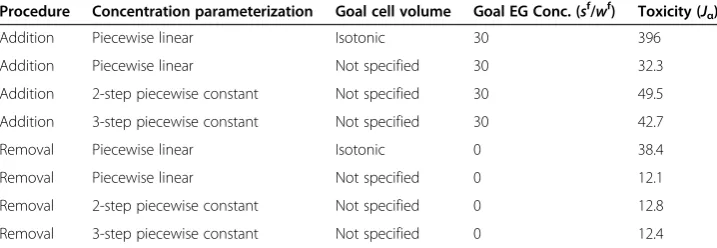
Table 1 Comparison of mathematically optimized methods for equilibration of human oocytes with 6 mol/L EG
Procedure Concentration parameterization Goal cell volume Goal EG Conc. (sf/wf) Toxicity (J
α)
Addition Piecewise linear Isotonic 30 396
Addition Piecewise linear Not specified 30 32.3
Addition 2-step piecewise constant Not specified 30 49.5 Addition 3-step piecewise constant Not specified 30 42.7
Removal Piecewise linear Isotonic 0 38.4
Removal Piecewise linear Not specified 0 12.1
underwent a transition between goal state concentrations of 6.6 mol/L (sf/wf= 35) and and 6.9 mol/L (sf/wf= 37) in which the duration of the second step increased dramatic-ally. This transition corresponded with the point at which the maximum amount of EG was loaded into the cells during the first step of the procedure. Maximum EG loading occurs when the cells are exposed to the EG concentration that causes shrinkage to the minimum volume limit and then equilibrated in this solution until the cell volume reaches the maximum volume limit. Beyond the transition point, maximal EG loading in the first step was not sufficient to allow the cells to achieve the goal EG concentra-tion in the second step by shrinkage alone. Thus, further loading of EG had to be achieved by allowing the cells to partially equilibrate with a high EG concentration in
Figure 2Comparison of mathematically optimized protocols for removal of 6 mol/L EG from human oocytes.The red line shows results from our previous study [16], which involved piecewise linear parameterization ofm1(τ) andm2(τ) and a goal state fixed at the isotonic cell volume. The orange line
shows results for the same piecewise linear parameterization ofm1(τ) andm2(τ), but with a goal state that
the second step. For three-step procedures, this type of transition was not observed for goal concentrations up to 10.3 mol/L (sf/wf= 80).
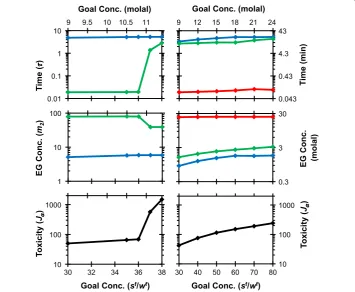
Figure 4 shows a more detailed comparison of the optimal procedures obtained for goal state concentrations ranging fromsf/wf= 30 tosf/wf= 80. For two-step procedures, we can see that when the goal state is greater thansf/wf= 36, the duration of the second
Figure 3Effect of increasing the goal concentrationsf/wfon oocyte volume response during EG addition using two-step (A) and three-step (B) piecewise constant procedures.The horizontal dotted lines show the osmotic tolerance limits. Goal concentration valuessf/wf= 30, 35, 37, 50 and 70 correspond
with intracellular EG concentrations of 9, 10.5, 11.1, 15, and 21 Osm/kg (in molal units), or approximately 6, 6.6, 6.9, 8.2 and 9.7 mol/L (in molar units).
Figure 4Two-step (left) and three step (right) piecewise constant EG addition procedures as a function of the goal state concentrationsf/wf.The toxicity costJ
αat the end of the procedure, the EG
step dramatically increases, leading to a substantial increase in the toxicity cost Jα. For
three step procedures, a similar abrupt increase in toxicity cost was not observed. In general, as the goal EG concentration increased, so did the predicted toxicity cost.
While the two-step and three-step procedures illustrated in Figures 1, 2, 3 and 4 are much easier to implement than the piecewise linear procedures, there are some prac-tical issues that will need to be considered before such procedures are adopted clinic-ally. Thus, to improve the optimized procedures, we examined the effects of including additional practical constraints in the optimization algorithm (see Table 2). The EG loading procedures presented above call for an extremely short final step. However, physical limits exist to how quickly the final addition step can be performed before cooling can be initiated. Therefore, we limited the step duration to the unitless equiva-lent of one minute in the optimization algorithm. In addition, the final step in the load-ing methods described above consists of exposure to a highly concentrated EG solution (i.e., m2= 80, or about 10.3 mol/L), whereas it is more common to expose the cells to the minimum concentration necessary to achieve vitrification in the final step. There-fore, we constrained the EG concentration m2using an upper limit equal to the goal concentration. Finally, the EG loading solutions described above only contain EG and
Table 2 Effects of parameter constraints on optimized piecewise constant procedures for equilibration of human oocytes with EG
Procedure Step Non-permeating
solute,M1(Osm/kg)
EG,M2(Osm/kg) Time,t(min) Toxicity (Jα)
Constraints: 0≤M1≤24 0≤M2≤24 t≥0
Addition 1 0 1.4 20 130
2 0 2.4 16
3 0 24 0.094
Removal 1 1.8 0 3.6 22
2 0.66 0 15
Constraints: 0≤M1≤24 0≤M2≤24 t≥1
Addition 1 0 1.3 19 240
2 0 2.4 16
3 0 17 1.0
Removal 1 2.0 0 3.6 25
2 0.65 0 15
Constraints: 0≤M1≤24 0≤M2≤16 t≥1
Addition 1 0 1.4 20 250
2 0 2.5 16
3 1.2 16 1.0
Removal 1 1.8 0 3.5 22
2 0.68 0 13
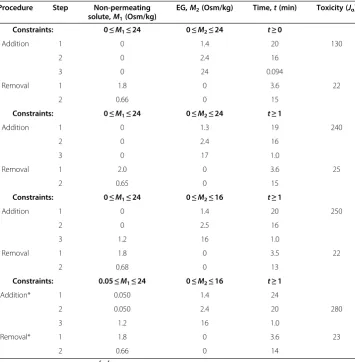
Constraints: 0.05≤M1≤24 0≤M2≤16 t≥1
Addition* 1 0.050 1.4 24
2 0.050 2.4 20 280
3 1.2 16 1.0
Removal* 1 1.8 0 3.6 23
2 0.66 0 14
The goal state for EG addition wassf /wf
water; the lack of ions and buffering salts in these loading solutions may cause damage that is not accounted for in the toxicity cost function. Therefore, we also imposed a constraint on the concentration of non-permeating solutes, limiting the concentration to at least 0.05 osmoles/kg (i.e.,m1> 0.167).
Table 2 shows the effects of these practical constraints on procedures for addition and removal of EG. We designed procedures using a goal concentration of 8.5 mol/L because this EG concentration is expected to allow vitrification of the sample at the cooling and warming rates that are achievable using 1/4 mL freezing straws. When the step duration was limited to a minimum of 1 min, the only essential difference was an increase in the duration of the final addition step and a corresponding increase in the predicted toxicity cost by nearly two-fold. On the other hand, constraining the EG con-centration to a maximum of 8.5 mol/L (i.e., m2= 53.7) had very little effect on the tox-icity cost. The main difference is that the resulting procedure calls for a non-zero concentration of permeating solute in the final addition step. Limiting the non-permeating solute concentration to a minimum of 0.05 Osm/kg resulted in longer equilibration times in steps one and two, and a corresponding modest (< 15%) increase in the toxicity cost. All of the parameter constraints considered in Table 2 resulted in nearly identical procedures for EG removal.
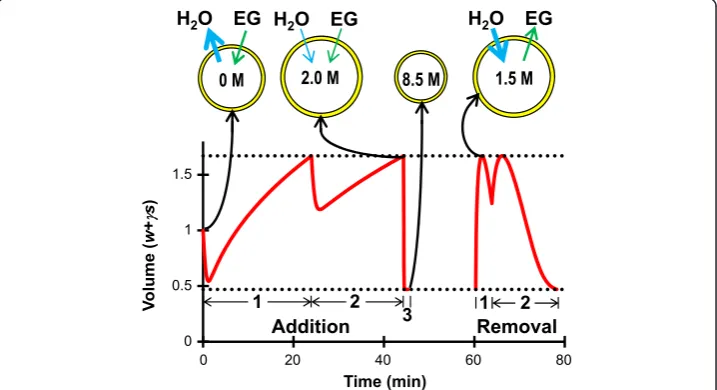
The procedures indicated with asterisks in Table 2 represent practical methods for equilibration of human oocytes with 8.5 mol/L EG. These EG addition and removal procedures are illustrated in Figure 5. The first two EG loading steps consist of cell shrinkage due to water efflux followed by swelling to the maximum osmotic tolerance limit as both water and EG enter the cell. At the end of the second step, the cell is pre-dicted to reach an intracellular concentration of about 2 mol/L. In the third loading step, the cell rapidly shrinks due to water efflux and reaches an equilibrium volume at the lower osmotic tolerance limit; this serves to concentrate the intracellular EG to the goal concentration of 8.5 mol/L. The first step of EG removal involves exposure to a
relatively hypotonic solution that causes water influx and concomitant swelling to the maximum osmotic tolerance limit. This swelling, coupled with efflux of EG, rapidly re-duces the intracellular EG concentration to 1.5 mol/L. Together, these predictions show that by leveraging shrinking and swelling between the osmotic tolerance limits, addition and removal of 8.5 mol/L EG can be achieved while maintaining EG at low and rela-tively non-toxic concentrations throughout the majority of the process.
Discussion
CPA induced cytotoxicity has been identified as a principal impediment to achieving successful vitrification [8]. However, the conventional approach for rational design of CPA equilibration procedures focuses only on avoidance of osmotic damage and does not consider mitigation of toxicity [9-11]. To address this deficiency, rational design ap-proaches have recently been developed for minimizing protocol duration [12,13]; while these approaches would be expected to reduce toxicity compared with conventional methods, they do not account for the concentration dependence of toxicity. In our pre-vious study [16] we described a new strategy for designing minimally-toxic CPA equili-bration procedures using a concentration-dependent toxicity cost function. The resulting procedures are predicted to be less toxic than conventional methods for CPA equilibration as well as procedures with minimized duration. In this study we address two drawbacks of our previously reported mathematical optimization approach [16]. Our previous study relied on the concatenation of many linear changes in CPA and non-permeating solute concentrations which are difficult to achieve experimentally. Therefore, the primary objective of this study was to develop a method for designing multi-step CPA addition and removal procedures that are similar to conventional pro-cedures with abrupt changes in CPA and non-permeating solute concentrations [7]. In addition, our previously reported optimization algorithm required cells to reach an iso-tonic final volume, potentially a suboptimal equilibration endpoint. Thus, an additional objective of this study was to evaluate alternate equilibration endpoints.
The goal state defined in our previous study required that cells achieved an isotonic volume at the end of CPA addition. However, it is a common strategy to intentionally induce shrinkage in the final CPA addition step and to vitrify the sample while the cells are in the shrunken state [17,26-28]. For instance, multi-step vitrification procedures for oocytes commonly involve loading of CPA at relatively low concentrations followed by exposure to the final vitrification solution for a brief period of time directly before cooling [29-31]. In other words, with these procedures, the cooling process is initiated while the cells are in the shrunken state. The rationale behind this strategy is that water loss concentrates intracellular solutes, allowing a vitrifiable cytoplasm composition to be reached with a shorter exposure to the final vitrification solution [17]. Another ad-vantage of vitrification in the shrunken state is that it facilitates removal of intracellular CPA after warming [17]. This is because the cell contains less total CPA in the shrunken state, and also has more capacity for swelling during the first removal step. The mathematically optimized procedures we describe in this study are consistent with this vitrification strategy in that the final CPA addition step comprises exposure to a concentrated CPA solution, which induces shrinkage to the minimum tolerable volume. Thus, our results provide a theoretical basis for the common practice of exposing cells to the final vitrification solution for a short time, and then initiating cooling while the cells are in the shrunken state.
The most unique aspect of our optimized procedures is that cells are loaded with CPA by inducing swelling to the maximum volume limit using a solution lacking non-permeating solutes (e.g., salts). In comparison, typical CPA loading solutions contain an isotonic concentration of non-permeating solutes and consequently do not induce swelling. Swelling is advantageous because it allows a given amount of CPA to be loaded into the cells using a relatively low CPA concentration. This is because the amount of intracellular CPA is equal to the product of the intracellular concentration and the cell volume. To our knowledge, loading CPA intracellularly while forcing cells to be in a swollen state is a novel result of our toxicity minimization strategy. While this approach is promising, it may be damaging to expose oocytes to solutions lacking salts because of potential perturbations in ion homeostasis. Studies with red blood cells show that complete lack of salts in the extracellular medium causes the cell membrane to become leaky, resulting in substantial loss of intracellular ions over a period of hours [32,33]. However, the presence of even a small amount of salt in the extracellular medium dramatically slows the rate of ion leakage [32,33]. This suggests that it may be possible avoid problems with ion leakage by including some minimal concentration of salts in the CPA loading solution. Recently, Karlsson and colleagues showed that mouse oocytes are not damaged by exposure to a CPA solution containing only 0.05 Osm/kg salts [34]. Therefore, we also optimized a CPA loading procedure using 0.05 Osm/kg as a minimum constraint on the non-permeating solute concentration (Table 2 and Figure 5). The resulting procedure still takes advantage of swelling, and hence would be expected to be much less toxic than conventional CPA loading methods, and is only marginally more toxic than our optimized protocols without the minimal salt con-straint (Table 2).
device, a minimal volume device that offers an alternative to vitrification in freezing straws by taking advantage of the higher cooling and warming rates achieved with smaller sample volumes. The procedure for EG loading described by Kuwayama et al. results in a calculated toxicity ofJα= 60.6. Using the same goal state (an EG concentration of 5 mol/L,
or sf/wf= 23), our toxicity-minimization strategy predicts a procedure with a twofold lower toxicity of Jα= 29.3. It is important to note that the procedure described by
Kuwayama et al. is predicted to yield oocyte volumes that exceed the osmotic tolerance limits that we used for designing our mathematically optimized method. Since the proced-ure reported by Kuwayama et al. has been successful, this may indicate that the osmotic tolerance limits that we used in this study were too restrictive. Broadening the osmotic tolerance limits would be expected to lead to even further reductions in the toxicity cost or increases in maximally achievable CPA concentration at the same cost.
While successful, the disadvantage of the Cryotop method employed by Kuwayama et al. [29] is that it is a potentially nonsterile system, where cells are directly exposed to liquid nitrogen. This open system is a requirement due to the ultrahigh cooling rates needed to avoid crystallization at such low CPA concentrations. However, if we assume that the calculated toxicity from their protocol,Jα= 60.6, is acceptable, then we can use
our optimization approach to determine the maximal EG concentration that would re-sult in the same level of toxicity. In this case we would be able to achieve a much in-creased goal concentration of approximately 6.6 mol/L (sf/wf= 35) using two-step or three-step toxicity minimized procedures. This approach is useful because with higher goal concentrations, it is possible to achieve vitrification using less extreme cooling and warming rates. Thus, the ability to reach higher goal concentrations without significant cytotoxicity would enable the use of other devices that offer more sterility but have a greater thermal mass, such as freezing straws, and would offer considerably more mar-gin for error in cooling and warming rates under the present Cryotop protocol.
Therefore, instead of minimizing toxicity under current cooling regimes such as the Cryotop method, we may use our optimization approach to calculate the anticipated added cost of achieving a concentration that would facilitate vitrification under more sterile conditions. In particular, Baudot and Odagescu [35] determined that a 50% w/w EG solution required a cooling rate of 11°C/min to achieve vitrification and a warming rate of 853°C/min to prevent devitrification. Cooling rates up to 2000°C/min can be achieved by directly immersing 1/4 mL freezing straws into liquid nitrogen, and warm-ing rates up to 3000°C/min can be achieved by immerswarm-ing straws into a 25°C water bath [36]. Thus, 50% w/w EG should conservatively enable vitrification at the cooling and warming rates achievable using freezing straws. An EG concentration of 50% w/w corresponds with a goal state of sf/wf= 53.7. Using our toxicity-minimized procedures, achieving a goal state ofsf/wf= 53.7 would result in a toxicity ofJα= 130 (Table 2). This
is larger than the predicted toxicity cost associated with the procedure reported by Kuwayama et al. [29] which has been proven successful. However, greater toxic damage may be an acceptable tradeoff for increased sterility and improved stability of the glassy state during storage. The clinical application of this approach will require a more pre-cise understanding of the cost function Jα, and the determination of acceptable values
of this cost in the context of reproductive medicine.
minimum volume to be achieved. For instance, the two-step and three-step CPA addition procedures shown in Figure 1 had final steps with durations of about 5 sec-onds. However, it may not be practical to perform a 5 second equilibration with suffi-cient accuracy and repeatability for clinical application. A distinct advantage of our approach is that it allows the determination of optimal protocols even after the addition of practical design constraints to the problem. Most previously reported CPA equilibra-tion procedures for vitrificaequilibra-tion of human oocytes involve exposure to the final vitrifi-cation solution for at least 30 seconds [29-31]. Thus, we assumed that a one-minute final step would be feasible and determined optimal two-step and three-step procedures with this constraint (see Table 2). Interestingly, when such procedures were designed using a maximum concentration constraint equal to the goal concentration, the final addition step called for the presence of non-permeating solute at a concentration of approximately 1 Osm/kg. This is consistent with the common practice of including 0.5-1 mol/L sucrose in the final vitrification solution for human oocytes [29-31]. The presence of non-permeating solute in the final vitrification solution is potentially ad-vantageous because it results in equilibration of the cells in a shrunken state. For ex-ample, exposure to the final solution compositions shown in Table 2 is predicted to cause rapid shrinkage and subsequent equilibration at the minimum volume limit in less than 20 seconds, as shown in Figure 5. These procedures would be expected to be relatively robust to variations in the exposure time in the final CPA addition step, since equilibrium is achieved quickly.
The optimized procedures for EG removal presented here call for exposure to solu-tions containing non-permeating solutes, but lacking EG. However, some residual EG would be present in practice, regardless of the method for changing the extracellular composition. To examine the potential effects of residual EG, minimum constraints can be imposed on the EG concentration during each removal step. If the EG concen-tration is constrained to a 20-fold dilution in each step, the toxicity cost associated with the resulting procedure is about 40% higher than that obtained when the EG concen-tration is zero in each step. A 100-fold dilution in each step is only associated with a 6% increase in toxicity cost. Overall, these increases in toxicity would not be expected to substantially effect of the outcome of the cryopreservation process, since EG removal is still be predicted to be much less toxic than EG addition.
Another advantage of our approach is that the toxicity cost function provides a quantita-tive indicator of cell damage after cryopreservation, facilitating rational evaluation of feasi-bility. If the expected cost under the optimal protocol is unacceptable, exceeding a limit that indicates a significant level of damage, a completely new approach must be tried that mitigates this cost. For example, it may be possible to reduce toxicity by using a different combination of CPAs or by carrying out the procedure at a different temperature. Import-antly, the model results can be used to direct the research focus to the source of damage. This aspect is unique to our approach and has the potential to save time by identifying non-feasible approaches without the need for fruitless experiments. To realize these bene-fits, it will be necessary to clarify the factors affecting the toxicity cost function, as well as the relationship between the cost function and cell viability for the cell type of interest.
Conclusions
In this study we have presented an adaptation of our toxicity-minimization strategy for predicting CPA addition and removal procedures. In particular, we have modified our previous strategy which relied on continuous concentration changes and instead predict procedures based on piecewise constant concentration changes. These new procedures are not only similar to conventional procedures but are also much simpler to imple-ment experiimple-mentally. The mathematical algorithm is based on the minimization of a tox-icity cost function, which describes the effect of CPA concentration on cytotoxtox-icity. Although these procedures still require experimental validation, we have provided theor-etical evidence suggesting that our procedures would reduce toxic damage relative to pro-cedures that are currently in use. The employment of this cost function allows for rational comparison of potential experimental designs and facilitates the generation of cell damage hypotheses in the context of cryopreservation protocols. Finally, our strategy also provides a structure for incorporating other factors into the model-based design of toxicity-minimized vitrification procedures, including the effects of temperature on CPA toxicity.
Appendix
An analytical solution has previously been published for the two-parameter membrane transport model [21], but not explicitly for the nondimensional form of transport model given in system (1). Parameterizing the equation in the time variable using Eq. 7 is equiva-lent to multiplying the right hand side of each equation bywand yields the linear system
dw
dx¼−ðm1þm2Þwþsþ1; ds
dx¼bm2w−bs;
ðA1Þ
which retains the same initial conditions as system (1). This system may be solved using standard techniques. The analytical solution in terms of the nondimensional vari-ableswandsis, with m1≠0
w¼ 1
m1þ
m1wi−1−C1
2m1
expð Þ þr1x m1w
i−1þC
1
2m1
expð Þr2x; ðA2Þ
s¼m2 m1þ
m1si−m2þC2
2m1
expð Þ þr1x m1s
i−m
2−C2
2m1
wherewiandsiare the initial values ofwand s, respectively, and the constantsC1,C2,
r1andr2are defined as
C1¼m1−m2þ
2mffiffiffiffiffiffiffiffiffiffiffiffiffiffiffiffiffiffiffiffiffiffiffiffiffiffiffiffiffiffiffiffiffiffiffiffiffiffiffiffiffiffiffiffiffi1si−m1wiðm1þm2Þ þb mð 1wi−1Þ
bþm1þm2
ð Þ2−
4bm1
q ; ðA4Þ
C2¼ðm1þm2Þ m2−m1s
i
ð ffiffiffiffiffiffiffiffiffiffiffiffiffiffiffiffiffiffiffiffiffiffiffiffiffiffiffiffiffiffiffiffiffiffiffiffiffiffiffiffiffiffiffiffiffiÞ þb mð 2þm1si−2m1m2wiÞ
bþm1þm2
ð Þ2−
4bm1
q ; ðA5Þ
r1¼−0:5 bþm1þm2þ
ffiffiffiffiffiffiffiffiffiffiffiffiffiffiffiffiffiffiffiffiffiffiffiffiffiffiffiffiffiffiffiffiffiffiffiffiffiffiffiffiffiffiffiffiffi bþm1þm2
ð Þ2−
4bm1
q
; ðA6Þ
r2¼−0:5 bþm1þm2−
ffiffiffiffiffiffiffiffiffiffiffiffiffiffiffiffiffiffiffiffiffiffiffiffiffiffiffiffiffiffiffiffiffiffiffiffiffiffiffiffiffiffiffiffiffi bþm1þm2
ð Þ2−
4bm1
q
: ðA7Þ
This analytical solution was used in our optimization algorithm to predict changes in cell volume and intracellular CPA concentration, thus allowing evaluation of the cell volume constraints as well as the toxicity cost function. We restrictedm1> 10−4.
Note that this solution is in the new time space. To recover the original nondimen-sional timeτfrom the time-like variable xwe must integrate Eq. A2:
τ¼
Z x
0 w x
ð Þdx: ðA8Þ
Competing interests
The authors declare that they have no competing interests.
Authors’contributions
AD developed and tested the numerical method and prepared the initial draft of the manuscript under the supervision of AH. JB participated in analysis of results, modeling and optimization and manuscript preparation. All authors read and approved the final manuscript.
Acknowledgements
This work was supported by a National Science Foundation grant (#1150861) to Adam Higgins.
Author details
1School of Chemical, Biological and Environmental Engineering, Oregon State University, 102 Gleeson Hall, Corvallis,
Oregon 97331-2702, USA.2Department of Mathematical Sciences, Northern Illinois University, DeKalb, IL 60115-288, USA.
Received: 16 July 2013 Accepted: 19 February 2014 Published: 20 March 2014
References
1. Mazur P:Freezing of living cells: mechanisms and implications.Am J Physiol1984,247:C125–C142. 2. Ghetler Y, Yavin S, Shalgi R, Arav A:The effect of chilling on membrane lipid phase transition in human
oocytes and zygotes.Hum Reprod2005,20:3385–3389.
3. Martino A, Songsasen N, Leibo SP:Development into blastocysts of bovine oocytes cryopreserved by ultra-rapid cooling.Biol Reprod1996,54:1059–1069.
4. Zieger MAJ, Tredget EE, McGann LE:Mechanisms of cryoinjury and cryoprotection in split-thickness skin. Cryobiology1996,33:376–389.
5. Rubinsky B, Lee CY, Bastacky J, Onik G:The Process of Freezing and the Mechanism of Damage during Hepatic Cryosurgery.Cryobiology1990,27:85–97.
6. Woods EJ, Benson JD, Agca Y, Critser JK:Fundamental cryobiology of reproductive cells and tissues.Cryobiology 2004,48:146–156.
7. Mullen SF, Agca Y, Broermann DC, Jenkins CL, Johnson CA, Critser JK:The effect of osmotic stress on the metaphase II spindle of human oocytes, and the relevance to cryopreservation.Hum Reprod2004,19:1148–1154.
8. Fahy GM, Wowk B, Wu J, Paynter S:Improved vitrification solutions based on the predictability of vitrification solution toxicity.Cryobiology2004,48:22–35.
9. Gao DY, Liu J, Liu C, Mcgann LE, Watson PF, Kleinhans FW, Mazur P, Critser ES, Critser JK:Prevention of Osmotic Injury to Human Spermatozoa during Addition and Removal of Glycerol.Hum Reprod1995,10:1109–1122. 10. Mukherjee IN, Song YC, Sambanis A:Cryoprotectant delivery and removal from murine insulinomas at
11. Wusteman MC, Pegg DE, Wang LH, Robinson MP:Vitrification of ECV304 cell suspensions using solutions containing propane-1,2-diol and trehalose.Cryobiology2003,46:135–145.
12. Karlsson JOM, Younis AI, Chan AWS, Gould KG, Eroglu A:Permeability of the Rhesus Monkey Oocyte Membrane to Water and Common Cryoprotectants.Mol Reprod Dev2009,76:321–333.
13. Benson JD, Chicone CC, Critser JK:A general model for the dynamics of cell volume, global stability, and optimal control.J Math Biol2011,63:339–359.
14. Elmoazzen HY, Poovadan A, Law GK, Elliott JA, McGann LE, Jomha NM:Dimethyl sulfoxide toxicity kinetics in intact articular cartilage.Cell Tissue Bank2007,8:125–133.
15. Wang X, Hua TC, Sun DW, Liu BL, Yang GH, Cao YL:Cryopreservation of tissue-engineered dermal replacement in Me2SO: Toxicity study and effects of concentration and cooling rates on cell viability.Cryobiology2007, 55:60–65.
16. Benson JD, Kearsley AJ, Higgins AZ:Mathematical optimization of procedures for cryoprotectant equilibration using a toxicity cost function.Cryobiology2012,64:144–151.
17. Rall WF:Factors Affecting the Survival of Mouse Embryos Cryopreserved by Vitrification.Cryobiology1987, 24:387–402.
18. Katkov II:A two-parameter model of cell membrane permeability for multisolute systems.Cryobiology2000, 40:64–83.
19. Mullen SF, Li M, Li Y, Chen ZJ, Critser JK:Human oocyte vitrification: the permeability of metaphase II oocytes to water and ethylene glycol and the appliance toward vitrification.Fertil Steril1812–1825,2008:89. 20. Newton H, Pegg DE, Barrass R, Gosden RG:Osmotically inactive volume, hydraulic conductivity, and
permeability to dimethyl sulphoxide of human mature oocytes.J Reprod Fertil1999,117:27–33. 21. Benson JD, Chicone CC, Critser JK:Exact solutions of a two parameter flux model and cryobiological
applications.Cryobiology2005,50:308–316.
22. Lusianti RE, Benson JD, Acker JP, Higgins AZ:Rapid removal of glycerol from frozen-thawed red blood cells. Biotechnol Prog2013,29:609–620.
23. Byrd RH, Gilbert JC, Nocedal J:A trust region method based on interior point techniques for nonlinear programming.Math Program2000,89:149–185.
24. Byrd RH, Hribar ME, Nocedal J:An interior point algorithm for large-scale nonlinear programming.Siam J Optimiz1999,9:877–900.
25. Waltz RA, Morales JL, Nocedal J, Orban D:An interior algorithm for nonlinear optimization that combines line search and trust region steps.Math Program2006,107:391–408.
26. Steponkus PL, Myers SP, Lynch DV, Gardner L, Bronshteyn V, Leibo SP, Rall WF, Pitt RE, Lin TT, MacIntyre RJ: Cryopreservation of Drosophila melanogaster embryos.Nature1990,345:170–172.
27. Rall WF, Fahy GM:Ice-free cryopreservation of mouse embryos at−196 degrees C by vitrification.Nature1985, 313:573–575.
28. Mazur P, Cole KW, Hall JW, Schreuders PD, Mahowald AP:Cryobiological Preservation of Drosophila Embryos. Science1932–1935,1992:258.
29. Kuwayama M, Vajta G, Kato O, Leibo SP:Highly efficient vitrification method for cryopreservation of human oocytes.Reprod Biomed Online2005,11:300–308.
30. Yoon TK, Kim TJ, Park SE, Hong SW, Ko JJ, Chung HM, Cha KY:Live births after vitrification of oocytes in a stimulated in vitro fertilization-embryo transfer program.Fertil Steril2003,79:1323–1326.
31. Antinori M, Licata E, Dani G, Cerusico F, Versaci C, Antinori S:Cryotop vitrification of human oocytes results in high survival rate and healthy deliveries.Reprod Biomed Online2007,14:72–79.
32. Lacelle PL, Rothsteto A:Passive Permeability of Red Blood Cell to Cations.J Gen Physiol1966,50:171–188. 33. Davson H:Studies on the permeability of erythrocytes. The effect of reducing the salt content of the medium
surrounding the cell.Biochem J1939,33:389–401.
34. Karlsson JOM, Szurek EA, Higgins AZ, Lee SR, Eroglu A:Optimization of cryoprotectant loading into murine and human oocytes.Cryobiology2014,68:18–28.
35. Baudot A, Odagescu V:Thermal properties of ethylene glycol aqueous solutions.Cryobiology2004,48:283–294. 36. Seki S, Mazur P:The dominance of warming rate over cooling rate in the survival of mouse oocytes subjected
to a vitrification procedure.Cryobiology2009,59:75–82.
37. Paynter SJ, Borini A, Bianchi V, De Santis L, Flamigni C, Coticchio G:Volume changes of mature human oocytes on exposure to cryoprotectant solutions used in slow cooling procedures.Hum Reprod2005,20:1194–1199.
doi:10.1186/1742-4682-11-13