Technological University Dublin Technological University Dublin
ARROW@TU Dublin
ARROW@TU Dublin
Dissertations School of Computing
2018
Clicking into Mortgage Arrears: A Study into Arrears Prediction
Clicking into Mortgage Arrears: A Study into Arrears Prediction
with Clickstream Data
with Clickstream Data
Gavin O'BrienTechnological University Dublin
Follow this and additional works at: https://arrow.tudublin.ie/scschcomdis
Part of the Computer Sciences Commons
Recommended Citation Recommended Citation
O'Brien, Gavin (2018). Clicking into mortgage arrears: a study into arrears prediction with clickstream data. Masters dissertation, DIT, 2018.
This Dissertation is brought to you for free and open access by the School of Computing at ARROW@TU Dublin. It has been accepted for inclusion in Dissertations by an authorized administrator of ARROW@TU Dublin. For more information, please contact
[email protected], [email protected], [email protected].
This work is licensed under a Creative Commons Attribution-Noncommercial-Share Alike 3.0 License
Clicking into Mortgage Arrears: A Study
into Arrears Prediction with
Clickstream Data
Gavin O’Brien
D14128195
A dissertation submitted in partial fulfilment of the requirements of
Dublin Institute of Technology for the degree of
M.Sc. in Computing (Data Analytics)
ii
ABSTRACT
This research project investigates the predictive capability of clickstream data when used for the purpose of mortgage arrears prediction. With an ever growing number of people switching to digital channels to handle their daily banking requirements, there is a wealth of ever increasing online usage data, otherwise known as clickstream data. If leveraged correctly, this clickstream data can be a powerful data source for organisations as it provides detailed information about how their customers are interacting with their digital channels. Much of the current literature associated with clickstream data relates to organisations employing it within their customer relationship management mechanisms to build better relationships with their customers. There has been little investigation into the use of clickstream data in credit scoring or arrears prediction.
Since the financial meltdown of 2008, financial institutions have being obliged to have mechanisms in place to deal with mortgage accounts which are in arrears or have a risk of entering arrears. A potentially crucial step in this process is the ability of an institution to accurately predict which of their mortgage accounts may enter arrears. In addition to traditional demographical and transactional data, this research determines the impact clickstream data can have on an arrears prediction model. A multitude of binary classifiers were reviewed in this arrears prediction problem. Of these classifiers, ensembles models proved to be the highest performing models achieving reasonably high recall accuracies without the inclusion of clickstream data. Once clickstream data was added to the models, it led to marginal increases in accuracy, which was a positive result.
Key words: mortgage arrears, clickstream, banking, classification, data mining, risk modelling
iii
ACKNOWLEDGEMENTS
I would like to express my sincere thanks to my supervisor, Seán O’Leary, for his assistance and invaluable guidance throughout this dissertation.
I would also like to thank the senior management of Lender A for giving me the opportunity to complete this MSc and also supporting me throughout this dissertation. I’d also like to thank them for allowing the use of Lender A’s data. In addition to this, I would like to express sincere thanks to Kevin, Tommy, Eanna, Lorna, Peter, Yuri, Kulbhushan, Dave T, Aodhán and various other staff members from within Lender A for supporting me and allowing me time to work on this dissertation.
Finally I would like to thank my family, especially my Father, for being extremely supportive over the time I’ve being working on this dissertation and the entire MSc as without this support, I would not have been able to complete it.
iv
TABLE OF CONTENTS
1 INTRODUCTION 1
1.1 OVERVIEW AND BACKGROUND 1
1.2 RESEARCH PROBLEM 4
1.3 RESEARCH OBJECTIVES 4
1.4 RESEARCH METHODOLOGY 5
1.5 SCOPE AND LIMITATIONS 7
1.6 DOCUMENT OUTLINE 7
2 LITERATURE REVIEW 9
2.1 INTRODUCTION 9
2.2 MORTGAGES 9
2.2.1 Irish Mortgage Market during the Celtic Tiger 9
2.2.2 Irish Mortgage Market post Celtic Tiger 12
2.2.3 Mortgage Arrears / Defaulting 15
2.2.3.1 Path into arrears 15 2.2.3.2 Dealing with arrears 17
2.3 CLICKSTREAM DATA 19 2.4 DATA MINING 21 2.4.1 Predictive Modelling 23 2.5 MODELLING ALGORITHMS 23 2.5.1 Decisions Trees 24 2.5.2 Random forests 28 2.5.3 Regression 30 2.5.4 Neural Networks 31
2.5.5 Support Vector Machines 33
2.6 SKEWED DATASETS 37 2.6.1 Random Sampling 38 2.6.1.1 Undersampling / Oversampling 38 2.6.2 Stratified Sampling 38 2.6.3 Synthetic Sampling 39 2.7 MODEL EVALUATION 39 2.8 CONCLUSION 42 3 DESIGN / METHODOLOGY 43 3.1 INTRODUCTION 43 3.2 METHODOLOGY 43
3.3 BUSINESS &DATA UNDERSTANDING 44
3.4 DATA PREPARATION 46
3.4.1 Customer Demographical Data 46
3.4.2 Transactional, Savings & Other Debt Data 49
3.4.3 Mortgage Data 50 3.4.4 Clickstream Data 51 3.4.5 ABT Generation 55 3.4.6 Software Used 57 3.5 MODEL CONSTRUCTION 58 3.6 EVALUATION 61 3.7 CONCLUSION 62 4 IMPLEMENTATION / RESULTS 63 4.1 INTRODUCTION 63 4.2 MODELLING 63 4.2.1 Traditional Features 64
4.2.1.1 Poorly Performing Models 68
v
4.2.3 Clickstream Only Features 75
4.3 RESULTS EVALUATION 77
4.4 CONCLUSION 82
5 CONCLUSION 83
5.1 INTRODUCTION 83
5.2 RESEARCH OVERVIEW AND PROBLEM DEFINITION 83
5.3 CONTRIBUTIONS TO THE BODY OF KNOWLEDGE 84
5.4 EXPERIMENTATION,EVALUATION AND RESULTS 84
5.5 FUTURE WORK AND RESEARCH 86
5.6 CONCLUSION 87
BIBLIOGRAPHY 89
vi
TABLE OF FIGURES
FIGURE 1.1-COLLAPSE AND RISE OF IRISH MORTGAGE MARKET 2007-2016;DATA:(DEPARTMENT OF HOUSING,PLANNING AND LOCAL GOVERNMENT,2018) 2 FIGURE 1.2-ADOPTION OF INTERNET BANK IN THE UK(STATISTA,2018) 3 FIGURE 1.3-KDDPROCESS (FRAWLEY,PIATETSKY-SHAPIRO,&MATHEUS,1992) 6
FIGURE 1.4-CRISP-DMMETHODOLOGY 6
FIGURE 2.1-EMPLOYMENT IN IRELAND FROM 1990–2010(LANE P.,2011) 10 FIGURE 2.2-HOUSE PRICE INCREASES IN IRELAND FORM 1996–2010(NORRIS &BROOKE,2011) 11 FIGURE 2.3–AVERAGE NUMBER OF YEARS’ SALARY TO PURCHASE A HOME FROM 1980–2010(KELLY M.,
2009) 11
FIGURE 2.4-NUMBER OF MABS CLIENTS FROM 2008–2010(NORRIS &BROOKE,2011) 13 FIGURE 2.5-PERCENT OF RESTRUCTURE OPTION DEC 2017(CENTRAL BANK OF IRELAND,2018) 18 FIGURE 2.6-NUMBER OF MORTGAGES IN ARREARS 2009–2017(CENTRAL BANK OF IRELAND,2018) 19
FIGURE 2.7-DATA MINING MAP 22
FIGURE 2.8-VISUALISATION OF DECISION TREE CREATED FOR EXAMPLE 26 FIGURE 2.9-BASIC DECISION TREE (QUINLAN,1986) 26 FIGURE 2.10-COMPLEX DECISION TREE (QUINLAN,1986) 27
FIGURE 2.11-SIMPLE REGRESSION LINE EXAMPLE 30
FIGURE 2.12-COMPLEX REGRESSION LINE EXAMPLE 31
FIGURE 2.13-TYPICAL NEURAL NETWORK ARCHITECTURE (CORTES,GONZALVO,KUZNETSOV,MOHRI,&
YANG,2017) 32
FIGURE 2.14-SAMPLE SVM VISUALISATION 33
FIGURE 2.15-COMPLEX DATASET FOR SVM IN ONE DIMENSION 34 FIGURE 2.16-COMPLEX DATASET WITH EXTRA DIMENSION ADDED 34 FIGURE 2.17-SIMPLE SVM OUTPUT SHOWING MISCLASSIFIED SAMPLE 35 FIGURE 2.18-SIMPLE SVM OUTPUT SHOWING POTENTIAL OVER-FITTED MODEL 36 FIGURE 3.1-NUMBER OF MORTGAGES GROUPED BY NUMBER OF CUSTOMERS ASSOCIATED WITH THE
ACCOUNT. 45
FIGURE 3.2-DUMMY VARIABLE CREATION EXAMPLE 56
FIGURE 3.3-KNIME SAMPLE WORKFLOW 58
FIGURE 3.4-OVERVIEW OF DESIGN PROCESS 61
FIGURE 4.1-CODE TO CREATE DUMMY VARIABLES FOR CATEGORICAL VARIABLES 64 FIGURE 4.2 -BASE DECISION TREE PERFORMANCE 65 FIGURE 4.3-RANDOM FORESTS PERFORMANCE FOR MORTGAGE1.CSV 67 FIGURE 4.4-GBDTPERFORMANCE FOR MORTGAGE1.CSV 67 FIGURE 4.5-ADABOOST PERFORMANCE FOR MORTGAGE1.CSV 68
FIGURE 4.6-LR RESULTS 69
FIGURE 4.7- K-NNRESULTS 69
FIGURE 4.8-CREATING SMOTE SAMPLES VIA KNIME 71
FIGURE 4.9-GDBT FOR MORTGAGE3.CSV 73
FIGURE 4.10-GBDT FOR MORTGAGE2.CSV 74
FIGURE 4.11-ADABOOST FPR FOR MORTGAGE3.CSV 74 FIGURE 4.12-HIGHEST PERFORMING ENSEMBLE MODELS FOR MORTGAGE1.CSV 78 FIGURE 4.13-HIGHEST PERFORMING ENSEMBLE MODELS FOR MORTGAGE2.CSV 79 FIGURE 4.14-HIGHEST PERFORMING ENSEMBLE MODELS FOR MORTGAGE3.CSV 80 FIGURE 4.15-RESULTS OF ENSEMBLES MODELS WITH 250 ON CLICKSTREAM ONLY FEATURES 81
vii
TABLE OF TABLES
TABLE 2.1-LEVEL OF NON-MORTGAGE DEBT HELD BY IRISH RESIDENTS 2000-2010(NORRIS &BROOKE,
2011) ... 17
TABLE 2.2-SAMPLE DATASET ... 24
TABLE 2.3-MODEL PERFORMANCE FROM (BARBOZA,KIMURA,&ALTMAN,2017) ... 30
TABLE 2.4-COMPARISON OF VARIOUS MODELS (CHAUDHURI &DE,FUZZY SUPPORT VECTOR MACHINE FOR BANKRUPTCY PREDICTION,2011) ... 36
TABLE 2.5-SAMPLE CONFUSION MATRIX (GROMSKI, ET AL.,2009) ... 40
TABLE 3.1-CRISP-DMSTEPS ... 43
TABLE 3.2-CUSTOMER DEMOGRAPHIC FEATURES ... 48
TABLE 3.3-TRANSACTIONAL,SAVING AND OTHER DEBT FEATURES... 50
TABLE 3.4-MORTGAGE DATA FEATURES ... 51
TABLE 3.5-CLICKSTREAM DATA FEATURES ... 55
TABLE 3.6-INPUT DATASETS ... 60
TABLE 4.1-MODELLING ALGORITHMS TESTED ... 66
TABLE 4.2-NBCONFUSION MATRIX ... 70
TABLE 4.3-RESULTS OF RANDOM FORESTS ON MORTGAGE2.CSV AND MORTGAGE3.CSV WITH CLICKSTREAM FEATURES REMOVED ... 72
TABLE 4.4-RESULTS OF RANDOM FORESTS ON MORTGAGE2.CSV AND MORTGAGE3.CSV WITH CLICKSTREAM FEATURES INCLUDED ... 73
TABLE 4.5-RF RESULTS FOR CLICKSTREAM ONLY DATASETS ... 75
TABLE 4.6-GBDT RESULTS FOR CLICKSTREAM ONLY DATASETS ... 76
TABLE 4.7-ADABOOST RESULTS FOR CLICKSTREAM ONLY DATASETS ... 77
TABLE A.1-RESULTS OF GBDT ON MORTGAGE2.CSV AND MORTGAGE3.CSV WITH CLICKSTREAM FEATURES REMOVED ... 94
TABLE A.2-RESULTS OF GBDT ON MORTGAGE2.CSV AND MORTGAGE3.CSV WITH CLICKSTREAM FEATURES INCLUDED ... 94
TABLE A.3-RESULTS OF ADABOOST ON MORTGAGE2.CSV AND MORTGAGE3.CSV WITH CLICKSTREAM FEATURES REMOVED ... 95
TABLE A.4-RESULTS OF ADABOOST ON MORTGAGE2.CSV AND MORTGAGE3.CSV WITH CLICKSTREAM FEATURES INCLUDED ... 95
1
1
INTRODUCTION
1.1 Overview and Background
This research will be conducted using data from a large Irish financial institution which operates throughout Ireland via both a traditional branch network and through various digital channels. To protect their anonymity, their name will not be used, and the pseudonym Lender A will be used instead.
During the 1980’s, the Irish economy was bleak. Unemployment was averaging approximately 14% and over 40% of Irish tax payers were paying a marginal tax rate of 45% (Whelan, 2009). However this time came to an end in late 1990’s when the Irish economy began to boom. Known as the Celtic Tiger, this prosperous time in Ireland was driven mainly by the construction trade and Ireland joining the single currency of the EU in 1999. During this time the construction boom led to an employment boom and consequently employment was nearing full levels. Due to this, the tax income for the government increased exponentially and government spending increased substantially. As more people were entering high salary employment, many wanted to get their foot onto the property ladder. This coupled with the desire of many people to upgrade their home led to housing demand outstripping supply which consequently led to house prices skyrocketing with the average price of a home in Dublin hitting €400,000 and €250,000 outside Dublin (Norris & Brooke, 2011). Prior to 1997, Irish financial institutions employed their own deposits to finance loans. After this, they began using interbank loans and international bonds to fund lending. However these source of funds came an abrupt halt in 2008 after the collapse Lehmann Brothers in late 2007. This collapse is attributed to Lehmann Brothers lending too much capital to the sub-prime mortgage market.
This collapse of the Irish mortgage continued until 2011 at which point only 12,834 mortgages were approved across all of the Irish financial institutions. However since 2011, the market has begun slowly to rise again as is show in figure 1.1. Consequently financial institutions are cautious with regards who they are lending to and also their current mortgage stock. After the financial meltdown of 2008, the Irish government introduced legislation in an attempt to prevent such substantial damage to the Irish economy occurring again due to the mortgage market collapse. Contained within this legislation were various measures aimed at mitigating the mortgage market becoming over-inflated which could lead to another collapse. One of these measures was the
2
creation of the Mortgage Arrears Resolution Process (MARP). Financial institutions must have mechanisms in place to cater for MARP which requires them to help borrows in arrears or at the risk of entering arrears.
Figure 1.1 - Collapse and rise of Irish mortgage market 2007-2016; Data: (Department of Housing, Planning and Local Government, 2018)
Since the collapse of the Irish economy in 2007/2008, Irish financial institutions have been required to streamline their processes in an attempt to reduce costs. One driving factor of this streamlining is encouraging the adoption of digital channels which reduces the overall number of branches and branch staff required by financial institutions. A prime example of this framework is N26, a German based mobile bank which operates zero branches in Ireland but offers services similar to other financial institutions which have an entire network of branches. Additionally there are also various other Fintech organisations such as PayPal and Stripe which traditional institutions have to compete with in addition to their current competition in the Irish market.
Consequently institutions across Ireland and Europe are being forced to innovate and change. They have to employ technology and data in an attempt to become a customer centric organisation. This is the primary driver behind these institutions pushing their digital channels to their customers. Figure 1.2 shows the adoption rate of internet banking in the UK financial sector. This shows there is strong growth in the adoption of digital channels in the UK. Similarly 58% of Irish citizens used internet banking in 2017 (Taylor, 2018).
3
Figure 1.2 - Adoption of internet bank in the UK (Statista, 2018)
A by-product of this digital adoption is the institutions ability to monitor their customer interactions with their digital channels. This is the source of their clickstream data. Up until now, Lender A have only employed its clickstream data for driving direct sales to customers. For example if a customer used the loan calculator but did not follow through with applying for the loan, the customer may receive a phone call from direct banking enquiring whether they would like to apply for the loan or whether they had any queries with the application process.
Apart from this purpose, Lender A are driving little value from their clickstream data. This was the driving force behind this research. As Lender A must be compliant with Irish legislation, they are required to have a team which maintains their MARP. Within Lender A, the Arrears Support Unit (ASU) have this responsibility. If Lender A were able to predict accurately who may enter arrears, they may be able to engage with the customers pre-emptively and avoid further issues such as the potential of a customer default on the mortgage account.
Currently Lender A do not employ any model to predict if a mortgage account may enter arrears. They do have models to predict accounts which have a risk of default, which is an account in arrears over ninety days. Therefore if a model could be created which could predict if an account may enter arrears it should prove to be beneficial to Lender A. As the adoption of digital channels continue to grow in the financial sector, clickstream data should become more abundant for customers and therefore may provide
4
valuable insights to the financial life of a customer. A change in how a customer is interacting with Lender A’s digital channels could indicate a change in their financial stability and therefore may potentially indicate that they may be about to enter arrears. For example, if a customer was logging on various times throughout the night, this could indicate they are under financial stress which could be a trigger for an arrears event to occur. Therefore close attention will be payed to the times a customer logs onto their online banking. In addition to utilising the times a customer connects with Lender A’s digital channels, other features such as specific events they complete online may indicate potential problems in their personal funds. An example of this could be applying for a loan top up.
All of these clickstream features will be coupled with traditional features such as a customer’s age, spending history and savings amount etc. in an attempt to create an accurate model which can predict if an account has the potential of entering arrears one month in advance of the arrears event occurring. This timeframe gives Lender A’s ASU team suitable time to contact the customers and attempt to provide help to the customers by methods such as restructuring their mortgage.
1.2 Research Problem
Lender A’s Enterprise Data Warehouse (EDW) contains a multitude of “traditional” data which could be employed as the input to a mortgage arrears prediction model. This research project aims to establish the impact clickstream data can have to the prediction capability of a mortgage arrears prediction model.
1.3 Research Objectives
The primary goal of this research is to determine if the addition of clickstream data can impact the performance of a mortgage arrears predication model. This research will be conducted utilising data from Lender A’s EDW.
The research objectives are as follows:
Study the up-to-date literature regarding the Irish mortgage market and clickstream data analysis.
Examine and review research in the area of data mining to understand modern approaches to two-class classification problems.
Aggregate various data sources to a singular record for a mortgage account to allow for the creation of a single analytical base table (ABT) which will contain
5
all of the features in addition to an ARREARS_IND flag indicating the arrears status of the account.
Design experiments to test the hypothesis
Implement various predictive modelling algorithms on a base dataset containing only traditional features to understand how the models are performing and also to establish the highest performing models.
Using the highest performing models from the point above, add clickstream data to the source dataset and run the models once again to obtain the model performance with clickstream data.
Preform an investigative analysis using a dataset containing only clickstream features to establish the power of clickstream features for mortgage arrears prediction.
Analyse the results of the experiments to establish the impact clickstream data had on the models. Also attempt to understand classification errors and poorly performing models.
Evaluate the success or failure of the experiments.
Define how this research could be expanded upon and what future work could be carried out in this area.
1.4 Research Methodology
The empirical research untaken for this dissertation will involve performing experimentation on a mortgage accounts historical transactional, demographical and clickstream data. Suitable evaluation techniques will be employed to determine the success of these experiments. All models created and implemented during the experimentation will be measured using statistical methods to allow for the comparison of their performance. The area of the research is essentially a two class classification problem. In addition to this, other areas are mortgage arrears classification and clickstream data analysis.
Two class classification is a core pillar of Data Mining (DM). DM is the process of attempting to predict future events based on historical events. This challenge of predicting future events from historical events is not a new challenge. In 1992, (Frawley, Piatetsky-Shapiro, & Matheus, 1992) proposed the framework of Knowledge Discovery in Databases (KDD). They defined KDD as “The non-trivial process of identifying valid, novel, potentially useful, and ultimately understandable patterns in data.” (Frawley,
6
Piatetsky-Shapiro, & Matheus, 1992). This framework has steps to enable a researcher to go from raw data through to deriving useable insights from the data.
Figure 1.3 - KDD Process (Frawley, Piatetsky-Shapiro, & Matheus, 1992)
In addition to KDD, the Cross Industry Standard Process – Data Mining (CRISP-DM) will be leveraged to perform the experiments. The CRISP-DM methodology is a data mining process approach which defines commonly used techniques for the entire roadmap of a data mining project. This process involved six steps and will be discussed further in subsection 3.2 and can be seen in figure 1.4.
7
1.5 Scope and Limitations
The project will focus on attempting to predict whether a mortgage account has a risk of entering arrears one month in advance of the arrear event occurring. Principle dwelling home (PDH) mortgages will be the focus of this research while buy-to-let (BTL) mortgages are excluded.BTL mortgages are excluded as the customer who is paying the mortgage would very rarely own one property and also generally have bought the property as an investment not a home. Consequently the entire PDH mortgage stock of Lender A will be utilised for the research.
The previous six months of data will be examined up to the date of prediction or the date of arrears for an account. For example, if the model is attempting to predict the account arrear status as of Sept 2017, the period which will be examined is the previous six months, Mar 2017 – Aug 2017. For all accounts not in arrears, this is the date range which will be used. If an account is in arrears, the date range will be the six months previous to the arrears event occurring. All demographical, transactional and clickstream data will be acquired from this date range and be aggregated to one record which will be added to an ABT. This ABT will contain one record per mortgage account and will be the source dataset for all modelling purposes.
All of the data used for the experiments will be extracted from Lender A’s EDW. All of the “traditional” features such as a person’s age, employment status and transactional history etc. are captured on numerous source system and fed into the EDW via various methods with little transformation (I.E. the EDW is an historical view of the source systems). The clickstream data is treated slightly differently. It is originally captured in an Hadoop environment via a MapReduce process and loaded into the EDW via and ETL tool. During this loading process, the clickstream/digital events are created as per rules pre-defined by Lender A. These are the rules which allow for the digital events to be categorised. This event classification will be leveraged heavily for the purposes of this research as certain events will be used as input features to modelling algorithms.
1.6 Document Outline
The remainder of this dissertation is organised into the following chapters; the Literature Review of the project area and data mining, Design of the experiments and Methodology of the research, Implementation and Results of the experiments and finally, the Conclusion.
8
Chapter 2 presents an encompassing view of the Irish mortgage market dating from pre Celtic Tiger Ireland through to a modern day mortgage market. In addition to this, clickstream data are presented along with their various uses and capture methods. Finally data mining techniques are examined including model evaluation techniques and methods for handling skewed datasets.
Chapter 3 discusses the methodology and design of the experiments carried out to determine the impact clickstream data can have on a mortgage arrears prediction model. The various different data sources are presented along with the software employed to implement the experiments. Finally the evaluation techniques used to determine the performance of the models are discussed.
Chapter 4 details the implementation of the experiments along with presenting the results. Detail of certain paths of research are discussed along with the rationale for choosing the paths based on the outcome of the experiments. Finally the results of all of the experiments are discussed and evaluated.
Chapter 5 finishes by reviewing the outcome of the experiments undertaken to establish the impact clickstream data had on a mortgage arrears predication model and concludes with further research and experiments which could be done in this field.
9
2
LITERATURE REVIEW
2.1 Introduction
This chapter will cover the relevant literature in relation to predictive modelling, mortgages and clickstream data, paying close attention to the Irish mortgage market and the banking industry in general. The insights gained from the literature review will help to determine the direction of this research. An in depth look into the Irish mortgage market both during and post Celtic Tiger Ireland will be presented followed by a review of clickstream data with a discussion of how it is captured and how it can be used. The key methodologies employed in the construction of predictive models will also be examined and accompanied with basic examples of how they function. In addition to this, various methods of evaluating the performance of predictive models will also be examined and justification for choosing certain evaluation methods over other evaluation methods will be presented.
As with many other predictive modelling issues, mortgage arrears fall into the category of skewed datasets. That is, mortgages in arrears are often a far smaller proportion of the dataset compared to mortgages which aren’t in arrears. This can lead to difficulties in the modelling process and consequently the current literature on working with skewed datasets will also be reviewed.
2.2 Mortgages
In this section, there will be an in-depth examination of the Irish mortgage market, mortgage arrears and how people enter into arrears and how financial institutions deal with mortgage arrears. As the focus of this research is a mortgage lender in the Irish financial market, the main focus of this section will be the Irish mortgage market from before the Celtic Tiger through to the economic collapse of 2007/2008 and up until the modern day market.
2.2.1 Irish Mortgage Market during the Celtic Tiger
Between the late 1990’s and late 2007, the Irish economy was booming. Known as the “Celtic Tiger”, this prosperous time in Irish history contained exponential growth and led to an explosion in the demand for housing. However this was an entirely new situation to Ireland. The previous decade was bleak with high unemployment rates averaging approximately 14% and over 40% of Irish taxpayers paying a marginal rate of 45% in tax (Whelan, 2009). One of the main driving forces behind this prosperous period was Ireland joining the single currency of the EU in 1999 with another being the
10
construction trade. During this period, compared to the rest of the EU with the exception of Spain, Ireland was by far the largest constructor of housing, with 18 units per 1000 of the population being completed to an average of 5.3 units per 1000 of the population for the rest of the EU (CSO, 2008). This construction boom led to an employment boom which in-turn led to salaries in all sector rising to uncompetitive levels which consequently led to substantial increase in tax revenues which led to unprecedented levels of governmental spending. A result of the employment boom was the level of employment nearly doubling from 1990 to 2007, as can be seen in figure 2.1.
Figure 2.1 - Employment in Ireland from 1990 – 2010 (Lane P. , 2011)
As employment was near full levels, more and more people were attempting to get their foot onto the property ladder. This coupled with the wish of many people to upgrade their housing, led to the demand for housing outstripping supply which in turn led to explosive increases in the pricing of houses (Flavin & Connor, 2013). Figure 2.2 shows the increase of house prices across the country from 1996 through to 2007, before collapsing when the global financial crisis began to bite.
11
Figure 2.2 - House price increases in Ireland form 1996 – 2010 (Norris & Brooke, 2011)
As can be seen in figure 2.3, the rise of salaries did not keep up with the rise in house prices. In 1995, it took approximately four years earning to purchase a house across the country, where-as in 2007 it took seventeen years of earning to purchase a second-hand home in Dublin, and an average of 12 years across the country.
Figure 2.3 – Average number of years’ salary to purchase a home from 1980 – 2010 (Kelly M. , 2009)
This all eventually accumulated in 2009 to where the size of the mortgage market grew to over €150B, which was over 100% of the late 2009 Irish GNP. Of this €150B, only around €40B was secured by assets (Kelly, 2009).
12
In the years leading up to the “Celtic Tiger”, Irish financial institutions employed their customer’s deposits as their source of funds for their lending. However this changed in 1997 when the institutions began using interbank loans and international bonds as a funding source for their lending. As of 2008, this led to over 50% of source of funds for loans coming from funds for which the institutions did not have deposits (Kelly, 2009). Consequently, the growth of the Irish mortgage market increased rapidly. The size of the market in 1997 was approximately €20B (in 2009 prices), with half of this being advanced to property developers. By 2008, the market had grown to €140 Billion, with €110B advanced to property developers (Roche, 2014). After the collapse of the Lehmann Brothers in 2007, the interbank loans and international bonds on which the Irish banks had become entirely dependent dried up and consequently the institutions were on the verge of collapse which would have been catastrophic for Ireland. To prevent this occurring, in an unprecedented move the Irish government stepped in and implemented a blanket guarantee scheme on all deposits at each of the covered institutions. In Europe, Denmark was the only other nation to impose a blanket guarantee on their financial institutions (Kelly, 2009).
2.2.2 Irish Mortgage Market post Celtic Tiger
The proposal by the Irish government to impose the blanket guarantee on Irish financial institutions was decided at a late night meeting with the financial institutions involved. While it has never been publicised, the most likely justification is that the government still believed the liquidity problems of the Irish institutions merely mirrored the instability of the global financial market in the wake of the Lehmann Brothers collapse (Kelly, 2009). The institutions shares prices began to steadily decline around March 2007, and despite the government’s efforts, multiple financial institutions continued to decline which led to the government nationalising various institutions such as Anglo Irish Bank and also announcing the creation of a “bad bank”, which was called the National Assets Management Agency (NAMA).
The purpose of NAMA was simple. It was to purchase non-preforming loans from Irish financial institutions in an attempt to recapitalise them. For example, if Institution A had €20B in capital and €150B in loans with €40B of developmental loans, and lost 50% of these developmental loans, their capital is wiped out and therefore they become insolvent. If NAMA was to purchase the €40B of development loans, the institutions becomes recapitalised and therefore can continue to operate. However a substantial
13
downfall of this is the Irish taxpayer faces a significant loss while the institutions shareholders face little to no repercussions (Whelan, 2009). Generally, NAMA is considered an international success story for dealing with bad assets (Schoenmaker, 2015).
However NAMA could not provide assistance on loans less than €20 million or to mortgages holders struggling to meet their financial commitments. Consequently this led to many mortgage holders turning to the Money Advice and Budgeting Services (MABS). MABS is the Irish government’s money advice service offering free assistance and information about options available to borrowers in difficulty to allow them to meet their financial commitments. They also offer to act as an intermediary between the mortgage holders and the financial institutions to ensure the borrowers legal rights are upheld (Norris & Brooke, 2011). Figure 2.4 shows the number of clients turning to MABS for assistance grew steadily from 2008 through to 2010.
Figure 2.4 - Number of MABS clients from 2008 – 2010 (Norris & Brooke, 2011)
Between 2007 and 2012, the average price of homes in Ireland tumbled by 50% while at the same time unemployment rose from 5 to 15% (Kelly & O'Malley, 2016). Dublin was hit hardest by this collapse in house pricing where the average drop was 55% while the rest of the country fared only slightly better with a drop of 43%. As a result of this, there was a multitude of mortgages with high repayment burden and many which had entered negative equity. Negative equity occurs when the value of the home, on which the mortgage is secured, drops below the amount owed to repay the mortgage and
14
consequently if the home is sold the mortgage lender cannot be fully repaid without the mortgage holder finding a further source of funds (EBS, 2017).
As mentioned in subsection 2.2.3, a mortgage arrears event is deemed to have occurred when a borrower has failed to make a mortgage repayment by a defined due date. The number of mortgages in arrears has continued to decline steadily each quarter since early 2014. As of Q4 2017, the number of mortgages in arrears in Ireland was a total number of 70,448, which is approx. 10% of the PDH mortgage market (Central Bank of Ireland, 2018). Further to this, 118,477 mortgages were classified as restructured with 87% of these mortgages deemed as meeting their restructuring obligations, which is a slight decrease from the Q3 2017. This is the eighteenth consecutive quarter where the number of mortgages in arrears have been declining since 2014 (Central Bank of Ireland, 2018). In response to the collapse of the mortgage market and the end of the Celtic Tiger, a number of governmental policies changes were implemented in an attempt to reduce future risk. These changes included an introduction of a Mortgage Arrears Resolution Process (MARP) which all financial institutions must comply with in an attempt to help borrowers who have either entered arrears or may be of risk entering arrears. Consequently, if this research can be used to determine who may be of risk of entering arrears, it would be beneficial to the teams from Lender A who are involved in the MARP. Along with the introduction of MARP, there was also a moratorium on the repossessions of primary residence for 12 months since the initial arrear occurring (Norris & Brooke, 2011).
In addition to this, there were also limits brought into force to alleviate the possibility of borrowers receiving more than they can afford. This includes a limit of 3.5 Loan-to-income (LTI) on mortgages (that is, if a person’s salary is €50,000, the maximum mortgages then can receive is 3.5 times this amount, €175,000) and also Loan-to-value (LTV) limits. As of January 2017, first time buyers have a limit of 90% LTV on their mortgage request. Therefore, a first time buyer is required to have a 10% of their mortgage requirement as a deposit. If a person is not a first time buyer, their LTV limit is reduced to 80% consequently meaning they need 20% of their mortgage requirement as a deposit (Citizens Information, 2018). However there are some exceptions to these rules. From January 2018, financial institutions have some extra flexibility in how they can offer exceptions to potential borrowers. For LTI mortgages, they can allow up to
15
20% for first time buyers and 10% for second and subsequent buyer on their mortgages. For LTV mortgages, since January 2017, first time buyers are allowed up to 5% of the value of their mortgage for their primary residence in a calendar year to be above the 90% limit. For second time and subsequent buyers, the limit is 20% of the value of the new lending (Lane, 2017). All of these measures were introduced in an attempt to avoid the situation mentioned previously where the size of the mortgage market grew to over 100% of the Irish GNP.
2.2.3 Mortgage Arrears / Defaulting
As per section 3(a) of the Code of Conduct on Mortgage Arrears, a mortgage arrear is defined as:
“A mortgage arrears problem arises as soon as the borrower fails to make a mortgage repayment by the due date” (Central Bank of Ireland, 2018).
For the purpose of this research, Lender A defines a “default” as a mortgage which has been in arrears for more than 90 days.
2.2.3.1 Path into arrears
There are various reasons why a borrower may enter arrears. Generally these reasons are unforeseen and/or unavoidable and can vary wildly. For example, these reasons can range from a personal issues such as a child birth, a serious illness, a family bereavement through to issues out of the borrowers control such as losing their employment or the financial institutions raising their interest rates (Kelly M. , 2009; Norris & Brooke, 2011). (McCarthy, 2014) found that if a household has children, they are 5% more likely to enter arrears over households which have no dependent children.
Unemployment is perhaps one of the leading causes of a borrower entering arrears. (Kelly, 2009) concludes that unemployment has a far greater effect on arrears in Ireland when compared to the rest of Europe. He reasons that one crucial factor of a borrower coming out of arrears is the ability to fully service their debts and consequently they need to be in employment. Therefore he believes the focus on debt reduction is not correct and polices which look to enable the domestic economy to function correctly, and thus increase employment is far more likely to reduce the number of borrowers in arrears.
As mentioned earlier, throughout the Celtic Tiger house prices were soaring. Consequently many mortgages were taken out based on the income of two salaries to
16
enable the borrowers to meet large repayments. As these mortgages were dependant on two salaries, they had at a greater risk of entering arrears as it only required one of the mortgage holders to either become unemployed or have their salary reduced. Also along with this risk, another potential issue introduced with this type of mortgage is around the potential of the borrowers separating and therefore there would no-longer be two salaries to support the mortgage (McCarthy, 2014).
(Norris & Brooke, 2011) interviewed various borrowers about their mortgages and found that the majority who took out mortgages from main financial institutions felt the repayments were sustainable in the economic climate when they drew-down their mortgage, while a minority of the interviewees admitted they felt their repayment were never sustainable. From this minority of borrowers who admitted their mortgage was not sustainable, a vast majority had received their mortgage from a sub-prime lenders. Essentially, sub-prime lending is offering loans to borrowers who wouldn’t be suitable for a loan from a main financial institution, for a variety of reasons such as a previous loan default or a low credit rating (Norris & Brooke, 2011). Of the borrowers interviewed some of them acknowledged they had entered arrears due to a reduction in the take home remuneration due to for example, extra levies imposed on public sector workers, however the majority of people who entered arrears due to income reduction were self-employed. Another factor identified by this research was a borrower who entered arrears due to a gambling addiction. Utilising a customer’s web browsing habits could indicates dangers such as this as the customer may be moving money between their online accounts regularly, or they may be log in multiple times at hours which wouldn’t be considered normal banking hours.
Along with the multitude of potential issues mentioned above, another potentially serious issue which can potentially lead a borrower into arrears are further financial commitments such as a personal loan or a credit card bill. As can be seen in table 2.1, the level of non-mortgage debt owned by Irish residents from 2000 to 2010 was a significant amount. (Keeney & O'Donnell, 2009) found that in 2007/2008, 13% of households re-mortgaged their home to unlock equity and in some cases attempt to pay-off their non-mortgage debt to enable them to only have one debt, which would be the mortgage.
17
Table 2.1 - Level of non-mortgage debt held by Irish Residents 2000-2010 (Norris & Brooke, 2011)
2.2.3.2 Dealing with arrears
The ability of a financial institution to recoup their loan is a formidable tool which can be used to dissuade a borrower from defaulting on their mortgage. This ability is called recourse and mortgages (and loans in general) are split into two categories, full recourse mortgages and non-recourse mortgages (Flavin & Connor, 2013). A full recourse mortgage gives the financial institution the ability to recover all borrowings from the sale of the security on the mortgage and also borrower themselves if the sale of the security of the loan does not cover all borrowings. A non-recourse mortgage only allows the financial institution to recover the amount from the sale of the security of the mortgage and they cannot pursue the borrowers for any potential disparity in the amount owned against the amount raised by the sale of the security (Flavin & Connor, 2013). For mortgages, the security is generally the property for which the mortgage was taken out.
In the US mortgage market, non-recourse mortgages are relatively common. In some US states, lenders may have no recourse other that their ability to reprocess and sell the property. For these states, there is an approx. 20% higher chance of default compared to states which allow full recourse (Kudlyak & Ghent, 2011). In contrast, in Ireland and the majority of Europe, financial institutions have full recourse on their mortgages and consequently borrowers are far more reluctant to default on their mortgage as they are still liable for any outstanding amount not recouped by the sale of the security of the mortgage. Due to this, the number of repositions in Ireland is relatively low when compared to the US mortgage market where repossessions are relatively common
18
(Kudlyak & Ghent, 2011). Financial institutions also have to abide by the new polices mentioned earlier where they have to allow a 12 month moratorium on repossessions after the first date of arrears. Finally, in Ireland repossessions have both higher legal costs and can damage a financial institutions public image. This is a further reason why Irish financial institutions are reluctant to reprocess.
The favoured technique of the Irish government, CBI and the Irish financial institutions is to attempt to restructure mortgages who have been in difficultly for a long periods (Norris & Brooke, 2011). Restructuring a mortgage can take many forms including but not limited to a switch to an interest only mortgage for a certain period of time; a reduction in monthly payment amount; a temporary deferral of payment of interest; arrears capitalisation (spreading the arrears amount over the rest of the term of the mortgage); extending the term of the mortgage; a write-down of some of the outstanding balance or a split mortgage (the mortgage is split into two parts to enable the reduction of the monthly repayments (Banking & Payments Federation Ireland, 2015). As of December 2017, 118,477 PDH mortgages were considered as restructured. Figure 2.5 shows the distribution of options of restructuring and clearly shows that arrears capitalisation and split mortgages are the most common method of restructuring mortgages accounting for approx. 56% of all mortgage restructures at the end of December 2017.
19
As of December 2017, there was 729,722 PDH mortgages in Ireland, equating to approx. €98.5 billion. Of these 70,488, or approx. 10% were in arrears. Of these mortgages in arrears, 48,433 were in arrears for more than 90 days. For these account in arrears over 90 days, they equate to approx. 10% of all outstanding balances for PDH mortgages (€9.7 billion). If these accounts were held by Lender A, they would therefore be considered as having defaulted. The number of mortgages in arrears has been declining steadily since mid-2013, which is a positive trend and can be seen in figure 2.6.
Figure 2.6 - Number of mortgages in arrears 2009 – 2017 (Central Bank of Ireland, 2018)
2.3 Clickstream Data
Clickstream data are an extremely powerful data source which is used extensively in marketing and Customer Relationship Management (CRM). (Poel & Buckinx, 2005) utilises clickstream data to predict purchasing behaviour of a user, while (Raphaeli, Goldstein, & Fink, 2017) utilises clickstream data across various channel’s such as web and mobile to determine how users are interacting with websites and conclude that users of the website are more exploratory while mobile use is more task focused. This one key insight alone could help drive an organisation’s decision on the information to display on their website for users who are accessing with different methods and devices.
20
(Bucklin & Sismeiro, 2009) defined clickstream data as “the electronic record of Internet usage collected by Web servers or third-party services” (Bucklin & Sismeiro,
2009). Another potential way of thinking about clickstream data is to consider it an activity log of a user’s interactions with a digital service, be it a website, mobile/tablet app or a bank branch kiosk for example. Clickstream data can be collected in a variety of methods, but all methods fall into one of two categories: site-centric or user centric. Site-centric occurs when an organisation monitors the users of one specific website and user-centric occurs when a user is monitored across various websites.
Site-centric monitoring is generally used by smaller organisations who’s users may be paying for a service, in the case of this research Lender A’s customers who interact with the digital services they offer. User-centric would be used by organisations who drive profit by displaying relevant ads to it users. To enable them to display relevant ads, they track all aspects of customer while they browse the internet. For example, Google will store all searches a user makes and will also store any links a user’s clicks on from the search (Tene, 2008). This enables them to get detailed information about a user without the user even realising it. If a person was to search for “how to trim dog nails”, Google could infer the person has a dog and consequently display ads for pet groomers local to the person as their general location can be determined via the IP address.
In addition to site-centric and user-centric collection methods, the actual data collection falls into two categories: server-side collection and user-side collection (Srivastava, Cooley, Deshpande, & Tan, 2000). (Srivastava, Cooley, Deshpande, & Tan, 2000) conclude that user-side collection is a superior method as it alleviates some of the issues related to server-side collection, such as when pages are cached and do not require a call to the server. However one pitfall of user client-side collection is the ability of the client to disable the collection of data if they wish. An example of this would be if an organisation is employing JavaScript to perform the monitoring and collection, a user could disable JavaScript or simply block the script which is executing the monitoring and consequently the organisation would have no collected data for that user. If this occurs, the organisation can implement changes to force the user to enable JavaScript, but this may drive the user away from the digital service.
Lender A employs various technologies to enable them to monitor their customers as they interact with their digital channels which enables them to get a deeper
21
understanding of their customers by understanding how they interact with their digital channels. They capture information such as the device being used, time of logon, what kind of actions the user is making (such as transferring money etc.), how long they spent logged on, what specific pages they visited while on the website amongst other information. Currently, this information is being used to drive email campaigns to customers by enabling Lender A to understand who is interacting with their emails. There is also on-going work to determine how valuable clickstream data is when used for fraud detection with early indications showing it can provide a positive outcome for fraud detection.
2.4 Data Mining
As technological advancements continue at a blistering pace and it’s ubiquity in our everyday lives also swells, more and more organisations are realising the potential beneficial value of effectively leveraging their customer’s data for various reasons such as profit growth and improving the CRM with their customers as well as protecting themselves. As an example of this, Amazon.com offers personalised home pages to its customers based on personalisation models and many credit card and phone companies use the analysis of their customer’s data to enable fraud identification (Yang & Padmanabhan, 2003). The use of these models would fall under the umbrella term of Data Mining which is the process of examining and analysing existing data in an attempt to discover new useful knowledge.
(Frawley, Piatetsky-Shapiro, & Matheus, 1992) proposed a process of enabling the discovery of finding useful knowledge in data, known as ‘Knowledge Discovering in Databases’ (KDD). Data Mining is one of the core components of KDD, but it is only one of a number of steps including selection, pre-processing and transformation amongst others. They defined KDD as
“The non-trivial process of identifying valid, novel, potentially useful, and ultimately understandable patterns in data.” (Frawley, Piatetsky-Shapiro, & Matheus, 1992)
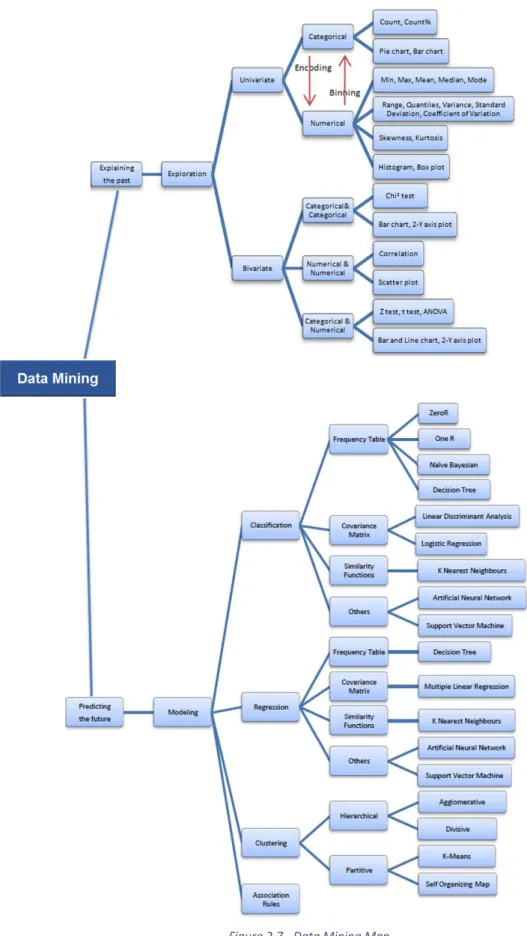
Within the discipline of Data Mining, there are several different statistical and analytical approaches which can be used to extract knowledge from data. Perhaps one of the more educational visualisations to represent Data Mining was created by Dr Syed Sayad, a professor from the University of Toronto with over 20 years knowledge in data science, machine learning and artificial intelligence (Sayad, 2018). Dr Sayad created the “Data
22
Mining mind map which shows various techniques using during the Data Mining process and can be seen in figure 2.7.
23 2.4.1 Predictive Modelling
For this research, the main interest in a subset of Data Mining known as Predictive Modelling. Predictive modelling is a method where-by there is an attempt to predict future events based on historical events. To achieve this, historical samples containing explanatory attributes relative to a target outcome which we are attempting to predict are investigated to determine their correlation. The models used for this process function by accepting these attributes as input and applying mathematical transformations in an attempt to predict what the outcome associated with the input will be. As historical events are employed to build the models, it enables the accuracy of the model to be easily validated as the events used to construct the models can be examined at a later date to the events being used to train and test the model.
One of the key challenging factors associated with attempting to use predictive modelling to predict future events is the attributes of these unseen events are not likely to be the same as the events which are being utilized to train the model. For this reason, it is crucially important that the model is not over-fit to the historical events as this may not lead to a model that will generalise well to future events. Certain processes and methods can be employed in an attempt to reduce the possibility of this occurring and these will be discussed further in subsection 2.7.
2.5 Modelling Algorithms
The goal of this research is to determine if a customer’s clickstream data can be utilized in addition to their demographic and transactional data to determine if they are at risk of entering arrears on their mortgage. As mentioned above, predictive modelling is the attempt to predict future events based on historic events. To achieve this, one or more modelling algorithms are used. Predictive modelling can be applied in various locations across broad spectrums of technological and business area such as cancer prediction (Yokota, et al., 2003), student attrition (Camba, David, Betan, Lagman, & Caro, 2016), bankruptcy prediction (Chaudhuri & De, 2011) and reading car number plates (Li, Wang, You, & Shen, 2018).
When applied correctly, predictive modelling can be extremely beneficial to an organisation. However, if an organisation doesn’t employ a suitable algorithm for their data, they may not see favourable results from their modelling. Financial institutions have been using models for many years as an attempt to reduce their overall risk and
24
drive their profits upwards. Since the economic meltdown of 2008, this has become even more important to the financial sector as they attempt to avoid a repeat of the 2008 crash. With the tightening of the Irish and EU credit law, both Irish and EU regulators are now very stringent to ensure EU financial institutions are complying with the latest IFRS9 (International Financial Reporting Standard 9) accountancy standardisation rules and are continually auditing EU financial institutions to enforce the IFRS9 rules. IFRS9 sets out guidelines which financial institutions must follow and it specifics what models a financial institution must have, such as a model for Expected Loss Impairment (Leman, 2015).
There are many algorithms which could be employed for both the requirements of IFRS9 and other predictive modelling requirements of Lender A, such as mortgage arrears prediction. In this section, five algorithms will be examined closely to determine how they function and their potential uses.
2.5.1 Decisions Trees
Decision Tree algorithms function by attempting to split the data into classes based on the attributes contained within the data and that attributes relationship to the target attribute (class). Preceding the splitting of the data, if a record was randomly chosen from the dataset, the degree of ambiguity as to which class it will belong to is entirely relative to the distribution of classes in the original dataset. For example, if a random record was chosen from the table 2.2, there would a 30% chance the piece of fruit was edible, and a 70% chance it is not edible. This is because there were 7 of the 10 fruits which are not edible while only 3 are.
Colour Size Edible
Green Small No
Red Small Yes
Green Small No
Green Small No
Green Large Yes
Red Small No
Green Large No
Green Large Yes
Red Small No
Red Small No
25
The goal of the decision tree is to reduce the ambiguity of which class a customer would belong to if one was chosen at random. (Shannon, 1948) states that in the above scenario, if five fruits were edible and five were not, then there is the maximum degree of uncertainty in the dataset. This uncertainty is denoted by the symbol H and is called Entropy (Shannon, 1948), which is measured in bits. The formula for entropy is as follows:
𝐻 = − ∑ 𝑝𝑖 𝑙𝑜𝑔𝑖 𝑝𝑖
𝑖
After the splitting of the dataset, the decrease in the degree of uncertainty is known as the Information Gain, denoted as IG (Quinlan, 1986). The formula for Information Gain is as follows:
𝐼𝐺 = 𝐸𝑛𝑡𝑟𝑜𝑝𝑦 𝑏𝑒𝑓𝑜𝑟𝑒 𝑠𝑝𝑙𝑖𝑡 − 𝐸𝑛𝑡𝑟𝑜𝑝𝑦 𝑎𝑓𝑡𝑒𝑟 𝑠𝑝𝑙𝑖𝑡
To allow for the creation of a new leaf node, the dataset is split using the available features. Looking back at table 2.2, if the attribute “Size” is used to split the data it will create two leaf nodes, one for small fruit and one for large. In the “small” node, there will be only be one edible fruit out of six, while in the “large” node, two out of the three fruits will be edible. Therefore if a fruit was chosen at random from the “large” node, there would be a 66% chance it would be an edible fruit, while there would only be an approx. 15% chance of randomly picking an edible fruit from the “small” node. For the “large” node, the degree of uncertainty of choosing an edible fruit has gone from 30% in the root node to 33%, an increase of 3%. Conversely, if you look at the “small” node, you have an approx. 15% chance picking an edible fruit at random.
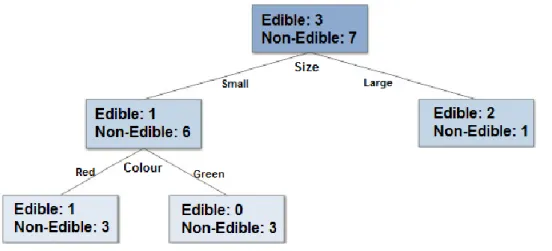
Using table 2.2, the entropy of the “Edible” attribute is 0.881 bits with the entropy of “Size=small” being 0.592 bits and “Size=large” being 0.918 bits, and therefore the entropy of the “Size” attribute is 0.690 bits. Consequently, the entropy has gone from 0.881 bits to 0.690 bits. Therefore, the Information Gain for the “Size” attribute is 0.191 bits (0.881-0.690). This process is then repeated for the remaining attribute, “Colour”. If there is an Information Gain, new leaf nodes can be created. The outcome of this decision tree can be seen in figure 2.8.
26
Figure 2.8 - Visualisation of decision tree created for example
A well-documented potential issue with decision tree is where by two records in the dataset have the same attributes but different classes (Quinlan, 1986). If this issue occurs the decision tree will not be able to confidently determine which class the record should belong to. Consequently the decision tree will assign the class of the majority class within that group (Kohavi , Yun , & Friedman , 1996). If the situation persists and there is still a tie between the classes, then the class is decided based on the majority class of the parent note from which the subgroup was formed.
Figure 2.9 - Basic decision tree (Quinlan, 1986)
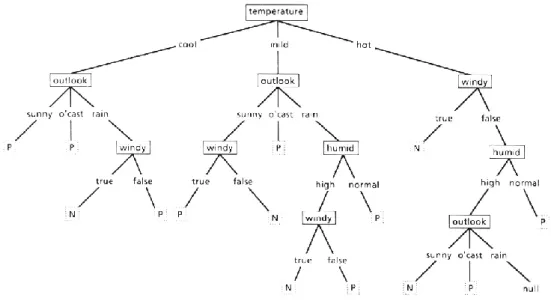
Due to how decision trees are built, once there is sufficient information in the underlying data to make a split, the tree will continue to grow. As can be seen in figure 2.9 and 2.10, both of these trees correctly classify a training dataset into ‘P’ and ‘N’. In this scenario, (Quinlan, 1986) suggests that the simpler of the trees, figure 2.9, should be chosen. There are two main reasons for this, firstly performance and secondly over-fitting (Ho, 1995). The second tree in figure 2.10 is much larger and will therefore require far more
27
computational power to build compared to the smaller in figure 2.9. Due to the complexity of the second tree, it is potentially liable to over-fitting to the training data. Consequently while both trees correctly classify the training data, the more complex tree may struggle to correct classify unseen records.
Figure 2.10 - Complex decision tree (Quinlan, 1986)
As mentioned earlier, Information Gain can be a method used to determine the best splitting location during the construction of a tree. However a distinct disadvantage of Information Gain in the potential for it to lead to over-fitting. As Information Gain has a preference of creating small splits in the data, it can have detrimental impacts when an attribute such as a unique id is introduced. With this field, the algorithm would correctly split the data on each of the unique ids’ and create tree with a size of 1 and an entropy of 0. However this tree could not be deployed as it would not have the ability to classify previously unseen unique id’s presented to it. To mitigate this issue, (Quinlan, 1986) suggests to use the measure of Gain Ratio which is the Information Gain divided by the Entropy after the Split. (Quinlan, 1986) found the utilising Gain Ratio as the splitting method often produced more favourable results over Information Gain. For the above example of unique id’s, if Gain Ratio was used the entropy after the split would be 0 and consequently the Gain Ratio would be 0. Therefore other attributes in the dataset would return better Gain Ratio’s and would be chosen as the splitting attribute over the unique id attribute.
As well as Gain Ratio, another measure which could be used to alleviate Information Gain predilection for attributes with many values is Symmetric uncertainty. This
28
measure functions by normalising the data to a range of 0 to 1 and is not influenced by attributes with multiple values (Liu & Yu, 2003). In addition to all of the measures already mentioned, another measure which could be used is Gini Index. Gini Index measures the impurity of a node and is a measure of how often a randomly chosen record from a dataset would be incorrectly classified if it was randomly classified according to the distribution of classes in the dataset. In addition to being used to build decision trees, the above measures of Information Gain, Gain Ratio, Symmetric uncertainty and Gini-Index can also be used during the feature selection process.
For simpler predictive models, decision tress are generally good models as they are easy to explain and interpret. However as the complexity grows, the effectiveness of a singular decision tree begins to weaken in both accuracy and effectiveness (Kohavi , Yun , & Friedman , 1996). As discussed by (Kohavi , Yun , & Friedman , 1996), decision trees can be susceptible to various issues and therefore this leads to them rarely being used for mortgage arrears prediction. One of these crucial issues is due to how decisions trees are built. As they are constructed with a top down approach, they can only ever look one step ahead. Consequently the algorithm may not chose the optimal split for the node as each attributed is treated independently to the rest of the attributes. For larger datasets with multiple attributes, it would not be uncommon for one attribute to have little correlation to the target attribute, while a combination of attributes may be a strong predictor. Therefore, using multiple decision tress should perform better than a singular tree. This is where the concept of random forests come from which are discussed in detail in the following section.
2.5.2 Random forests
First proposed by Tin Kim Ho at AT&T Bell Labs (Ho, 1995) and later refined by Leo Breiman and Adele Cutler in 2001 (Breiman & Cutler, 2001), Random Forests (RF) are an ensemble learning method for classification. RF are popular and accurate algorithms and are therefore commonly used as the default classification models in many applications (Zhang, Liu, Zhang, & Almpanidis, 2017). They were originally suggested and developed to alleviate the potential issue of single decision tree’s habit of over-fitting their training data and not generalising well to unseen data.
RF operate by constructing a mass of random un-pruned tress and using the mode of the output of all of the tress as the output of the algorithm (Ali, Khan, Ahmad, & Maqsood,
29
2012). Trees in Random Forests are constructed using the following method (Breiman & Cutler, 2001):
1. We first need to determine which sample data will be used to build the tress in the forest. For this, if we say that N is the number of cases in the training dataset, we sample N cases at random, but with replacement from the original dataset. This will be the sample which will be used as the training dataset for growing the tree.
2. If there are M input attributes, a number of m<<M is defined such that at each node, m attributes are selected at random from M and the best split from these is used to split that node. During the growth of the forest, the value of m is held constant.
3. Each tree is grown to the largest possible extent. No trees are pruned during the process.
Two effects which can impact the error rate of RF are correlation between two trees and the strength of the individual tress of the forest. These effects can be alleviated to improve the error rate by adjusting the m value during the construction of the individual trees (Breiman & Cutler, 2001).
In 2012, (Ali, Khan, Ahmad, & Maqsood, 2012) performed a comprehensive analysis comparing Random Forests to singular decision tress on breast cancer data and concluded that “Random Forest achieves increased classification performance and yields results that are accurate and precise in the cases of large number of instances”
(Ali, Khan, Ahmad, & Maqsood, 2012). They also discussed random forests ability to handle missing values and their unlikeliness to develop over-fitting problems due to the missing values. In their comparison of state-of-the-art classification algorithms, (Zhang, Liu, Zhang, & Almpanidis, 2017) concluded that random forests proved to be the joint highest performing classifier (along with Gradient Boosting Decision Trees), closely followed by support vector machines, which will be discussed later in subsection 2.5.5. In addition to this, (Pal, 2005) validated the effectiveness of random forests when he compared them to support vector machines and concluded the performance of both was comparable. As the problem we are attempting to determine with this paper is whether someone will enter arrears on their mortgage which is a binary classification, random forests would be a suitable classifier to employ. (Barboza, Kimura, & Altman, 2017)
30
further confirmed the power of RF when the concluded RF was the highest preforming model for bankruptcy prediction, achieving better results than neural networks and support vector machines, which can be seen in table 2.3.
Table 2.3 - Model performance from (Barboza, Kimura, & Altman, 2017)
2.5.3 Regression
Regression is used to model linear relationships between attributes in a dataset. In its most basic form, a linear regression model can be thought of as an attempt to predict the change of one dependant variable based on the change of another independent variable. The potential models which can be built in this scenario can be represented as Y=F(x)
where Y is the dependant variable we are attempting to predict by applying some function to the independent variable x. A simple example of this model can be seen in figure 2.11 where a person’s salary increases as their number of years of experience increases. This model can be represented as Y = x, where as a person’s years of experience increases, their salary also increases.
Figure 2.11 - Simple regression line example
Obviously, this is the simplest form of regression and the majority of real world scenarios are not as easy to understand and visualise. The majority of real world