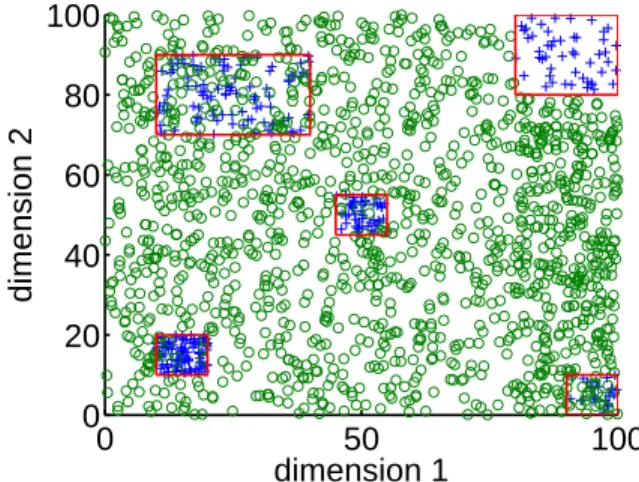
Box drawings for learning with imbalanced data
Full text
Figure


Related documents
This multi-layer approach has been justified by showing that with enough hidden units and correct initialization, increasing the number of layers improves the lower bound of the
If breastfeeding by itself doesn’t effectively remove the thickened inspissated milk, then manual expression of the milk, or the use of an efficient breast pump after feeds will
At univariable analysis by Anderson and Darling test, MDADI-CS and the subscales were not significantly associated with age, T and N stage, previous
Although the probability of a beyond design base accident at nuclear power plant is very very low (~ 1 event in 1 million reactor year operations), BARC has developed an Indian
All of the participants were faculty members, currently working in a higher education setting, teaching adapted physical activity / education courses and, finally, were
* This paper is presented to the 2nd KRIS-Brookings Joint Conference on "Security and Diplomatic Cooperation between ROK and US for the Unification of the
An analysis of the economic contribution of the software industry examined the effect of software activity on the Lebanese economy by measuring it in terms of output and value
Step 3: Create Customer Satisfaction or Modify Customer Satisfaction Complete all necessary fields, and click the Save to return to the Customer. Satisfaction page, or click
