Air quality public policies and their implications
for densely populated urban areas in Brazil
Políticas públicas de qualidade do ar no Brasil e seus
reflexos nas áreas urbanas densamente habitadas
José Carlos de Moura Xavier
aWilson Cabral de Sousa Júnior
bMaria Paulete Pereira Martins
c aDoutorando do Programa de Pós-Graduação em Engenharia de Infraestrutura Aeronáutica,Instituto Tecnológico de Aeronáutica – ITA, São José dos Campos, SP, Brasil End. Eletrônico: josecx@uol.com.br bProfessor Associado da Divisão de Engenharia Civil, Instituto Tecnológico de Aeronáutica – ITA, São José dos Campos, SP, Brasil
End. Eletrônico: wilson@ita.br cPesquisadora do Instituto Nacional de Pesquisas Espaciais – Inpe, São José dos Campos, SP, Brasil End. Eletrônico: maria.paulete@inpe.br
doi:10.18472/SustDeb.v8n1.2017.18846
Recebido em 23.05.2016
Aceito em 08.03.2017
ARTIGO - VARIA
ABSTRACT
Due to the current growth of the Brazilian population income and energy consumption and an increase in the population density in urban areas, air quality in the crowded Brazilian cities is being questioned. In searching for a solution we analyzed both the Brazilian and Regional (São Paulo state) public policies of air quality that have been issued since 1981 by confronting them to the air quality official indexes. Following the growth of the national vehicle fleet, 48.8 million in 2012 from 9.3 million in 1980, the total carbon dioxide emissions tripled. At regional level, PM2.5 measurements have been carried out systematically since 1999 in the Metropolitan Region of São Paulo city, the largest Brazilian city, with 19.7 million inhabitants, and more than 7 million vehicles powered mainly by fossil fuels. Although the numbers are still above the state standard to be reached (10µg.m-3), there was a decrease on the annual
average in 2008-2015 compared with 2001-2007. This was partially due to the limits established for new vehicles by federal programs. The analysis indicated that the reduction of air pollutants emission will be more easily achieved based on strategies that combine policies supported by current laws, government and private sector agreements and the community engagement.
RESUMO
Em um cenário de crescimento da renda da população brasileira, de aumento no consumo de energia e de adensamento das áreas urbanas, questiona-se sobre a qualidade do ar nas maiores cidades brasileiras. Na busca por resposta, este trabalho analisou as políticas públicas nacionais e regional (estado de São Paulo) afetas à qualidade do ar implantadas a partir de 1981 e as contrapôs aos indicadores oficiais dessa qualidade. As emissões totais de dióxido de carbono triplicaram entre 1980 e 2012, seguindo o crescimento da frota veicular nacional que passou de 9,3 milhões para 48,8 milhões, respectivamente. No âmbito regional, MP2.5 é monitorado sistematicamente desde 1999 na Região Metropolitana de São Paulo (a maior cidade brasileira), com 19,7 milhões de habitantes e mais de 7 milhões de veículos predominantemente movidos a combustíveis de origem fóssil. Observou-se diminuição da média anual do período 2008-2015 em relação ao período 2001-2007, embora essa média ainda esteja acima do padrão estadual a ser alcançado (10µg.m-3). Essa diminuição se deve em parte aos limites de emissão
estabelecidos para veículos novos pelos programas federais. A análise indicou que estratégias que envolvem a aplicação de normativas legais, notadamente aquelas apoiadas pelas políticas já existentes, por acordos que envolvam governo e iniciativa privada e pela participação da sociedade têm chance maior de levar à redução da emissão de poluentes atmosféricos.
Palavras-chave: Qualidade do Ar. Emissões Veiculares. Poluente Atmosférico. Política Pública. Cidades Brasileiras.
1 INTRODUCTION
Despite the current economic recession, the growth of the Brazilian population income in two last decades can be verified by the Gross Domestic Product (GDP) and Gross Domestic Product per capita (GDPpc) indicators, with average annual rates ranging from 1.9% (GDPpc) to 4.1% (GDP) from 1995 to 2012 (IBGE, 2008; IBGE, 2015).
This trend is accompanied by the energy consumption in the country, which increased at a rate of 3.5% per year between 2002 and 2013, reaching 243.9 million toe (tons oil equivalent) in 2013. Non-renewable sources like oil, natural gas and coal (about 48%), and Non-renewable agricultural sources such as sugar cane bagasse, wood and ethanol (25%), account for energy consumed (EPE, 2014).
The industrial and road transport segments in 2013 consumed approximately 36% and 32% of energy consumption, respectively (EPE, 2014). These sources generate air emissions of substances whose effects are harmful to the environment and in particular to human health (COHEN et al., 2005). Besides the income growth and energy consumption, the migration of rural people to the cities was intensified in 1960s and 1970s, reaching 84% in 2010 (IBGE, 2011).
Based on the context presented above, the air quality in Brazil has been questioned. Searching for possible answers, this article presents some Brazilian public policies related to air quality since 1981, when the National Environmental Policy ─ PNMA was established (BRAZIL, 1981). These air quality policies were analized altogether with income (GDP and GDPpc) indicators, vehicular fleet growning indicators and its atmospheric emission indicators.
Since Brazilian population lives in urban areas, the research was restricted to these areas. It was also restricted to vehicular emissions, as they are main atmospheric pollution source in urban areas (CETESB, 2016; OLMO et al., 2011).
We also discuss regional policies in São Paulo state, particularly in the metropolitan region of São Paulo city ─ the state capital ─ where 19.7 million people live. The reason is its high industrialization and the largest fleet of vehicles, with important effects on air quality (CETESB, 2016).
Next section presents the method adopted in this research. Section 3 presents the results. The main air quality policies, fine particulate matter (PM2.5) indicator trend and carbon dioxide (CO2) emission trend are highlighted. These results are discussed in section 4 with suggestions of measures to promote air quality improvement in urban areas.
2 METHOD
Air quality public policies were selected from Ministry of Environment ─ MMA website. Their original texts were downloaded from official legislation websites (Diário Oficial da União and Diário Oficial do Estado de São Paulo). The application of these policies was identified in MMA website.
Population growth around urban areas and their income came from different reports available in the Brazilian bureau of statistics (Instituto Brasileiro de Geografia e Estatística ─ IBGE) website.
The Brazilian vehicle fleet figures came from the national inventory of atmospheric emissions for road motor vehicles, available in the MMA website.
Carbon dioxide emission figures came from the national inventory of atmospheric emissions for road motor vehicles, available in the MMA website. Fine particulate matter indicator for the Metropolitan Region of São Paulo ─ MRSP were retrived from São Paulo State Environmental Company ─ Cetesb website.
3 RESULTS
That section presents (i) the main air quality public policies since decade of 1980s, (ii) the Brazilian population migration to urban areas and its income evolution, (iii) the Brazilian vehicle fleet trend and (iv) the estimate of CO2 emissions for this fleet and PM2.5 figures in São Paulo state.
3.1 PUBLIC POLICIES
The Federal law 6938 launched in 1981 established the PNMA, in order to preserve, enhance and restore the Brazilian environmental quality. The law has created, among others, the National Environment Council ─ Conama, a collegiate body comprising by representatives of ministries and federal agencies, state and local environmental agencies, professional associations and non-governmental organizations. Conama has consultative and deliberative roles and can deliberate on norms and standards (BRAZIL, 1981), as can be seen in the next subsection.
Some air quality policies emerged from PNMA (see subsections 3.1.1 or 3.1.2). Some others not (see subsection 3.1.3). They are shown below and organized according to their predominant focus on (i) air quality standards, (ii) control of sources and (iii) consumption strategies of fossil fuels.
3.1.1 POlICIES INVOlVING AIR QuAlITy STANDARDS
In 1989, Conama proposed the National Program for Air Quality Control ─ Pronar which aimed to harmonize economic and social development, and air quality improvement. The strategy for its implementation was based, among others, on the establishment of air quality standards (BRAZIL, 2013b), that have been in effect since 1990 by Conama Resolution no 03/90 (BRAZIL, 1990).
Since 2004 in São Paulo, the most industrialized Brazilian state, with about 20% of national population, a state law established criteria for the management of air quality based on the nonattainment level concept by air pollutants (SÃO PAULO, 2004). The qualification of a region (one or more municipalities) as ‘nonattainment area’, ‘close to nonattainment area’, or ‘attainment area’ for the pollutants established by Conama Resolution no 03/90 was made based on monitoring conducted by the São Paulo State Environmental Company ─ Cetesb (CETESB, 2013). In 2013, the Decree no 59113 (SÃO PAULO, 2013)
revised this form of administration, including more stringent air quality standards and new pollutants not covered in the national legislation, turning these standards close to the guide values recommended by the World Health Organization ─ WHO in 2005 (WHO, 2005).
The strategy to achieve this new level of air quality combines emission control measures for stationary and mobile sources by region of interest, restricts the settlement of new stationary sources in critical regions, scales the new standards by intermediate goals (IG), until the final standard (FS) proposed is reached, and also credits for the reduction of emissions. Table 1 illustrates the limits proposed by WHO, those in force in Brazil and in the state of São Paulo for particulate matter (PM10) and PM2.5.
Table 1 ─ Air quality standards in Brazil (CONAMA Resolution no 03/90), in São Paulo state (Decree no 59113/2013), and the guide values recommended by WHO
1 sampling for 24h consecutive. It should not be exceeded more than once a year 2 annual arithmetic average
3 sampling for 24h consecutive (99th percentile)
Source: Prepared by the authors from SÃO PAulO, 2013; CETESB, 2013, tab. 2 and annex 1, tab. B
The IG1 goal is valid from April 2013, and the deadlines for the IG2, IG3 and FS goals will be established by the São Paulo State Environment Council ─ Consema after an evaluation of the previous target.
3.1.2 POlICIES REGARDING MOBIlE SOuRCES CONTROl
Due to the advances of the Brazilian economy from the 1980s, it became necessary to lay down stricter rules for vehicle emissions. The Program for the Control of Air Pollution by Motor Vehicles ─ Proconve, created in 1986, and the Program for the Control of Air Pollution by Motorcycles and Similar Vehicles ─ Promot, created in 2002, are both aligned to limit new light vehicle emissions (cars and motorcycles) and heavy ones (trucks and buses), with a strategy of combining new vehicle technologies and better fuel quality.
Proconve was divided into phases set in intervals of about four years. The limits of current phases for light vehicles (L-6 phase), since January 2013, and for heavy vehicles (P-7 phase), since January 2012, along with the limits of the previous phases are in Brazil (2013a).
In 1986, light vehicles (cars) emitted approximately 50g/km of carbon monoxide (CO). During the current phase (L-6) the reduction was 97%. Heavy vehicles have reduced emissions by 80%, due to the introduction of catalyst and electronic fuel injection, and the improvement in the quality of the fuel, such as diesel oil with an approximate content of 10 ppm sulfur for the current phase P7, in effect until 2016 (BRAZIL, 2013a).
Promot has established emission limits for mopeds, motorcycles and equivalent vehicles. The limits of current phase (M-4), since January 2014 and January 2016, along with the limits of the previous phases are in Brazil (2002), Brazil (2011), and Brazil (2013d).
According to Brazil (2013c), in 2000 a new motorcycle with 150 cc engine or less emitted 16 times more pollutants than the vehicles sold nowadays (12g/km against 0.73g/km). In 2006 this figure dropped to 2.3g/km on mopeds against 0.33g/km on cars. With the implementation of the program there was a reduction of emissions by about 80% for CO and 70% for hydrocarbons and since 2009 the gas emission limits for motorcycles and cars are quite similar.
The Vehicular Pollution Control Plan ─ PCPV was established by a Conama resolution in 2009. It proposes actions in order to keep vehicular fleet emissions close to original project based on enforcement, preventive maintenance and appropriate management. Diverse actions in the transport area for pollutant and greenhouse gas emission reduction are recommended, as well as the reduction of fossil fuels use and energy efficiency improvement (BRAZIL, 2009a). Based on 2013 MMA evaluation, 23 Brazilian states have finished their PCPVs, where 97,4% of Brazilian vehicular fleet is presented (BRAZIL, 2013g).
3.1.3 POlICIES RElATED TO CONSuMPTION STRATEGIES Of fOSSIl fuElS
Related to the energy efficiency and the reduction of emissions of air pollutants, the Brazilian Labeling Program (Vehicles) ─ PBEV, created in 2008, aims to qualify and classify vehicles according to the consumed energy. The classification is relative between cars of the same category and the result is expressed through a vehicle label, which indicates the contents from A to E for the most efficient to the least efficient fuel consumption, respectively (BRAZIL, 2013e). Information is also provided on the number of kilometers traveled per liter with different fuels on the highways and in the city (BRAZIL, 2013f).
This initiative, already found in the United States of America (US), Japan, Australia, China, Canada and European Union (EU) members, is voluntary in Brazil where it is renewed annually by manufacturers and importers. In 2013 (fourth phase), there were eight automakers, 157 versions of 105 models, which account for 55% of sales volume in the domestic market (BRAZIL, 2013e).
The conception and implantation of the previous policies have been managed by MMA. As an innovative form, the National Air Quality Plan ─ PNQA, issued in 2009, commits MMA, the Health Ministry and the Cities Ministry to establish policies that protect environment and human health. The strategic objectives of PNQA shown in Brazil (2009b) are: (i) to reduce atmospheric contaminant concentrations, (ii) to integrate public policies in land-use planning actions and (iii) to contribute with greenhouse gas emission reduction. Recent search on websites of these Ministries did not find data or evolution comments about PNQA.
3.2 POPULATION GROWTH AROUND URBAN AREAS AND INCOME
The Brazilian population exceeded 190 million in 2010, almost four times more than in 1950, the beginning of an intense economic activity period, when car companies and oil industries have settled in the country. With the intensification of rural exodus in the 1960s and 1970s, currently approximately 161 million people (84%) live in urban areas (IBGE, 2011).
The population growth between 1950 and 2010 changed among 5 and 24 times, exceeding the country’s average in 22 out 26 Brazilian capitals. Similar performance was observed for the 18 municipalities (which are not capitals) with more than 500,000 inhabitants in the 2010 census (IBGE, 2013).
In the 38 cities with more than 500,000 inhabitants, live 29.3% of the Brazilian population (55.8 million). This area accounts for less than 1% (54.3 km2) of the national territory (IBGE, 2013).
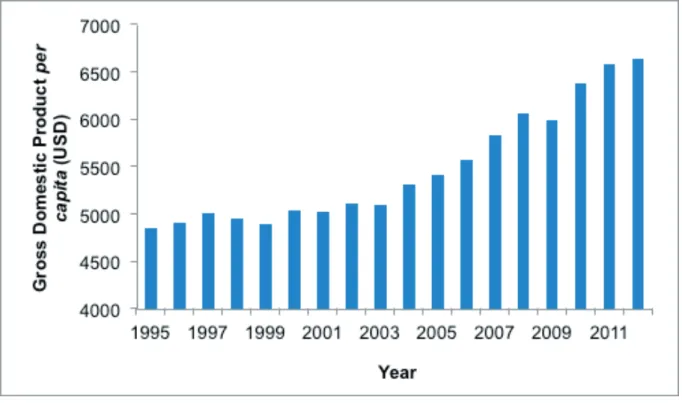
The income of this population also increased, evidenced by the growth of GDP between 1995 and 2012 with an average rate of 3.1% per year, and 4.1% from 2003 (IBGE, 2015). In 2012, municipalities with more than 500,000 inhabitants, account for 40.8% of Brazilian GDP (IBGE, 2014).
The GDPpc increased from about US$4,800 in 1995 to US$6,600 in 2012 (Figure 1) with an average rate of 1.9% per year for the entire period, and 3.0% from 2003 to 2012.
Figure 1 ─ Brazilian GDPpc from 1995 to 2012
Source: Prepared by the authors from IBGE, 2008; IBGE, 2015 Note: values at 1995 prices
3.3 THE BRAZILIAN VEHICLE FLEET TREND
Following the population and the income increasing figures, there was a vigorous growth in the vehicle fleet. This can be observed in Figure 2 for vehicles with Otto cycle engines (cars, motorcycles and light commercial) and Diesel cycle (light commercial vehicles, trucks and buses), with an increased rate from the first half of the last decade (BRAZIL, 2014, Annex D).
Figure 2 ─ Estimated Brazilian fleet of vehicles from 1980 to 2012.
Source: Prepared by the authors from BRAZIL, 2014, Annex D
3.4 AIR QUALITY INDICATORS
In 2014, the MMA presented the national inventory of atmospheric emissions for road motor vehicles for the period 1980 to 2012. The inventory shows the reduction in absolute emissions, such as particulate matter (PM), carbon monoxide (CO), nitrogen oxides (NOx), non-methane hydrocarbons (NMHC) and aldehydes (RCHO) and attributed this reduction to Proconve and Promot programs.
Regarding the CO2 emissions, the inventory indicates emission rate reductions for Otto and Diesel cycles vehicles, notably from 1996, as noticed in Figure 3. Notwithstanding, the inventory also shows the increase in CO2 absolute emissions (Figure 4), which tripled between 1980 and 2012 (BRAZIL, 2014).
Figure 3 ─ CO2 emissions related to the Otto and Diesel cycles vehicle fleet
Figure 4 ─ Absolute CO2 emissions for Otto and Diesel cycles vehicles.
Source: Prepared by the authors from BRAZIL, 2014, annex H, tables 54, 55 and 56.
In the Metropolitan Region of São Paulo ─ MRSP, where 6.2 million light vehicles, 895,000 motorcycles and 240,000 buses an trucks circulate (CETESB, 2016), the measurements of PM2.5, that have been carried out systematically by Cetesb since 1999 (Figure 5), show annual averages above 10μg.m-3, which
is the annual guide value established by WHO and final standard desired in São Paulo (see Table 1).
Figure 5 ─ Annual average concentrations of PM2.5 in the MRSP stations.
Source: prepared by the authors from Cetesb, 2004; Cetesb, 2009; Cetesb, 2016.
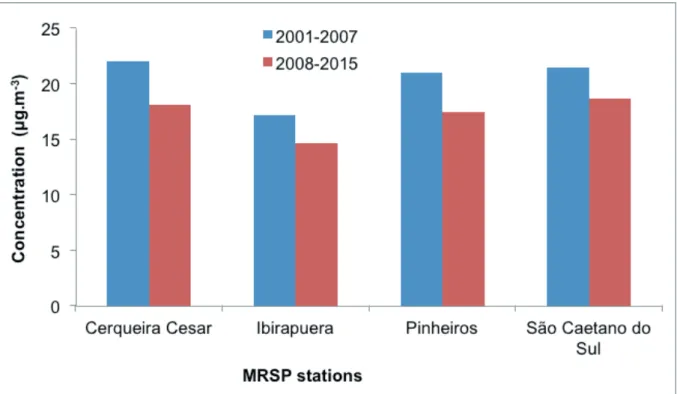
reduction in the second one is evident (Figure 6), despite the oscillations identified in Figure 5.
Figure 6 ─ PM2.5 average concentrations in the MRSP stations for 2001-2007 and 2008-2015 periods.
Source: prepared by the authors from Cetesb, 2004; Cetesb, 2009; Cetesb, 2016.
4 DISCUSSION
The previous section presented the main air quality policies and programs implemented since the 1980s in Brazil and São Paulo and the strategies to achieve a better air quality. These policies were put into a timeline (Figure 7) in which we can see the programs begun in the 1980s, followed by an accommodation decade (1990s) and the new policies in the 2000s. From 2004 there are some agreements involving the government and private sector, such as PBEV, with a national character, and more stringent actions, as observed in São Paulo, initially with the establishment of nonattainment areas by air pollutants, and later with the establishment of more stringent standards and new pollutants not covered in the federal legislation then in force.
Although the reason for the increase of the policies frequency since the 2000s can be investigated in more detail, the population growth and income are supposed to have some correlation with the air emissions increase, and consequently with these new policies.
Figure 7 ─ Chronology of public policies related to air quality nationwide and in São Paulo state.
The Figure 8 shows the national ratio inhabitants/vehicle for the Otto cycle vehicle fleet, which includes motorcycles, changed from 14 to 4.3 in only three decades, as noticed in series 2, whilst the participation of motorcycles increased from 3.3 % to 29.2%. The series 1, which represents the national per capita fleet growth, shows three distinct, increasing inclinations. From 2003, it follows the GDPpc growth rate presented in Figure 1.
Figure 8 ─ National ratio of population and number of Otto cycle vehicles.
Source: Prepared by the authors from IBGE, 2008; BRAZIL, 2014, annex D.
Similar per capta fleet and GDPpc growth trends along with the population growth around Brazilian state capitals and some municipalities (where 56 million inhabitants live in 54.3km2, or less than 1% of
the territory) have contributed to the air quality to become a huge problem with several externalities, most of them related with the population health associated with CO2 and other air pollutants.
The glance over CO2 derives of its feature as the main greenhouse gas (refer). Although the Figure 3 indicate emission rate reductions, the absolute CO2 emissions grew from 1980 to 2012 (Figure 4) indicating that the vehicle fleet emissions increased at higher rate than the reductions achieved by
Proconve and Promot programs. In fact, the reduction of the pollutant load due to new emission limits and fleet renewal (CETESB, 2013, p. 14), tends to be balanced by the significant increase in the fleet, and by the intensive use of vehicles for individual transport in recent years.
Among atmospheric pollutants, the fine particulate matter (PM2.5) has been of interest. The main reason is because this fraction is more likely to reach the deepest regions of the respiratory tract (OSTRO, 2004, p. 2).
The initiative of the state of São Paulo in restricting air quality standards and including PM2.5 in the set of monitored parameters aligns with the majority of the scientific literature pointing harmful effects on human health due to air pollution, even when the statutory quality standards are not achieved. There seems to be enough evidence that in situations of increased concentrations of PM2.5, as observed in the Amazon region due to biomass burning, there is an increase in hospitalization of children and the elderly with respiratory diseases (IGNOTTI et al., 2007, 2010a 2010b; MASCARENHAS et al., 2008; SILVA et al., 2010).
Yet, in urban areas, PM2.5 concentrations show less oscillation compared to those in the Amazon region and PM2.5 comes predominantly from mobile sources such as cars, trucks and buses. Oliveira
et al. (2011) reviewed 54 scientific articles published in Brazil between 2000 and 2009 and found no
strong evidence of adverse health effects and concentrations of particulate matter. Despite that, they indicated the need of government and private sector to discuss the current standards and establish limits for PM2.5. In contrast, Olmo et al. (2011), who reviewed 113 national and international scientific studies conducted between 1995 and 2009, say there is strong evidence supporting the association between air pollution from vehicles and adverse effects on human health, without nominating the pollutants. The authors also investigated the relationship between science, public policy and change in emission standards and show that about 17% of the revised articles mention the public policy and suggest an interface between science and policies makers in order to protect human health.
The apparent dissimilarity between the two studies points to the need of establishing quantitative benchmarks to replace terms as strong evidence, of qualitative character. It is also recommended to increase the regulated parameters monitoring, such as PM2.5 or others of interest, such as volatile organic compounds, increasing the temporal and spatial database, in order to minimize uncertainties arising from the small number of data.
In São Paulo, the reduction in the measurements obtained by four air quality stations, as shown in Figure 6, fit estimates presented in BRAZIL (2014), which has indicated a decrease in particulate matter (PM) emissions by motor vehicles, especially trucks and buses (diesel cycle engines), achieved due to the limits established for new vehicles by Proconve for its P-6 and P-7 phases.
As previously mentioned, PM2.5 is not a parameter required by national legislation, so that the vast majority of Brazilian states do not monitor this parameter. In São Paulo, although the monitoring has been taken place since 1999, it was restricted to a small number of stations in the MRSP up to 2012. With the advent of legislation in 2013, imposing new quality standards, the monitoring of PM2.5 is expanding in the MRSP, in the county and on the coast (CETESB, 2016). It will help to reduce the uncertainty in evaluating the air quality and its effects in human health as a result of an increase in the spatial and temporal coverage of the measurements.
The concentrations of population and the income are driving forces of urban air pollution in developed countries. In United States of America and European Union, pollution and health indicators have been considered in air quality policies. As the technology improves, the emission limits have been reduced, aiming for air quality levels that no longer adversely affect or threaten human health and the natural environment. PM2.5 and NOx (ozone precursors) are among the pollutants under constant attention. Consequently, monitoring and vehicle emission standards successively more restrictive are part of the strategy to reach better air quality (KUKLINSKA et al., 2015).
Developing countries also faced challenges in air quality management, notably in great urban areas. Urban air quality management plans applied in China, India and South Africa contain well known tools as emission standards, monitoring network, source apportionment, air quality modeling, assessment of human health impacted by air pollution, public participation based on communication, and emissions inventory (GULIA et al., 2015).
Although we can observe a reduction in PM, CO, NOx, and NMHC emissions from the fleet of light and heavy vehicles, the significant increase in the fleet leads to an increase in CO2 emissions, predominantly in urban areas. That component of rebound effect (BERKHOUT et al., 2000; SMALL; VAN DENDER, 2005) reflects the results of policies with conflicting effects: on the one hand, those which aim to reduce emissions, mainly establishing technological standards; and on the other hand, those which drive towards economic growth based on consumption, bringing a sort of new vehicles to the cities.
5 CONCLUSIONS
This research proposed to collate the main Brazilian air quality policies against pollution air emission indicators in order to analyze their effectiveness.
The increases of the income and vehicle fleet in Brazil have similar trends, with acceleration from the mid-2000s. Together with the concentration of population around urban areas, these results suggest that the increase in the number of policies for air quality since 2004 aimed to delay the growth of atmospheric emissions of vehicular origin around these areas.
Despite these policies, the absolute carbon dioxide emissions have tripled between 1980 and 2012 and the annual average concentrations of PM2.5 in the MRSP are above the guide values recommended by WHO.
The spatial extension of monitoring PM2.5 and other parameters already legislated can contribute to the discussion on the health effects of air pollutants. It is desirable that Conama review the existing national quality standards, dating back to 1990, and encourage the increase of networks of national and regional Brazilian monitoring.
Strategies that depend on the application of legal regulations, particularly those supported by existing policies, by agreements involving the government and private sector and the participation of society, are more likely to lead to a reduction in the emission of air pollutants in the coming years.
Additionally, strategies for citizen participation, such as PBEV can contribute to reducing vehicle emissions from knowledge (of fuel consumption) and power of choice (the options offered by the market), making the consumer a protagonist in improving air quality.
NOTE
1 Acronyms of Brazilian programs, councils and others are in original [Portuguese] form.
REFERENCES
BERKHOUT, P. H. G.; MUSKENS, J. C.; VELTHUIJSEN, J. W. Defining the rebound effect. Energy Policy, v. 28, p. 425-432, 2000.
BRAZIL. Política Nacional do Meio Ambiente. Federal Law n. 6938, of 31.08.1981. Brasília, 1981.
______. Ministério do Meio Ambiente. Conselho Nacional do Meio Ambiente. Resolution n. 03, of 28.06.1990. Brasília, 1990.
______. Ministério do Meio Ambiente. Conselho Nacional do Meio Ambiente. Resolution n. 297, of 26.02.2002. Brasília, 2002.
______. Ministério do Meio Ambiente. Conselho Nacional do Meio Ambiente. Resolution n. 418, of 25.11.2009. Brasília, 2009a.
______. Ministério do Meio Ambiente. Compromisso pela qualidade do ar e saúde ambiental. Brasília, 2009b. Available in: <http://www.mma.gov.br/images/arquivo/80060/Compromisso%20pela%20Qualidade%20do%20 Ar%20e%20Saude%20Ambiental.pdf>. Accessed 27 Feb 2017 (in portuguese).
______. Ministério do Meio Ambiente. Conselho Nacional do Meio Ambiente. Resolution n. 432, of 14.07.2011. Brasília, 2011.
______. Ministério do Meio Ambiente. Programa de Controle de Poluição do Ar por Veículos Automotores - Proconve. Brasília, 2013a. Available in: <http://www.mma.gov.br/estruturas/163/_arquivos/proconve_163.pdf>. Accessed 05 March 2017 (in portuguese).
______. Ministério do Meio Ambiente. Programa Nacional de Controle de Qualidade do Ar - Pronar. Brasília, 2013b. Available in: <http://www.mma.gov.br/estruturas/163/_arquivos/pronar_163.pdf>. Accessed 05 March 2017 (in portuguese).
______. Ministério do Meio Ambiente. Programa de Controle da Poluição do Ar por Motociclos e Veículos Similares - Promot. Brasília, 2013c. Available in: <http://www.mma.gov.br/estruturas/163/_arquivos/ promot_163.pdf>. Accessed 05 March 2017 (in portuguese).
______. Ministério do Meio Ambiente. Conselho Nacional do Meio Ambiente. Resolution n. 456, of 29.04.2013. Brasília, 2013d.
______. Inmetro. Programa Brasileiro de Etiquetagem. Brasília, 2013e. Available in: <http://www2.inmetro.gov. br/pbe/novidades_detalhe.php?i=Mw==>. Accessed 05 March 2017 (in portuguese).
______. Programa Brasileiro de Etiquetagem. Brasília, 2013f. Available in: <http://pbeveicular.petrobras.com.br/ TabelaConsumo.aspx>. Accessed 05 March 2017 (in portuguese).
______. Plano de Controle de Poluição Veicular – Diagnóstico e Acompanhamento. Brasília, 2013g. Available
in: <file:///C:/Documents%20and%20Settings/Jos%C3%A9%20Carlos/Meus%20documentos/Downloads/
RUDOLF%20-APRESENTAR%20ESTE%20(2).pdf>. Accessed 01 March 2017 (in portuguese).
______. Ministério do Meio Ambiente. Inventário nacional de emissões atmosféricas por veículos automotores rodoviários 2013, ano-base 2012: relatório final. Brasília, 2014. Available in: <http://www.mma.gov.br/images/ arquivo/80060/Inventario_de_Emissoes_por_Veiculos_Rodoviarios_2013.pdf>. Accessed 05 March 2017 (in portuguese).
COHEN, A. J. et al. The global burden of disease due to outdoor air pollution. Journal of Toxicology and Environmental Health, Part A, v. 68, p. 1-7, 2005.
COMPANHIA DE TECNOLOGIA DE SANEAMENTO AMBIENTAL. (São Paulo State Environmental Company). Relatório de qualidade do ar no estado de São Paulo 2003. São Paulo: Cetesb, 2004. Available in: <http://ar.cetesb.sp.gov. br/publicacoes-relatorios>. Accessed 23 February 2017 (in portuguese).
______. Relatório de qualidade do ar no estado de São Paulo 2008. São Paulo: Cetesb, 2009. Available in: <http:// ar.cetesb.sp.gov.br/publicacoes-relatorios>. Accessed 23 February 2017 (in portuguese).
______. Qualidade do ar no estado de São Paulo 2012. São Paulo: Cetesb, 2013. Available in: <http://ar.cetesb. sp.gov.br/publicacoes-relatorios>. Accessed 23 February 2017 (in portuguese).
______. Qualidade do ar no estado de São Paulo 2015. São Paulo: Cetesb, 2016. Available in: <http://ar.cetesb. sp.gov.br/publicacoes-relatorios>. Accessed 23 February 2017 (in portuguese).
EMPRESA DE PESQUISA ENERGÉTICA. (Energy Research Office). Brazilian Energy Balance: year 2013 / Empresa de Pesquisa Energética. Rio de Janeiro: EPE, 2014. Available in: <https://ben.epe.gov.br/downloads/Relatorio_ Final_BEN_2014.pdf>. Accessed 05 March 2017.
GULIA, S. et al. Urban air quality management: a review. Atmospheric Pollution Research, v. 6, p. 286-304, 2015. IGNOTTI, E. et al. Efeitos das queimadas na Amazônia: método de seleção dos municípios segundo indicadores de saúde. Revista Brasileira de Epidemiologia, v.10, n. 4, p. 453-464, 2007.
IGNOTTI, E. et al. Impact on human health of particulate matter emitted from burnings in the Brazilian Amazon region. Revista de Saúde Pública, v. 44, n. 1, p. 121-130, 2010a.
IGNOTTI, E. et al. Air pollution and hospital admissions for respiratory diseases in the subequatorial Amazon: a time series approach. Cadernos de Saúde Pública, Rio de Janeiro, v. 26, n. 4, p. 747-761, 2010b.
INSTITUTO BRASILEIRO DE GEOGRAFIA E ESTATÍSTICA. Projeção da população do Brasil por sexo e idade 1980-2050: revisão 2008. (Estudos e pesquisas. Informação demográfica e socioeconômica, no 24). Rio de Janeiro: IBGE, 2008. Available in: <http://www.ibge.gov.br/home/estatistica/populacao/projecao_da_populacao/2008/ default.shtm>. Accessed 05 March 2017 (in portuguese).
______. Censo Demográfico 2010: características da população e dos domicílios. Resultados do Universo. Rio de Janeiro: IBGE, 2011. Available in: <http://biblioteca.ibge.gov.br/visualizacao/periodicos/93/cd_2010_ caracteristicas_populacao_domicilios.pdf>. Accessed 05 March 2017 (in portuguese).
______. Sinopse do Censo Demográfico 2010. Rio de Janeiro: IBGE, 2013. Available in: <http://www.censo2010. ibge.gov.br/sinopse/index.php?dados=7&uf=00>. Accessed 05 March 2017 (in portuguese).
______. Produto Interno Bruto dos Municípios 2012. Rio de Janeiro: IBGE, 2014. Available in: <ftp://ftp.ibge.gov. br/Pib_Municipios/2012/pibmunic2012.pdf>. Accessed 05 March 2017 (in portuguese).
______. Contas Nacionais Trimestrais: indicadores de volume e valores correntes. Rio de Janeiro: IBGE, 2015. Available in: <http://www.ibge.gov.br/home/estatistica/indicadores/pib/pib-vol-val_201502_9.shtm>. Accessed 05 March 2017 (in portuguese).
KUKLINSKA, K.; WOLSKA, L.; NAMIESNIK, J. Air quality policy in the U. S. and the EU – a review. Atmospheric Pollution Research, v. 6, p. 129-137, 2015.
MASCARENHAS, M. D. M. et al. Poluição atmosférica devida à queima de biomassa florestal e atendimentos de emergência por doença respiratória em Rio Branco, Brasil – Setembro, 2005. Jornal Brasileiro de Pneumologia, v. 34, n. 1, p. 42-46, 2008.
OLIVEIRA, B. F. A. de; IGNOTTI, E.; HACON, S. S. A systematic review of the physical and chemical characteristics of pollutants from biomass burning and combustion of fossil fuels and health effects in Brazil. Cad. Saúde Pública, v. 29, n. 9, p. 1678-1698, 2011.
OLMO, N. R. S. et al. A review of low-level air pollution and adverse effects on human health: implications for epidemiological studies and public policy. Clinics, v. 66, n. 4, p. 681-690, 2011. DOI:10.1590/S1807-59322011000400025.
OSTRO, B. Outdoor air pollution: assessing the environmental burden at national and local levels. Environmental burden of disease series, n. 5. In: PRUSS-USTUN, A.; CAMPBELL-LENDRUM, D.; CORVALAN, C.; WOODWARD, A. (Ed.). Geneva: World Health Organization, 2004.
SÃO PAULO (Estado). Decree n. 48.523, of 02.03.2004. Diário Oficial do Estado de São Paulo, Poder Executivo, São Paulo, 114, 41, Section I, p. 1, 2004.
SÃO PAULO (Estado). Decree n. 59.113, of 23.04.2013. Diário Oficial do Estado de São Paulo, Poder Executivo, São Paulo, 123, 76, Section I, p. 1, 3 and 4, 2013.
SILVA, A. M. C. da. et al. Material particulado (PM2.5) de queima de biomassa e doenças respiratórias no sul da Amazônia brasileira. Revista Brasileira de Epidemiologia, v. 13, n. 2, p. 337-351, 2010.
SMALL, K.; VAN DENDER, K. The Effect of improved fuel economy on vehicle miles traveled: estimating the rebound effect using U.S. State Data, 1966-2001. University of California, Irvine, 2005. Available in: <http:// citeseerx.ist.psu.edu/viewdoc/download?doi=10.1.1.192.1737&rep=rep1&type=pdf>. Accessed 05 March 2017. WHO (World Health Organization). WHO Air Quality Guidelines Global Update 2005. Report on a working group meeting, Bonn/Germany, 18-20 October 2005, 2005.