s
Process Analytics throughout the
entire natural gas pipeline supply
chain
Case Study · December 2008
Natural Gas (NG)
Natural Gas is a vital component of the world's supply of energy. It is one of the cleanest, safest, and most useful of all ener-gy sources. Unlike other fossil fuels, natural gas is clean burning and emits lower levels of potentially harmful by products into the air. While natural gas is formed primarily of methane, it can also include smaller amounts of higher Hydrocarbons. Found in underground reservoirs, natural gas is com-monly associated with oil deposits. Once brought from underground, the natu-ral gas is refined to remove impurities like water, other gases, sand, and other com-pounds. Some hydrocarbons are removed and sold separately, including propane and butane. Other impurities are also removed, like hydrogen sulfide to gain pipeline quali-ty natural gas.
Monitoring NG during pipeline transmis-sion
The purified natural gas is transmitted through a network of pipelines to its point of use. Transmitting natural gas from the wellhead to the end-user typically involves multiple processing steps and several phys-ical transfers of custody. During pipeline transport of NG, it is important to monitor quality parameters such as calorific value (CV), hydrocarbon dew point, hydrogen sul-fide and other compounds. Determination of the calorific value is particularly impor-tant in the energy measurements of natural gas for billing purposes (fiscal metering) at gas transfer stations. Monitoring of gas quality parameters is also required on the LNG-route where the natural gas is liquefied for easier transportation.
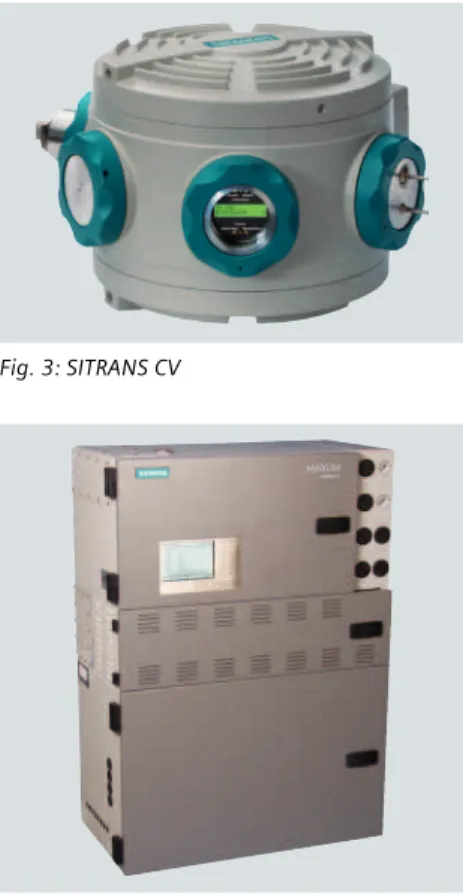
Siemens process gas chromatographs (PGCs) are also applied for NG monitoring: SITRANS CV as especially designed analyzer of the calorific value and MAXUM II as uni-versal PGC for enhanced quality and process control measurements.
Natural Gas Transmission from Wellhead to End User 2
Natural Gas Transmission from Wellhead to End
User
Transmission of natural gas from the wellhead to the end-user (fig. 1) in-volves various physical transfer and pro-cessing steps including metering and custody transfer.
Production and processing
Gas gathering at the wellhead
Gathering systems are a series of pipes that collect natural gas and transport it to the larger transmission pipeline. This begins at the wellhead and may be through a series of piping systems that consolidate gas from different wells. The pipeline directs the flow either to a natural gas processing plant or directly to a main transmission grid, depending upon the initial quality of the wellhead product. Natural gas exiting the produc-tion field is usually referred to as "wet" natural gas if it still contains significant amounts of hydrocarbon liquids and contaminants.
Natural Gas processing plant
The principal service provided by a nat-ural gas processing plant is to produce pipeline quality natural gas. NG main-line transmission systems are designed to operate only within certain toleranc-es of specific gravititoleranc-es, prtoleranc-essurtoleranc-es and HCDP, BTU (British Thermal Unit) con-tent range, or water and H2S concon-tent level to avoid operational problems. Natural gas processing plants are also used to recover natural gas liquids and to extract impurities from the gas, em-ploying various techniques and
technol-ogies. The objective is not only to pro-duce pipeline quality "dry" gas but also to remove higher hydrocarbons from the natural gas and separate into "frac-tions," such as propane, butane, and ethane.
Natural Gas liquefaction to LNG
Of growing importance, natural gas is liquefied to LNG, which, because of its reduced volume, can be easily trans-ported over long distances in pipes or tankers. It is finally converted back to gas. Various metering and custody transfer stations are distributed along this transport route.
Distribution
Storage
Transmission
Processing
Production
Processing
Transmission
Storage
Distribution
Use
Production
Use
On-shore Pipeline
Underground LNG
Off-shore
Gas treatment Custody transfer Consumer
Power generation
Natural Gas Transmission from Wellhead to End User 3 Transmission and storage
Mainline transmission systems
Mainline transmission systems are wide diameter, long-distance pipelines to transport natural gas from the produc-ing area to market areas. A grid type transmission system is usually charac-terized by a large number of laterals or branches from the mainline, which tend to form a network of integrated receipt, delivery and pipeline interconnections to serve major market areas.
Storage facilities
In between or at the end of a mainline transmission system, natural gas stor-age facilities provide for inventory man-agement, supply backup, and the access to natural gas to maintain the balance of the system.Natural Gas is most com-monly held in inventory underground under pressure in depleted reservoirs such as oil or gas fields, aquifers or salt cavern formations. Storage facilities provide suppliers with the means to meet peak customer requirements up to a point.
Compressor stations
Natural gas is highly pressurized as it travels through a main pipeline. To en-sure that the natural gas flow through the pipeline remains pressurized, com-pression of this natural gas is required periodically along the pipe. This is ac-complished by compressor stations, usually placed at 40 to 100 mile inter-vals along the pipeline. The size of the station and the number of compressors vary, based on the diameter of the pipe and the volume of gas to be moved. Typ-ical pressure levels for major transmis-sion systems are in the range of 5000 to 9000 kPa.
Metering stations
Metering stations are placed periodical-ly along natural gas pipelines. These sta-tions allow pipeline companies to mon-itor and manage the natural gas in their pipes. Essentially, these metering sta-tions measure the flow of gas along the pipeline, and allow to 'track' natural gas on its way to the end-user.
Mixing stations / Biogas feed
The main purpose of a mixing station is to mix natural gases from two different gas suppliers with often different calo-rific values. Another objective is to feed biogas as renewable energy fraction into the natural gas. One issue related to mixing stations is to ensure a constant calorific value of the mixed gas.
Custody transfer stations
Natural gas is priced and sold based on the energy flow that is delivered to the customer. Energy flow is calculated from the product of volume flow under standard conditions and the calorific value. Each time that custody of natural gas changes, it is measured at custody transfer stations for billing purposes. Volume flow is determined using flow measuring systems, e.g. based on ultra-sonics.
Energy content (calorific value) is mea-sured by means of gas chromatography when determining the composition of the gas. New and improved technology in chromatography, as represented by the Siemens SITRANS CV gas chromato-graph (page 4) have significantly in-creased accuracy, reliability and integri-ty of custody transfer measurement sys-tems. Additional quality parameters such as hydrocarbon and water dew point, as well as concentration values of sulfurous compounds has to be mea-sured as well.
Distribution
Distribution is the final step in delivering natural gas to end users. While large in-dustrial, commercial, and electric power generation customers get natural gas di-rectly from high capacity pipelines, most other users receive natural gas from local distribution companies through small di-ameter low pressure distribution pipes. Market centers for the pricing of natural gas are located at certain points of this distribution systems.
Physical Properties of Natural Gas as Quality Parameters 4
Physical Properties of Natural Gas as Quality
Parameters
Composition and physical properties of Natural Gas in a pipeline transmission and distribution system vary in time and space. Information about the quality of NG is important for gas transmission, gas use and gas supply billing. Heating Content (CV, BTU)
The calorific value of a fuel is the quanti-ty of heat produced by its combustion, at constant pressure and standard condi-tions of temperature (0, 15, 20, 25 °C) and pressure (101,325 kPa). The com-bustion of a fuel generates water vapor. Special techniques are used to recover the quantity of heat contained in this wa-ter vapor by condensing it.
The Superior Calorific Value (CVS) sup-poses that the water of combustion is entirely condensed and that the heat contained in the water vapor is recov-ered.
The Inferior Calorific Value (CVi) suppos-es that the products of combustion con-tain the water vapor. The heat concon-tained in the water vapor is not recovered. The British Thermal Unit (BTU or Btu) is a unit of energy used in the power, steam gen-eration, and air conditioning industries. It is used in parallel with the other unit of energy, the joule (J, 1 BTU = 1 055.06 J).
CV determination by Gas Chromatog-raphy
Determination of the calorific value is based on the composition of the gas. The composition is also used to calculate the compressibility of the gas which is re-quired to convert the flow volume from process conditions to standardized con-ditions. Natural gas is analyzed in accor-dance with ISO 6974 (see page 6). The gas is separated into its constituent com-pounds methane, ethane, carbon diox-ide, C3, C4, C5, C6+ and the amount of each constituent determined. The physi-cal properties of each component, as de-fined by standards, e. g. ISO 6976 or GPA 2172, are programmed in the chro-matographs software. Hence, the overall energy content of the gas can be calcu-lated from the measured composition using the values of gas flow, pressure and temperature as variables (Fig. 2). SITRANS CV (Fig. 3) has been especially designed to perform the entire CV analy-sis including calculation in one compact analyzer Read more about SITRANS CV on page 7.
Gas Interchangeability Wobbe Index / Density
The Wobbe index is the Calorific Value di-vided by the square root of gas relative density, commonly expressed in Btu per standard cubic foot or mega joules per standard cubic meter. In the case of nat-ural gas, the typical heating value is around 1 050 Btu per cubic foot and the specific gravity is approximately 0.59, giving a typical Wobbe index of 1 367. The Wobbe Index is the main indicator of the interchangeability of fuel gases and is frequently defined in the specifications of gas supply. If two fuels have identical Wobbe Indices then for given pressure the energy output will be identical.
NG stream
Gas pressure,
temperature
Gas flow
Gas composition
(GC, ISO 6974)
Standardized flow
Energy
Superior Calorific Value, density, CO2(ISO 6976) Compressibility
(ISO12213)
Measurement
Calculation
Physical Properties of Natural Gas as Quality Parameters 5 Hydrocarbon Dewpoint
The hydrocarbon dew point is a measure for the concentration of hydrocarbons in a gas. It is defined as the temperature (at a given pressure) where the hydrocarbon components of the gas mixture, such as natural gas, will start to condense out of the gaseous phase. It is often also re-ferred to as the HDP or the HCDP. The hy-drocarbon dew point is important be-cause higher hydrocarbons in natural gas, in form of droplets, tend to damage the compressors blades. Hydrocarbon dewpoint is typically analyzed by using a gas chromatograph for gas composition analysis combined with a calculation method based upon equations of state, or using chilled mirror based technolo-gies.
Water Dewpoint
The water dew point is the temperature at a given pressure where water begins to condense out. At a given pressure, in-dependent of temperature, the dew point indicates the mole fraction of wa-ter vapor in the gas, and therefore dewa-ter- deter-mines the specific humidity of the gas. Typically analyzed by sensor (ZrO2, Al2O3, ceramic) or laser analyzers.
Sulfur compounds and CO2
Numerous natural gas wells produce what is called "sour gas", i.e. natural gas containing hydrogen sulfide, mercap-tans, sulfides and disulfides in concen-trations that makes the natural gas un-suitable for transport and usage. Efforts are spent to remove these undesired compounds. In addition, the natural gas may also contain varying amounts of carbon dioxide, which often has to be removed as well. A number of processes are known for the removal of sulphur compounds and optionally carbon diox-ide from natural gas. Process gas chro-matographs such as MAXUM II, (Fig. 4) are typically used to control and opti-mize these processes.
Odorants
After purification, natural gas is virtually odorless, which is a major safety issue, because leakages cannot be detected easily and quick enough. Therefore, it is a regulatory requirement that natural gas which is delivered to customers must be odorized so that leaks are readi-ly detectable. In the USA, e. g., 49 CFR 192 (Transportation of natural gas by pipeline, minimum federal safety standards) demands operating
compa-nies to test and confirm concentrations of odorants to be in accordance with the regulations. One option to do this effi-ciently and reliably is the use on-line process gas chromatographs such as MAXUM II, Fig. 4.
Use of Process Gas Chromatography 6
Use of Process Gas Chromatography
High demands on Process GasChro-matographs
The demands placed on chromato-graphs with respect to accuracy and re-liability are extremely high in such appli-cations. Remote monitoring and system ruggedness are also significant factors when considering the infrastructure as-sociated with the transportation of nat-ural gas.
State of the art
Current state-of-the-art technology to perform the required analysis tasks nor-mally applies a universal process gas chromatograph for quality control (Im-purities, odorants, hydrocarbon dew point) and a specialized chromatograph for fiscal metering of the calorific value.
Micro Process-GC for fiscal metering
Due to the growing global demands for natural gas as a source of energy, liber-alization of the markets as well as the in-ternational networking of pipeline sys-tems, a further increase in the necessity for dedicated calorific value analyzers in custody transfer plants exists. Consider-ing the demands on such specialized an-alyzers with respect to analytical perfor-mance, harsh installation environments in remote locations, unmanned remote operation, micro process gas chromato-graphs provide the ideal prerequisites for satisfying such demands.
Measuring locations and measuring objectives
Fig. 5 shows the location of typical mea-suring stations along a NG transmission path from the wellhead to the end user. Measuring objectives will vary from fast process control, focussed CV determina-tion at mixing stadetermina-tions through fiscal metering at Biogas line entries to en-hanced quality measurement at big cross border stations. Instrumentation will vary accordingly (table 1). Installa-tion examples are shown in fig. 6: SITRANS CV (left and center) and SITRANS CV in combination with MAXUM II (at right).
NG Wellhead NG Distribution End User Industrial LNG Liquefaction & storage NG Processing
on-/offshore/FPSO
LNG Regasification & storage Import cross border
Underground storage
Measuring locations
NG Transportation
NG Distribution
Export cross border
End User Municipal End User Power station Mixing station (Gathering systems) Biogas LNG Tanker FPSO: Floating production storage and offloading Fig. 5: Measuring locations along natural gas transmission path
Measuring Objective Recommended analyzer
Natural Gas Pipeline Quality control
N2, CO2, C1 to C5, C6+ (Application 1) SITRANS CV
H2S and COS (Application 2) MAXUM II
Odorants (Mercaptans, Disulfides, Application 3) MAXUM II
Fiscal Metering (billing purposes)
CV / BTU determination SITRANS CV
Process Control
Various applications and measuring tasks MAXUM II, SITRANS CV
Combined Measuring Objectives
Fiscal metering and quality control (Appl. 1) SITRANS CV
Fiscal metering + enhanced quality control (Appl. 1, 2 and/or 3) SITRANS CV + MAXUM II
Fiscal metering + process control SITRANS CV + MAXUM II
Table 1: Measuring objectives and recommended analyzers
SITRANS CV, the perfect Solution Provider 7
SITRANS CV, the perfect Solution Provider
SITRANS CV design
SITRANS CV is a very compact on-line gas chromatograph that has been espe-cially designed for calorific value analy-sis. From upstream to distribution net-work SITRANS CV is suitable for multiple applications, like fiscal metering, full component analysis and quality control with metrology quality results.
Hardware
SITRANS CV hardware is based on micro-machined systems on the scale of mi-crochip technology. Miniaturisation of the most important components using this pioneering technology permits an extremely compact design for the com-plete device which is also associated with high resistance to environmental influences. High protection against moisture, dust and corrosion (IP65, NEMA4X), operation at extreme ambi-ent temperatures (-20 to +55 °C), as well as explosion protection using a pressurised enclosure without purging, are indispensable for typical field instal-lations which are frequently directly at the sampling points.
The analyzer comprises three modules (analytics, pneumatics and electronics) which are integrated in a transmitter housing. These modules have standard-ised designs, connection systems and interfaces. This allows rapid replace-ment and reduced stocking of spare parts.
Analytical module
The analytical module has been special-ly designed for the anaspecial-lysis of natural gas. All hardware components such as valveless live injection, high-resolution narrow bore capillary columns, valve-less column switching as well as multi-ple and in-line detectors (μ-thermal con-ductivity detectors, μ-TCDs) are matched to one another,e.g. through al-most identical internal diameters, usual-ly 0.15 mm. This ideal interaction with-out dead volumes makes a significant contribution to the analytical perfor-mance of the entire system.
Analytical configuration
Fig. 7 shows the analytical configura-tion of SITRANS CV. Three analysis sets each comprising a capillary column and an in-line μ-TCD are arranged along the sample path. Polarity and length of the columns are designed such that the measurement can be carried out in the fastest and simplest manner. The lists below the analysis sets indicate the components measured here.
Further three detectors are arranged in-line at various points of the system. Thereby it is possible to monitor the in-jection peak, the progres in the separa-tion following each column and all gas outputs. Thus the system delivers infor-mation on the injection quality, the ex-act setting of the backflushing or the time for the cut. These can be used for system verification.
In addition to the most interesting com-ponents, the system can individually evaluate hydrocarbons of higher boiling point (C6+) using column 1 and compo-nents such as nitrogen, methane, ethane and CO2 using column 3. An advanced calorific value analysis is also available where oxygen and CO are separated in addition. The analysis time of <180 s for all options is not extended by this.
Software
The micro process GC is equipped with simple, easy-to-use and intuitive Win-dowsbasedsoftware. Some of the re-markable features are:
• Data saving > 30 days and genera-tion of mean values for all compo-nents and calorimetric values are im-plemented
• Automatic method optimization in-creases reliability
• Logbook for traceability of events and alarms.
• Optimum pressure setting of the electronic pressure controllers (EPCs) can be computed and need not be set by a complex empirical method. • Calculation of Calorific Value,
Den-sity and Wobbe Index
• Self diagnosis of all analytical param-eters monitors health status
• Password protected access guaran-tees high security
• Internal mean value calculation • Internal trend evaluation of
individ-ual components and calculated val-ues CV Control & PC Anywhere CV Control & PC Anywhere Ethernet VPN Tunnel INTERNET SITRANS CV Box PC Remote Control room Firewall Modem Security modem Firewall Router
Fig. 8: TeleControl of SITRANS CV via internet
Sample Carrier gas Live Switching Column 1 TCD TCD TCDTCD TCDTCD TCD TCD TCDTCD Column 3 Column 2 Live Injection Propane i-Butane n-Butane neo-Pentane i-Pentane n-Pentane Nitrogen Methane Ethane CO2 C6+ Vent TCD TCD Validation Validation Validation Validation Validation Validation
SITRANS CV, the perfect Solution Provider 8
Interfacing to controllers and tele-control via internet (fig. 8)
The integral interfaces of the analyzer permit communication to host equip-ment such as flow computers over RS485/MODBUS or a control computer over Ethernet TCP/IP for remote opera-tion. SITRANS CV is often installed in the outback, where no telephone line is available. For those installations, a GPRS/ VPN (General Packet Radio Service / Vitu-al Private Network) solution is available using proven components from Siemens.
OutBack: A Box PC is installed (contain-ing SITRANS CV control software and a remote control software like PC-Any-where) and connected to the net via modem and firewall. The Box PC and the modem can easily be integrated into a EEx-d Box.
MSR-office: A desktop PC is installed with PC-Anywhere and SITRANS CV con-trol software. The PC is connected to the internet via a security modem, firewall and a DSL module.
The Integrated firewall and VPN tech-nology permit secure bi-directional communication between remote sta-tion and control room.
SITRANS CV performance
Measuring components and calculat-ed parameters
As dedicated analyzer, SITRANS CV mea-sures, calculates and displays all values which are required in natural gas trans-mission monitoring. Table 2 (upper part) shows the measuring components with measuring ranges, measured mean concentration values and result-ing relative standard deviations. Calcu-lated values (Calorific Value, Density and Wobbe Index) including standard deviation are shown in the lower part. Measurements and calculations are per-formed according to recent ISO stan-dards, see below.
Separation performance
Separation and detection of the compo-nents are performed by various narrow-bore capillary columns and in-line de-tectors. As an example, the high resolu-tion between n-butane and neopentane allows a detection limit for neopentane of < 5 ppm.
Repeatability
The standard deviations as proof of the repeatability of all measured compo-nents as well as the calculated values (table 2) significantly satisfy the mini-mum requirements placed on highly precise calorific value analysers (ISO 6974).
Linearity, single point calibration
When used for fiscal metering, calorific value analyzers must be calibrated regu-larly, usually weekly. The calibration is carried out using a procedure compara-ble to gas chromatography where an ex-ternal calibration gas is mainly used
which is directly connected to the ana-lyzer and usually supplied to this auto-matically.
As a result of the high linearity of the micro-TCDs, SITRANS CV only requires a single point calibration for each compo-nent using just one calibration gas, even during initial start-up of the analyser. Complex multilevel calibrations on site with up to seven calibration gases are not essential. Measured Values (Gas components) Measuring range [%] Concentration (Mean values) Repeatability as relative Standard Deviation [%] Nitrogen N2 < 25 1.3464 Mol % 0.485036 Carbon Diox-ide CO2 < 20 0.3480 Mol % 0.319118 Methane C1 > 55 97.3048 Mol % 0.008662 Ethane C2 < 20 0.3982 Mol % 0.359759 Propane C3 < 10 0.1996 Mol % 0.358462 so-Butane C4 < 5 0.0995 Mol % 0.556262 n-Butane n-C4 < 5 0.1031 Mol % 0.596241
neo-Pentane neo-C5 < 1 0.0509 Mol % 0.857970
iso-Pentane i-C4 < 1 0.0494 Mol % 1.084269
n-Pentane n-C5 < 1 0.0500 Mol % 0.956977 Sum C6+ C6+ < 3 0.0502 Mol % 0.841165 Calculated Values Superior CV 39,8284 MJ/m3 0.006913 Inferior CV 35,9134 MJ/m3 0.006981 Density 0,7433 Kg/m3 0.009645 Relative Density 0,5749 0.009661 Wobbe Index 52,5300 0.009064
Table 3: SITRANS CV measurements with components, ranges and repeat abilities
SITRANS CV, the perfect Solution Provider 9
Metrological Approvals
SITRANS CV has been certified for fiscal metering in many countries (table 3).
Minimal temperature influence
Due to the extreme installation condi-tions the influence of ambient tempera-ture changes on the precision of the measuring device is a crucial factor. Hence, SITRANS CV has been tested (fig. 10) extensively according to differ-ent parts of the EN 60068-2 standard, which deals with cold test, dry heat test and damp heat test. The results have been excellent.
Fig. 11 shows, as typical result, the very small measuring error of the CV output signal (green) over an extensive range of temperature changes together with the error (red) tolerated by the PTB (Ger-man metrological authority).
Fig. 10: Temperature test set-up
ISO 6974-5 (2000)
Natural gas -- Determination of composition with defined uncertainty by gas chromatography
Part 5: Determination of nitrogen, carbon dioxide and C1 to C5 and C6+ hydro-carbons for a laboratory and on-line process application using three columns
ISO 6976 (1995)
The DIN EN ISO 6976 standard specifies methods for the calculation of both the superior calorific value and the inferior calorific value, density, relative density and Wobbe index of dry natural gas and other combustible gaseous fuels.The cal-culation is done from the composition of the gas by mole fraction, that is ob-tained from GC measurements of the gas components. It also describes the de-termination of accuracy (precision of CV) from precision of analysis.
Fig. 11: Absolute measuring error of SITRANS CV
-15 -10 -5 0 5 10 15 20 25 30 14:24 19:12 00:00 04:48 09:36 14:24 19:12 Time Te m p e rature [° C] 35,0 35,1 35,2 35,3 35,4 35,5 35,6 35,7 35,8 35,9 36,0 Calorific V alue [MJ/m 3] T emperature C alorific V alue Tolerated measuring error SITRANS CV Absolute measuring error
Table 2: SITRANS CV Type Approvals
SITRANS CV
Type Approval Certificates for Legal Metrology Regulations
Public Authority Country
PTB
Physikalisch-Technische Bundesanstalt
Germany General Administration of Quality, Supervision, Inspection and Quarantine
of the P.R. of China
China Committee for Technical Regulation and Metrology of Kazakhstan Republic Kazakhstan
GOST Standard Russia
BRLM
Romanian Bureau of Legal Metrology
User Benefits 10
User Benefits
Determine natural gas precisely
• Analyze C6, C7, C8 and C9 individu-ally for more accurate CV value • Independent of sample and ambient
pressure variations using valveless Live injection
• High separation power using narrow bore capillary columns; clogging of columns has not been observed • Low detection limits using sensitive
detectors
• High linearity throughout measuring ranges saves expensive calibration gases
Determine natural gas fast
• Fast analysis through pioneering MEMS technology
• Update of calorific value each 180 s
Determine natural gas reliable
• Reliable technology through many years of experiences
• Plug and play maintenance guaran-tee short down times < 2 hours • Separation reliability guaranteed
through in line detection • Improved reliability – no
conven-tional valve switching with movable parts
• Automatic optimization of methods increases availability
• Perfect integration into network through communication options
Low operating costs through modular design
• Low maintenance in operation • Repair in minutes, just exchange
an-alytical plug & play module, stable operation already 30 min. later • During stand-by modus gas
con-sumption only 6 ml/min
• Low power consumption
Flexible installation through compact design
• Minimal space needed
• Rugged design for extreme areas of use NEMA 4X / IP65 enclosure suit-able even for off-shore installation and ambient temperature suitability (-20 °C to +55 °C) even for e.g. Mid-dle East desert installations • Simple installation on site
Analytical Solutions 11
Analytical Solutions
Our solutions
Analytical solutions are always driven by the customer´s requirements. We offer an integrated design covering all steps from sampling point and sample prepa-ration up to complete analyzer cabinets or for installation in analyzer shelters. This includes also signal processing and communications to the control room and process control system.
We rely on a wide scope of extractive and in-situ gas analyzers and gas chro-matographs (table 4), many years of world-wide experience in process auto-mation and engineering and a collec-tion of specialized knowledge in key in-dustries and industrial sectors. We pro-vide Siemens quality from a single source with a function warranty for the entire system.
Analyzer networking for data com-munication
Engineering and manufacturing of pro-cess analytical solutions increasingly comprises "networking". It is getting a standard requirement in the process in-dustry to connect analyzers and analyz-er systems to a communication network to provide for continuous and direct data transfer from and to the analyzers. The two objectives are (fig. 13) • To integrate the analyzer and
ana-lyzer systems seamless into the PCS / DCS system of the plant and • To allow direct access to the
analyz-ers or systems from a maintenance station to ensure correct and reliable operation including preventive or predictive maintenance.
Siemens Process Analytics provides net-working solutions to meet the demands of both objectives. Continuous Gas Analyzer Field Installation Shelter, CEMS* DCS* Integration: M odbus P R O F IB U S Industrial E thernet O P C via E thernet Central Maintenance Access ASM* Process Control System Maintenance System Third Party Analyzer
* DCS: Distributed Control System ASM: Analyzer System Manager
CEMS: Continuous Emission Monitoring System
Process-GC Single Device
Decentralized Centralized System
Fig. 12: Networking for DCS integration and maintenance support
Process Gas Chromatographs (Process GC)
MAXUM edition II MAXUM edition II is very well suited to be used in rough industrial
en-vironments and performs a wide range of duties in the chemical and petrochemical industries and refineries. MAXUM II features e. g. a flex-ible, energy saving single or dual oven concept, valveless sampling and column switching, and parallel chromatography using multiple single trains as well as a wide range of detectors such as TCD, FID, FPD, PDHID, PDECD and PDPID.
MicroSAM MicroSAM is a very compact explosion-proof micro process
chromato-graph. Using silicon-based micro mechanical components it combines miniaturization with increased performance at the same time. Micro- SAM is easy to use and its rugged and small design allows mounting right at the sampling point. MicroSAM features drastically reduced cy-cle times, provides valveless sample injection and column switching and saves installation, maintenance, and service costs.
SITRANS CV SITRANS CV is a micro process gas chromatograph especially designed
for reliable, exact and fast analysis of natural gas. The rugged and com-pact design makes SITRANS CV suitable for extreme areas of use, e.g. off-shore exploration or direct mounting on a pipeline. The special soft-ware "CV Control" meets the requirements of the natural gas market, e.g. custody transfer.
Analytical Services 12
Analytical Services
Service portfolio
Our wide portfolio of services is seg-mented into Consulting, Support and Service (fig. 14). It comprises really all measures, actions and advises that may be required by our clients throughout the entire lifecycle of their plant. It rang-es from site survey to installation check, from instruction of plant personnel to spare part stock management and from FEED for Process Analytics (see below) to internet-based service hotline Our service and support portfolio (in-cluding third-party equipment) com-prises for example:
• Installation check • Functionality tests • Site acceptance test
• Instruction of plant personnel on site • Preventive maintenance
• On site repair
• Remote fault clearance • Spare part stock evaluation • Spare part management • Professional training center • Process optimization • Internet-based hotline • FEED for Process Analytics
FEED for Process Analytics
Front End Engineering and Design (FEED) is part of the planning and engi-neering phase of a plant construction or modification project and is done after conceptual business planning and prior to detail design. During the FEED phase, best opportunities exist for costs and time savings for the project, as during this phase most of the entire costs are defined and changes have least impact to the project.
Siemens Process Analytics holds a unique blend of expertise in analytical technologies, applications and in pro-viding complete analytical solutions to many industries.
Based on its expertise in analytical tech-nology, application and engineering, Siemens Process Analytics offer a wide scope of FEED services focused on ana-lyzing principles, sampling technolo-gies, application solutions as well as communication system and given stan-dards (all related to analytics) to support our clients in maximizing performance and efficiency of their projects. Whether you are plant operators or be-long to an EPC Contractor you will ben-efit in various ways from FEED for Pro-cess Analytics by Siemens:
• Analytics and industry know how available, right from the beginning of the project
• Superior analyzer system perfor-mance with high availability
• Established studies, that lead to real-istic investment decisions. Fast and clear design of the analyzer system specifications, drawings and docu-mentation
• Less project management and coor-dination effort, due to one responsi-ble contact person and less time in-volvement Additional expertise on demand, without having the costs, the effort and the risks of building up the capacities
• Lowest possible Total Costs of Own-ership (TCO) along the lifecycle re-garding investment costs, consump-tions, utilities supply and
maintenance
• Predictable time schedule by agreed on design early in the project phase • Greatly minimized change orders
during project execution
Installation & commissioning Plant life cycle
Modernization Operation & maintenance Engineering & development Planning & design Online Support FEED for Process Analytics
Engineering
Service contracts Repairs and spare parts
Field service
Optimization and modernization Technical Support
Training
Installation and commissioning Installation &
commissioning Plant life cycle
Modernization Operation & maintenance Engineering & development Planning & design Online Support FEED for Process Analytics
Engineering
Service contracts Repairs and spare parts
Field service
Optimization and modernization Technical Support
Training
Installation and commissioning
Siemens Process Analytics - Answers for industry
If you have any questions, please contact your local sales representative or any of the contact addresses below::
Siemens AG
I IA SC PA, Process Analytics Östliche Rheinbrückenstr. 50 76187 Karlsruhe Germany Tel.: +49 721 595 3829 Fax: +49 721 595 6375 E-Mail: processanalytics.automation@siemens.com www.siemens.de/prozessanalytik Siemens Ltd., China I IA SC, Process Analytics 7F, China Marine Tower No.1 Pu Dong Avenue Shanghai, 200120 P.R.China Tel: +86 21 3889 3602 Fax: +86 21 3889 3264 E-Mail: xiao.liu1@siemens.com www.ad.siemens.com.cn
Siemens Energy & Automation Inc. 7101 Hollister Road Houston, TX 77040 USA Tel.: +1 713 939 7400 Fax: +1 713 939 9050 E-Mail: saasales.sea@siemens.com www.siemens.com/processanalytics Siemens LLC I IA 2B. PO Box 2154, Dubai, U.A.E. Tel.: +971 4 366 0159 Fax: +971 4 3660019 E-mail: fairuz.yooseff@siemens.com www.siemens.com/processanalytics
Siemens Pte. Limited I IA SC PS/PA CoC 60 MacPherson Road Singapore 348615 Tel.: +65 6490 8728 Fax: +65 6490 8729 E-Mail: splanalytics.sg@siemens.com www.siemens.com/processanalytics Siemens AG Sector Industry
Sensors and Communication Process Analytics
76181 KARLSRUHE GERMANY
© Siemens AG 2008
Subject to change without prior notice