High Apparent Dielectric Constant Inside a Protein Reflects Structural
Reorganization Coupled to the Ionization of an Internal Asp
Daniel A. Karp,* Apostolos G. Gittis,* Mary R. Stahley,* Carolyn A. Fitch,* Wesley E. Stites,y and Bertrand Garcı´a-Moreno E.*
*Department of Biophysics, Johns Hopkins University, Baltimore, Maryland; andyDepartment of Chemistry and Biochemistry, University of Arkansas, Fayetteville, Arkansas
ABSTRACT The dielectric properties of proteins are poorly understood and difficult to describe quantitatively. This limits the accuracy of methods for structure-based calculation of electrostatic energies and pKavalues. The pKavalues of many internal groups report apparent protein dielectric constants of 10 or higher. These values are substantially higher than the dielectric constants of 2–4 measured experimentally with dry proteins. The structural origins of these high apparent dielectric constants are not well understood. Here we report on structural and equilibrium thermodynamic studies of the effects of pH on the V66D variant of staphylococcal nuclease. In a crystal structure of this protein the neutral side chain of Asp-66 is buried in the hydrophobic core of the protein and hydrated by internal water molecules. Asp-66 titrates with a pKavalue near 9. A decrease in the far UV-CD signal was observed, concomitant with ionization of this aspartic acid, and consistent with the loss of 1.5 turns of
a-helix. These data suggest that the protein dielectric constant needed to reproduce the pKavalue of Asp-66 with continuum electrostatics calculations is high because the dielectric constant has to capture, implicitly, the energetic consequences of the structural reorganization that are not treated explicitly in continuum calculations with static structures.
INTRODUCTION
Ionizable residues sequestered from bulk water in the interior of proteins or at the interfaces between proteins and other molecules usually titrate with pKavalues that are different
from the normal pKa values of ionizable groups in water.
This effect is primarily a consequence of the dehydration experienced by the ionizable groups in these relatively dry environments (1,2). It reflects the loss of favorable interac-tions between the ionizable groups and water that are not replaced by interactions with polar elements of the protein. Dehydration shifts the equilibrium between the charged and neutral species of a titratable group toward the neutral form. Therefore, the pKa values of internal acidic residues are
usually elevated relative to their pKa values in water, and
those of internal basic residues are usually depressed (1,3–6). The factors that determine the magnitude of these shifts in pKavalues are not well understood.
The shifts are governed partly by the extent to which proteins and the solvent can reorganize or relax when the internal ionizable groups are charged. This reorganization can change the polarity and the electronic polarizability of the microenvironment surrounding the ionizable moieties. Fast local or slow global motions that reorient permanent dipoles and that establish or remove interactions with polar groups, with water, or with other charged groups can also be important determinants of the pKavalues of internal groups.
In general, the dielectric relaxation properties of proteins and the structural and physical determinants of the pKavalues of
internal ionizable groups are poorly understood. The central importance of internal ionizable groups and of charge trans-fer reactions to many key biochemical processes warrants continued investigation of this problem.
The pKavalues of Glu and Lys buried at positions 66 and
92 of staphylococcal nuclease (SNase) were reported pre-viously (3,4,6,7). They are shifted by ;4–5 pKa units
relative to the normal pKavalues of Glu and Lys in water. To
reproduce these pKavalues with structure-based calculations
with continuum (1) and semimacroscopic (2) methods, it is necessary to treat the protein interior with high dielectric constants in the range 6–10. These apparent dielectric constants are much higher than the real dielectric constants of 2–4 measured experimentally with dry protein powders. The structural and physical origins of these high apparent protein dielectric constants remain unclear.
The high apparent dielectric constants reported by internal ionizable groups in SNase were unexpected because in crystal structures, obtained under conditions of pH in which these groups are neutral, their ionizable moieties are sur-rounded by hydrophobic atoms. The only nearby polar atoms consistent with the high apparent polarizability are from internal water molecules, which have been observed in con-tact with the carboxyl group in the structures of the Glu-66 and Glu-92 variants obtained at 100 K (3,6). The presence of these internal water molecules led to the hypothesis that water penetration is the source of the high polarizability re-ported by internal ionizable groups in SNase. This has been considered previously in computational studies (8–10).
This hypothesis has been challenged by two observations. First, relatively high apparent dielectric constants near 6 are necessary to reproduce the experimental pKavalues of
Submitted June 18, 2006, and accepted for publication October 13, 2006. Address reprint requests to Bertrand Garcı´a-Moreno E., Tel.: 410-516-4497; E-mail: [email protected].
Glu-66 and Lys-66 in structure-based calculations, even when the internal water molecules are treated explicitly in the calculations and allowed to reorient when the internal groups are charged (2). Second, the internal water molecules ob-served in structures of the V66E and I92E variants obtained at 100 K, under conditions of pH where the internal ionizable groups are neutral, are absent in structures obtained at 298 K (6,11). The internal water molecules are also absent in both cryogenic and room temperature structures of the variants with Lys-66 or Lys-92 (4,6,7), and these internal Lys res-idues report apparent polarizability as high as Glu at these positions. Furthermore, magnetic relaxation dispersions stu-dies with the V66E and V66K variants found no evidence of buried water molecules near these internal ionizable groups (11).
It is more likely that the high apparent polarizability reported by the pKa values of internal residues in proteins
reflect conformational reorganization or other relaxation processes, and is not related to the presence of internal water molecules. This conformational reorganization has not been detected previously in spectroscopic studies of the V66E and V66K variants of SNase. The intrinsic fluorescence and near and far-UV CD signals of these proteins suggest that the conformation of these proteins remains essentially unper-turbed and nativelike under conditions of pH where the internal groups are ionized. Whatever reorganization takes place concomitant with the ionization of the internal Glu-66 and Lys-66 must be limited to discrete, local events that are invisible to these optical spectroscopic methods.
Here we report on the effects of pH on the conformation and equilibrium thermodynamic properties of a nuclease variant with an internal aspartic acid at position 66. What is unique about the V66D variant is that with this protein we have detected, for the first time in SNase, conformational reorganization concomitant with the ionization of an internal ionizable group. The significance of these data is that they suggest that the apparent protein dielectric constants needed to reproduce the pKa values of internal ionizable residues
with continuum methods are high because the calculations with static structures do not treat the structural reorganization triggered by the ionization of the internal groups explicitly. Computational methods for structure-based calculations of pKavalues and electrostatic energies can neither be
im-proved nor applied to study biological processes driven by electrostatics until the coupling between ionization of internal groups and conformational reorganization can be treated rigorously. Several computational methods have been proposed recently to simulate structural reorganization coupled to ionization reactions (12–19).
MATERIALS AND METHODS Staphylococcal nuclease
The QuikChange kit from Stratagene (La Jolla, CA) was used to introduce Asp at position 66 in the hyperstable variants of staphylococcal nuclease (SNase) known as PHS (after the P117G, H124L, and S128A substitutions) and D1PHS (PHS with additional G50F and V51N substitutions and a 44–49 deletion). The mutagenesis was performed with clones of PHS and D1PHS engineered originally by Prof. David Shortle at Johns Hopkins University School of Medicine using the l-pL9 plasmid. Proteins were expressed and purified by the method of Shortle and Meeker (20) as modified by Byrne et al. (21). Protein concentration was determined using an extinction coefficient of 1.463104M1cm1, determined using the method of Edelhoch, as refined by Gill and von Hippel (22,23). This corresponds to absorption of 0.87 for a 1 mg/ml solution of wild-type SNase. The background and variant proteins were treated with the same extinction coefficient.
pH titrations monitored by fluorescence and CD
The acid/base titrations monitored by changes in fluorescence were per-formed with an ATF-105 automated titration fluorometer (Aviv, Lakeland, NJ), following protocols described previously for wild-type SNase (24). The unfolding ofD1PHS and its variants is much slower than that of wild-type. Therefore, the time allowed between the deliveries of consecutive doses of titrant in the automated acid/base unfolding experiments was extended to 5 min to allow the system to reach equilibrium. The delay between the deliveries of titrant in the automated titrations corresponds to seven life-times in the decay of the fluorescence signal after a jump from pH 7 to the pH of the unfolding transitions. All data were collected at 25C in 100 mM KCl.
The buffer used for acid titrations monitored by fluorescence consisted of 5 mM MES, 5 mM HEPES, and 100 mM KCl. The titrant was 0.3 N HCl. The buffer for base titrations monitored by fluorescence was 5 mM HEPES with 100 mM KCl. Base titrations were performed with 0.3 N KOH. The base and acid titrations monitored by CD were performed in a buffer consisting of 100 mM KCl and 5 mM each of MES, HEPES, TAPS, CHES, and CAPS. CD scans at individual pH values were performed in 5 mM CHES. All buffers were obtained from Sigma (St. Louis, MO). The ex-periments monitoring intrinsic fluorescence and CD at 222 nm were per-formed with a protein concentration of 50 mg/ml. Experiments that monitored CD at 275 nm were performed with protein at a concentration of 500mg/ml.
The analysis of acid/base titrations to obtain the midpoints of the unfolding transitions (pHmid) or to describe the steepness of the transition (DnH1) was performed by nonlinear least-squares fit of two- or three-state unfolding models to the data. The equation used to describe a two-state process is aðpHÞ¼aN1mN3pH1ðaD1mD3pHÞ310 Dn H13ðpHmidpHÞ 1110DnH13ðpHmidpHÞ : (1) In this expression,aN,mN,aD, andmDare the intercept and slope of the native and denatured state baselines. The equation used to analyze the unfolding reactions in terms of a three-state process is
aðpHÞ ¼aN1mN3pH1aI10 Dn2 H13 pH 2 midpH ð Þ1ða D1mD3pHÞ310D n1 H13 pH 1 midpH ð Þ1Dn2 H13 pH 2 midpH ð Þ 1110Dn 2 H13 pH 2 midpH ð Þ110Dn1 H3 pH 1 midpH ð Þ1Dn2 H13 pH 2 midpH ð Þ : (2)
The valueaIis the intercept for the intermediate state, andDn1 H1,Dn2H1,
pH1
mid, andpH 2
midrepresent the protons bound or released and midpoints of
transitions for the primary (i.e., global unfolding) and the secondary (i.e., predenaturational) transitions.
Stability measurements by chemical denaturation
Protocols for the measurement of the Gibbs free energy of unfolding (DGo
H2O) of SNase have been published previously (24). TheDGoH2Ovalues
were obtained using GdnHCl as a denaturant (UltraPure grade, Invitrogen Life Technologies, Carlsbad, CA), after the changes in intrinsic fluorescence with an ATF-105 automated fluorometer (Aviv, Lakeland, NJ). Because the unfolding ofD1PHS and its variants is slower than the unfolding of the wild-type, 40–80 min were allowed for equilibration after each addition of denaturant in the transition region. Protein concentration in these ex-periments was 50mg/ml. The buffers varied according to the pH of the experiment. They consisted of 100 mM KCl with 25 mM each of sodium acetate for pH 4–5.5, MES for pH 5.5–6.5, HEPES for pH 7–8, TAPS for pH 8–9, CHES for pH 9–10, and CAPS for pH 10–11. At the higher pH values, it is difficult to regulate the pH during the titration because GdnHCl shifts the pKavalues of the buffer. The pH of the solutions at high pH drifted by as much as 0.1 pH units over the course of a titration. At the pH values where the GdnHCl titration curve did not reach a native state baseline, the fluorescence value obtained for the native state at other pH values was used to analyze the data to obtain the thermodynamic parameters. The pH of the samples was always checked at the end of each experiment. The final concentration of GdnHCl was also measured at the end of each experiment by refractometry (25). All data were collected at 25C in 100 mM KCl.
Potentiometric H1 titrations
The procedure for the measurement of H1titration curves of SNase with direct potentiometric methods has been presented elsewhere (1,24). The data were obtained with protein concentrations of 3–4 mg/ml. The protein and water samples were titrated with titrant of;0.15 N. Reversibility of the titration curves was tested routinely. All titration curves were measured in triplicate. All data were collected at 25C in 100 mM KCl. The data were treated by linear interpolation.
X-ray crystallography
PHS/V66D nuclease was crystallized by the hanging-drop vapor diffusion method at 4C at pH 6.0. The precipitating solution consisted of 33–36% (vol/vol) 2-methyl-2,4-pentanediol in 10% glycerol in 25 mM potassium phosphate buffer. The crystals that were used were obtained using a protein concentration of 9.4 mg/ml. Two milliequivalents of the inhibitor pdTp (39, 59thymidine bisphosphate) and two milliequivalents of CaCl2were also added to the protein solution before the drops were set. pdTp was syn-thesized in our laboratory (26). Crystals of PHS/V66D appeared in 1–2 weeks at 4C. Diffraction data were collected in the resolution range 20.0–2.0 A˚ with a single crystal at each temperature condition using an R-AXIS IV image plate detector (Rigaku, Danvers, MA). For the low-temperature structure, the crystal was mounted in a thin loop with the crystallization buffer as cryosolvent, and flash-frozen under a stream of nitrogen at 100 K. For the room-temperature structure, the crystal was mounted in a thin-walled glass capillary in equilibrium with the well solution. Crystals were found to be isomorphous to those of PHS/V66E (3) and this structure was used as an initial model. Refinement for both crystals was carried out using the programs CNS and O (27,28). The low-temperature structure was refined to a finalR-value of 20.75% andRfreeof 23.35%. The room-temperature structure was refined to a finalR-value of 19.59% and a finalRfreeof 22.17%. The electron density at the positions of the buried water molecules in the low temperature structure was very strong.
pKa calculations
The pKavalues were calculated with the method based on the finite difference solution of the linearized Poisson-Boltzmann equation, as described previ-ously (1,29,30). The method was adapted from Antosiewicz and co-workers (31–33). The University of Houston Brownian Dynamics package (34) was used to calculate electrostatic potentials. Polar hydrogen atoms were added to the protein in the neutral state with the HBUILD facility in CHARMm (Accelrys, San Diego, CA). The position of the hydrogen atoms was energy-minimized with 500 steps of steepest descent with CHARMm version 25.3, performed with all heavy atoms kept static. Hydrogen atoms were placed on OD2 of all Asp, and on the OE2 of all Glu. The tautomeric forms of His (Ne2 for His-8, Hd1 for His-46, He2 for His-121, and Nd1 for His-124) were selected from the best fit to the experimental pKavalues. Partial charges were taken from the CHARMm polar-hydrogen-only topology file version 21 (35) and atomic radii from the OPLS parameter set (36). A water-accessible surface calculated with a probe radius of 1.4 A˚ was used in all calculations. The Stern layer was set at 2.0 A˚ , the temperature was 298 K, the dielectric constant of water was 78.5, and the dielectric constant of the protein,ein, was variable, as noted. Grid dimensions for focusing were set to 403to reduce boundary effects near the buried charge. Calculations were performed to demonstrate that the results that are reported are independent of grid size. The cluster method of Gilson (37) was used to calculate ionization energies and mean charges. We have shown previously (1,29,30) that this method is appropriate for use with this protein; the pKavalues of histidines calculated with this method are in agreement with the values that have been measured experimentally.
In some calculations crystallographic water molecules were treated explicitly as TIP3 waters (38). Only the five water molecules closest to the carboxyl oxygen atoms of Asp-66 were treated explicitly. Water hydrogen atoms were added using the HBUILD facility of CHARMm (Accelrys). To explore the effects of water reorientation in response to ionization of the buried group, the positions of water hydrogen atoms were relaxed by minimization in the presence of the internal group in the charged state, and all other ionizable groups in the protein in the neutral state. In this step the hydrogen atoms of protein polar atoms were also minimized. A second minimization step fol-lowed in which hydrogen atoms attached to protein polar atoms were alfol-lowed to relax with Asp-66 in the neutral state and with the water molecules fixed in the positions that resulted from the first minimization. To investigate further the effects of water relaxation, additional conformations were obtained from minimization as described above, in which the water oxygen atoms were also allowed to reposition. All minimization procedures consisted of 500 steps of steepest descent with CHARMm Ver. 25.3. A more rigorous analysis of solvation by internal water molecules (39) was not attempted because the experimental data demonstrate convincingly that internal water molecules are not the dominant source of polarizability reported by Asp-66 in SNase.
RESULTS
The substitution of core positions in proteins with ionizable residues is destabilizing. For this reason, the V66D substi-tution was engineered in the hyperstable variant of SNase known as D1PHS, which is more than twice as stable as wild-type SNase at pH 7 and also highly resistant to dena-turation by acid or base (1,24). Use ofD1PHS maximized the range of pH over which the V66D protein could be studied. All equilibrium thermodynamic studies were per-formed with theD1PHS/V66D protein.
Acid/base titration monitored by intrinsic fluorescence and by near-UV CD
The acid-base titration ofD1PHS andD1PHS/V66D moni-tored by intrinsic fluorescence of Trp-140 is shown in Fig. 1.
The midpoints of the acid/base unfolding transitions (pHmid)
and the cooperativity (i.e., DnH1, the number of protons
(H1) bound or release upon unfolding) of the transitions obtained by fitting three-state models to these titration pro-files are listed in Table 1.
The pH dependence of the fluorescence signal of the two proteins was identical in the pH range 3.4–8.3. The V66D substitution is destabilizing, therefore the V66D variant is stable over a narrower range of pH than the background protein. The V66D protein remained folded at pH values as high as 10, and both its acid and base unfolding were highly cooperative. This is significant in the basic branch—it suggests that the V66D substitution perturbed neither the conformation of the protein nor the pKavalues of the Tyr and
Lys residues that govern the base unfolding reaction.
The acid/base titration of D1PHS and D1PHS/V66D monitored by near UV-CD at 275 nm, is shown in Fig. 2. The thermodynamic parameters obtained from these titration curves are listed in Table 1. The acid/base titration curves monitored by near UV-CD and by intrinsic fluorescence differed mainly in the predenaturational transition in the acid unfolding range, which is more pronounced in the CD data for both proteins. In contrast, the predenaturational transition in the basic branch for the D1PHS protein was more pro-nounced in the fluorescence-monitored titration. The origins of these predenaturational transitions are not well under-stood. The one in the acidic range might reflect changes near Trp-140, as it was present in both intrinsic fluorescence and near UV-CD. The one observed by fluorescence in the basic region likely reflects contributions from tyrosinate.
Despite the greater inherent scatter of the CD data, the overall titration behavior reported by both spectroscopic signals was comparable. The midpoints of the global and predenaturational unfolding transitions obtained from the two signals were within experimental error. Note that in the basic range of pH, where the destabilizing effects from the V66D substitution would be expected to be more sig-nificant, the titrations monitored by near-UV CD and by intrinsic fluorescence were coincident. The base unfolding of the V66D protein monitored by near-UV CD was highly cooperative. According to both near-UV CD and intrinsic fluorescence, the V66D protein was folded and nativelike at pH values as high as 9.7.
Local reorganization observed by far-UV CD when Asp-66 titrates
The acid/base titration of D1PHS and D1PHS/V66D monitored by far-UV CD at 222 nm is shown in Fig. 3. The thermodynamic parameters for acid and base unfolding obtained from these data are listed in Table 1. The main acid unfolding transition monitored by far-UV CD was as FIGURE 1 Acid/base titration ofD1PHS (s) andD1PHS/V66D (d)
monitored by changes in the intrinsic fluorescence of Trp-140. The line represents the fit of Eq. 1 or 2 to the data. All measurements at 298 K in 25 mM buffer, 100 mM KCl.
TABLE 1 Thermodynamic parameters from acid and base titrations
Fluorescence CD (275 nm) CD (222 nm) Val-66 Asp-66 Val-66 Asp-66 Val-66 Asp-66 Acid titrations pHmid* 2.15 (0.01) 2.90 (0.01) 2.20 (0.04) 2.94 (0.01) 2.14 (0.02) 2.91 (0.01) DnH1* 2.72 (0.14) 4.09 (0.11) 3.61 (0.92) 2.15 (0.01) 3.29 (0.28) 3.99 (0.23) pHmidy 4.15 (0.10) 4.28 (0.13) 5.75 (0.60) 5.35 (0.25) DnH1y 0.96 (0.14) 0.67 (0.09) 0.90 (0.70) 0.55 (0.10) Base titrations pHmid* 10.9 (0.10) 11.10 (0.40) 9.11 (0.15) DnH1* 0.66 (0.05) 0.76 (0.43) 1.09 (0.22) pHmidy 12.07 (0.02) 10.40 (0.03) 11.87 (0.01) 10.34 (0.02) 11.94 (0.03) 10.38 (0.03) DnH1y 2.26 (0.27) 4.6 (0.90) 2.70 (0.20) 4.34 (0.70) 3.13 (0.53)
These parameters were obtained by nonlinear least-squares fit with Eqs. 1 and 2. The valuepHmidrefers to the midpoint of a transition.DnH1refers to the cooperativity or to the number of H1bound or released during the conformational transition.
*Main, global unfolding.
cooperative as the one monitored by intrinsic fluorescence and by near-UV CD. ThepHmidandDnH1of the global
acid-unfolding transition monitored by near- and far-UV CD and by fluorescence were nearly identical. Excellent agreement was also found in the pHmid and DnH1 of the global
unfolding transitions in the basic range of pH obtained by the three different spectroscopic signals.
There is one notable feature in the titration monitored by far-UV CD that was not observed in fluorescence or near-UV CD monitored titrations. At pH 8.5 and above, the far-UV signal of the D1PHS/V66D protein begins to decrease relative to the D1PHS background protein. This predena-turational transition has a midpoint at pH 9.11 and a slope corresponding toDnH1of 1. H1-linked loss of far-UV CD
signal has never been observed in any of the variants of SNase with internal ionizable groups that have been studied previously.
Scans of the V66D protein in the far- and near-UV CD between pH 6.55 and 11.35 are shown in Fig. 4, a and b, respectively. In the pH range 6.55–9.93, the near-UV CD scans are almost pH-independent. At pH values above 10.4, the near-UV CD signal was comparable to the signal of the protein in 6 M GdnHCl, where it is known to be completely
FIGURE 2 Acid/base titration ofD1PHS (s) and D1PHS/V66D (n) monitored by near UV-CD signal measured at 275 nm. The line represents the fit of Eq. 1 or 2 to the data. All measurements at 298 K in 25 mM buffer, 100 mM KCl.
FIGURE 3 Acid/base titration ofD1PHS (s) and D1PHS/V66D (n) monitored by far UV-CD signal measured at 222 nm. The line represents the fit of Eq. 1 or 2 to the data. The inset shows the data forD1PHS/V66D represented as mean molar ellipticity per residue3103(deg cm2dmol1 res1). All measurements at 298 K in 25 mM buffer, 100 mM KCl.
FIGURE 4 pH dependence of the mean molar ellipticity per residue of D1PHS/V66D (A) in the far UV-CD region and (B) in the near UV-CD region. The lines are only meant to guide the eye. The spectra were collected at pH 6.55 (d), 7.85 (s), 8.58 (n), 9.01 (h), 9.43 (:), 9.93 (n), 10.36 (¤), 10.86 ()), and 11.35 (;) (note that this last pH is not shown inB). Also included for reference is the signal measured at pH 7 in 7 M GdnHCl (11111). All measurements at 298 K, 25 mM KCl.
denatured and unstructured (20,24,40–43). In contrast, the far-UV CD of the V66D protein was highly pH-sensitive. The signal decreased significantly with increasing pH between pH 6.55 and 11.35. However, even at pH 11.35, the signal did not reach the values obtained in high con-centrations of GdnHCl. The spectra in Fig. 4ashow that at pH 10, where the base-induced predenaturational transition of theD1PHS/V66D leveled off and the global unfolding transition began, the signal was ;12% lower in the V66D protein than in the background protein. If the far-UV CD signal at 222 nm reflected solely the a-helical content of the protein, this would correspond to the loss of at least 1.5 turns of a-helix in the V66D protein between pH 8.5 and 10.
pH dependence of stability
The stability (DGo
H2O) of the V66D variant was measured by GdnHCl denaturation monitored by changes in intrinsic fluorescence over the pH range 3–10.25 (Figs. 5 and 6). The thermodynamic parameters of unfolding obtained by anal-ysis with a two-state model are listed in Table 2. The midpoints of the unfolding transition (Cm) and the DGoH2O show that the stability of the V66D protein was highly pH-sensitive. The protein was most stable near pH 4. Below this pH value the stability of bothD1PHS andD1PHS/V66D decreased significantly, as expected from the known pH-dependence of stability of SNase (24). Them-values of the V66D protein (in Table 2) and ofD1PHS (data not shown) change at pH 4.5, suggesting that the character of either the
denatured or the native state or both changes at this pH. The
m-values .pH 4.5 were all similar despite the significant effects of the V66D substitution on the stability and pH-sensitivity of this protein. This suggests that the V66D substitution did not alter the conformation of the protein significantly.
Asp in water titrates with a pKavalue of;4.0 (44). At this
pH the V66D substitution destabilized the protein by 3.96 kcal/mol. This reflects primarily the cost of removing the Asp from water in the half-charged state, and burying it in the protein interior in the fully neutral state (see below). The
FIGURE 5 GdnHCl titrations ofD1PHS/V66D monitored by intrinsic fluorescence. Solid lines and open circles identify data from pH 10.5 to 4.5 in steps of 0.5 pH units (lefttoright). Dashed lines and solid circles refer to data from pH 3 to pH 4 (lefttoright). The lines represent fits to a two-state model of reversible denaturation. All measurements at 298 K, 100 mM KCl.
FIGURE 6 pH dependence of stability (DGo
H2O) measured by GdnHCl
denaturation monitored by changes in intrinsic fluorescence forD1PHS (s) andD1PHS/V66D (n) at 298 K in 100 mM KCl. The error bars shown are the errors of the fit for the individual denaturation experiments. Also shown is the difference in stability (DDGo
H2O) between these two proteins (n),
shifted arbitrarily along the ordinate for display purposes. The dashed line throughDDGo
H2Ois the fit with Eq. 3.
TABLE 2 Thermodynamic stability ofD1PHS/V66D determined by fluorescence-monitored GdnHCl titrations
pH DGo H2O(kcal/mol) Cm m 2.96 0.6360.14 0.22 2.9260.24 3.44 3.4160.04 0.80 4.2660.04 3.90 5.5260.12 1.11 4.9760.11 4.37 6.9660.08 1.29 5.4160.06 4.84 7.2660.12 1.26 5.7860.10 5.41 6.4860.14 1.16 5.5860.12 5.96 5.6960.15 1.03 5.5560.14 6.45 5.3460.12 0.95 5.6460.12 6.99 4.9360.04 0.83 5.9560.04 7.48 4.5060.04 0.77 5.8760.04 7.95 3.7160.04 0.61 6.0660.06 8.41 3.1860.08 0.54 5.8760.11 8.90 2.7760.13 0.44 6.2560.24 9.33 2.1460.09 0.37 5.7460.19 9.77 1.1860.26 0.23 5.2060.64 10.27 0.3660.07 0.06 5.7560.10
substitution of Val with neutral Asp was surprisingly inexpensive considering that it involves the transfer of two polar groups from water into the protein interior. It is;0.26 kcal/mol more expensive than the cost of introducing neutral Lys at this location (1) and 1.29 kcal/mol more expensive than the cost of introducing neutral Glu (3).
Elevated pKavalue of Asp-66
Fig. 6 illustrates the significant decrease in the stability of the V66D variant as a function of pH. The 5.2 kcal/mol values of stability are lost between pH 4.5 and pH 9.5. In this same range of pH, the stability of theD1PHS background remains unchanged. The difference in the stability between these two proteins (DDGo
H2O) over a wide range of pH is shown in Fig. 6. The slope of the linear portion of theDDGo
H2O versus pH curve was 1.1 kcal/mol, close to the theoretical value of 1.36 kcal/mol expected at 25C if the DDGoH2O resulted exclu-sively from an increase in the pKavalue of the Asp-66 in the
native state of the V66D protein relative to its value in the denatured state. The data were fully consistent with the presence of an acidic residue with a high pKavalue, much
higher than the normal pKa of 4.0 of Asp in water. This
dramatic shift in the pKa of an Asp is consistent with the
behavior expected from a carboxyl group that is fully sequestered from bulk water as a consequence of burial in the protein interior.
The pKaof Asp-66 in the native state was measured by
two different methods. First it was measured by fitting the
DDGo
H2O versus the pH curve in Fig. 6 with Eq. 3 (7): DDGoH 2OðpHÞ ¼DDG o H2O;mutRTln 1110ðpKDapHÞ 1110ðpKNapHÞ: (3) In this expression DDGo
H2O;mut accounts for the energetic consequences of the Val-to-Asp substitution that are inde-pendent of the shift in the pKavalue of the Asp carboxyl
group. The rightmost term reflects the difference in the pKa
value of Asp-66 in the native (pKaN) and in the denatured (pKaD) states of the V66D protein. The analysis with Eq. 3 assumes that the pKavalues of the other ionizable residues
are not affected by the V66D substitution. The pKN
a value of Asp-66 obtained by fitting with Eq. 3 was 8.73 (8.45, 9.03), which is 4.75 pKaunits higher than the
normal pKaof 4.0 of Asp in water. The pKDa value was 5.0 (4.7, 5.2), which is slightly higher than the normal pKaof
Asp in water. The pKD
a values of Glu-66, Lys-66, and Glu-92 are similarly shifted in a direction that favors the uncharged form. This could be rationalized in terms of native-like structure in the denatured state, but it is probably more likely that it reflects the enhanced pH sensitivity of the V66D protein and of the D1PHS background protein at the pH values where thepKDa values were determined.
The accuracy of the measured pKavalue of Asp-66 was
established by measuring it with a second, completely
different equilibrium thermodynamic method based on the measurement of H1 titration curves with direct potentio-metric methods (24). The accuracy and precision of poten-tiometric H1 titrations and their capacity to resolve the titration of an individual site have been demonstrated previously (1,3,24).
The H1 titration curve of D1PHS nuclease and of its V66D variant were measured independently. The data in Fig. 7 show that the H1 titration properties of D1PHS and its V66D variant were nearly identical at pH#8. At pH 8 the titration curves of these two proteins began to diverge. Protons were released preferentially from the V66D protein at pH.8. Between pH 8 and 9.5, the difference H1titration curve has the shape characteristic of a single-site isotherm, presumably reflecting the ionization of Asp-66. Above pH 9.5–10, the difference in H1release increased dramatically. This coincides with the onset of base unfolding in the base titrations monitored by changes in intrinsic fluorescence and in near- and far-UV CD, and it reflects excess H1binding by Lys and Tyr in the unfoldedD1PHS/V66D relative to the foldedD1PHS.
The difference titration curve (DnH1) in the inset of Fig. 7
suggests that the V66D substitution has no significant effect on the H1binding properties of nuclease at pH#8.5. This supports the validity of the use of Eq. 3 to measure the pKa
value of Asp-66 by linkage analysis of the pH dependence of stability, as well as use of the following modified Hill equation to extract the pKavalue of Asp-66 from theDnH1
versus pH data:
FIGURE 7 Potentiometric H1 titration of D1PHS (d) and D1PHS/ V66D (s) at 298 K in 100 mM KCl. The solid lines through the experimental data represent fits with linear interpolation. The solid line in the inset shows the difference between the interpolated curves for these two proteins, and the dotted line represents the fit with Eq. 4 with the amplitude of the titration fixed at 1.
DnH1¼m310
nðpHpKaÞ
1110nðpHpKaÞ: (4) In this function,mrepresents the amplitude of the transition (i.e., number of H1bound or released) andnis a coefficient that modifies the slope of the transition. The data at pH. 9.5, which reflect proton release by other groups owing to global unfolding, were not included in the fit so as not to bias the pKavalue toward a higher value. In the best fit, when
bothmandnwere not assigned fixed values, the pKavalue of
Asp-66 was 9.15 (9.13, 9.19),nwas 1.31 (1.24, 1.37), andm
was 1.40 (1.34, 1.46). Whennwas allowed to float and m
was fixed as 1, the pKavalue was 8.95 (8.92, 8.99) and when
bothmandnwere fixed at 1, it was 8.89 (8.79, 9.00). These pKavalues are in agreement with the pKaof 8.7 (8.45, 9.03)
obtained by analysis of the pH dependence of stability.
Effects of temperature on the patterns of internal hydration observed crystallographically
The V66D variant of the PHS hyperstable nuclease was used for the crystallographic studies because PHS nuclease crystallizes more readily and produces crystals of higher quality than D1PHS nuclease. The truncation and point mutations in theD1PHS protein that are not present in the PHS protein are far from position 66. It is assumed that the microenvironment of Asp-66 is equivalent in the PHS/V66D andD1PHS/V66D variants.
Structures solved at 298 K and 100 K at pH 6, where Asp-66 is neutral, are shown in Fig. 8. The neutral side chain of Asp-66 is buried in the interior of the protein. The structures at 298 K and 100 K were almost identical and superimpos-able. The carboxyl oxygen atoms of the Asp-66 side chain were in slightly different orientations in the two structures (Fig. 8b). They are related by a small rotation about the Cb -Cg bond. In the structure obtained at 100 K, the carboxyl oxygen atoms of Asp-66 are too far from the carbonyl oxygen of Thr-62 to establish a hydrogen bond. They are in a slightly less hydrophobic environment than in the structure obtained at 298 K. At low temperature, the OD1 atom is 4.09 A˚ from the carbonyl O of Thr-62, and 3.32 A˚ from the amide nitrogen of Asp-66. In the room temperature structure, the OD1 atom is surrounded by the hydrophobic side chains of Leu-14, Val-23, Met-65, Ile-72, Ile-92, Ala-94, and Val-99, and the nearest polar groups are.4.5 A˚ away. The OD2 atom is in a more polar environment, 2.71 A˚ from the carbonyl oxygen of Thr-62, and 3.54 A˚ from the backbone amide nitrogen of residue 66.
The main difference between the structures obtained at the two temperatures is a string of water molecules observed at 100 K, which was absent at 298 K. The internal water molecules are within hydrogen-bonding distance of the OD2 atom of Asp-66. They are connected directly with bulk water through the chain they make among themselves. They also interact with backbone carbonyl oxygen atoms. Some of
these internal water molecules have been observed previ-ously in structures with Glu-66 (3) or Glu-92 (6). As shown in Fig. 8c, three of the internal water molecules found in the cryogenic structure of Asp-66 are also present in the structures with Glu-66. However, there are several signifi-cant differences between the pattern of hydration observed for Glu-66 and Asp-66:
1. The internal water molecules observed with Glu-66, W1, W2, W3, and W4 (see Fig. 8 c) penetrate the protein through a single entry channel. In the case of Asp-66, two different channels are occupied by penetrating water molecules.
2. The two water molecules that hydrate the carboxyl group of Glu-66 (W1 and W2) make hydrogen bonds with the backbone to achieve a pentagonal hydrogen bonded array comparable to that seen for waters organized on the surfaces of proteins. In contrast, W5, the water that is hydrogen-bonded to the Asp-66 side chain, does not interact directly with the backbone. The pentagonal structures are absent in the V66D structure.
3. W2, W3, and W4 in the structure with Glu-66 are present in the structure with Asp-66, but the innermost water, W1, observed in the structure with Glu-66, was not observed in the structure with Asp-66. Presumably, the hydrogen bond between W1 and the carboxyl oxygen of Glu-66 is essential for the stability of this internal water molecule. In contrast, W5, W6, and W7 in the structure with Asp-66 are absent in the structure with Glu-66. In fact, these water molecules have never been seen previously in any of the structures of SNase.
DISCUSSION
The protein interior is not as effective a solvent as water. Therefore, internal ionizable groups usually titrate with pKa
values that are shifted, relative to the values measured in water, in the direction that favors the neutral form. This is illustrated clearly by the pKaof 8.9 of the internal Asp-66 in
SNase. TheDpKa5 relative to the pKavalue of 4.0 of Asp
in water is equivalent to;7 kcal/mol at 298 K. Despite this being a large shift in pKa, it reflects relatively high apparent
polarizability in this location in the interior of SNase. The shift would have been much greater if the protein interior behaved as a material with a dielectric constant of 4, as is commonly assumed in continuum representations of proteins (14,31,32,44–49). Understanding the structural and physical origins of the high apparent polarizability reported by internal groups in proteins is central to understanding the structural factors that govern catalysis and other biochemical processes where charge separation or charge transfer is involved.
To interpret pKa values in terms of apparent protein
dielectric constants (eapp), it is necessary to perform reverse
function of the protein dielectric constant,ein, to identify the
values ofeinthat reproduce the experimental pKavalue. We
define eapp as the value of ein that reproduces the
experi-mental pKavalue. It is important to emphasize thateappdoes
not represent the true dielectric constant of the protein. It is simply the coefficient necessary to reproduce a specific experimental quantity with a specific model. The value ofein
itself is not universal, nor does it represent the true dielectric constant of the protein. It is a parameter meant to reproduce, implicitly, the contributions to the dielectric response that are not treated explicitly in a model (2). Not only isein
model-dependent, it is also likely that different values ofeinwill be
necessary to calculate the different type of energetic con-tributions to pKavalues (2). This remains to be established
experimentally.
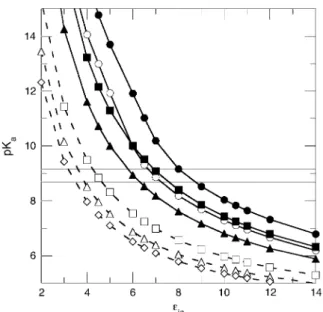
The data in Fig. 9 illustrate how the pKavalue of Asp-66
was interpreted in terms of apparent dielectric constants. The pKavalues in this figure were calculated with static structures
using a continuum method based on the solution of the linearized Poisson-Boltzmann by the method of finite differences (50,51). In these methods the protein is treated with the dielectric constant ein, and permanent dipoles are
treated explicitly with partial charges (52,53). The pKa
values are determined by three energy terms:
1. Coulomb interactions with other charged groups (54); 2. Interactions with the background of charges from
permanent dipoles (55); and
3. Born energies related to differences in the reaction field energies of a charged group in water and in the protein (56). FIGURE 8 (A) Stereo representation of the crystallo-graphic structure of PHS/V66D obtained at 100 K. The side chain of Asp-66 is shown in red and the site-bound water molecules near Asp-66 are represented as light-blue spheres. The Trp-140 responsible for the intrinsic fluores-cence in the neutral range of pH is shown in blue, and the Tyr residues that might contribute to the pH dependence of fluorescence at high pH are shown in green. (B) Stereo representation of a closeup of the network of hydrogen bonds between the backbone, the side chain of Asp-66, and the five structural water molecules nearest to it. The side chain of Asp-66 in the 100 K structure (purple oxygen atoms) and in the room-temperature structure (red oxygen atoms) are shown. (C) Superposition of structures with Glu, Lys, and Asp at position 66 to compare the conformation of this side chain. The ionizable moieties are color-coded: Lys (purple), Glu (green), and Asp (blue). Water molecules from the structure with Asp-66 are shown as blue spheres. The green spheres identify the waters seen in the structure with Glu-66. Connelly-surface calculated for the 100 K structure (D) and for the room temperature (E) structures with a probe of 1.4 A˚ . The water molecules observed in the 100 K are shown in the room-temperature structure for purposes of comparison.
The combined effects of the background and Born energies constitute the self-energy.
Previously we have shown experimentally that Coulomb interactions between the internal Lys-66 and surface-ioniz-able groups are weak; the pKa of Lys-66 is insensitive to
the loss of charges on the surface, and the pKa of surface
histidines that titrate in the same range as Lys-66 are insensitive to the ionization of the internal Lys-66 (1). It is well known that Coulomb interactions are exaggerated in finite difference calculations with static structures using low values of ein. For this reason, we routinely explore the
dependence ofeappvalues on the different types of energy
terms used in the calculations (1). When the Coulomb, Born, and background energies were used in the calculations, the experimental pKaof Asp-66 was reproduced wheneinwas in
the range 7.0–8.4. When only the Born term was used, a value of ein¼7.2 was necessary to reproduce the
experi-mental pKavalue. The valueein¼6.0 was needed when the
full self-energy, consisting of Born and background terms, was used. Values ofeinin the range 6–8 are low relative to
the dielectric constant of water, but they still represent a substantial dielectric response, comparable to that of a very polarizable material. Regardless of how the pKacalculations
were performed, they all showed that the shift in the pKa
value of Asp-66 is governed by the loss of hydration of the carboxylic group in the buried state that is not offset by interactions with charges or with polar atoms of the protein. Calculations were also performed in which the water molecules that were observed in the crystal structures ob-tained at 100 K were treated explicitly, instead of accounting for their presence in terms of a dielectric continuum. In these calculations the position and orientation of the water mole-cules was energy-minimized with the carboxyl group of Asp-66 in the charged state. The value of ein needed to
reproduce the experimental pKavalues in these calculations
decreased, as expected when the amount of microscopic detail treated explicitly in a continuum calculation increases (2). When the innermost water molecule (W5 in Fig. 8 c) was included explicitly in the calculation, the experimental pKavalue of Asp-66 was reproduced with the self-energy
evaluated at ein ¼ 4.4. It is well known that ein 4
exaggerates Coulomb interactions between the internal and surface ionizable groups. For this reason, the Coulomb term was turned off in these calculations. When the two closest water molecules were used (W5 and W6, or W5 and W2), the experimental pKawas reproduced whenein¼3.7. When the
three closest water molecules were treated explicitly (W2, W3, W5, and W6), a value ofein ¼3.3 was needed. The
calculations demonstrate unequivocally that, when the internal water molecules near Asp-66 are allowed to reorient in response to the ionization of this group, they can stabilize the internal Asp-66 in its charged state.
The equilibrium dielectric constants measured experimen-tally with polymeric amides, such as nylon, and with dry protein and peptide powders, are in the range 3.3–4.4. They are lower still in the high frequency limit (57,58). These values are consistent with estimates of the protein dielectric constants calculated from first principles (46), but lower than the estimates of the dielectric effect originating from dipole fluctuations near a charged group (59,60). Protein dielectric constants in this range are thought to reflect both electronic polarization and some degree of nuclear relaxation (i.e., discrete oscillations and reorganization of dipoles). The low values of ein necessary to reproduce the experimental pKa
value of Asp-66 suggests that the internal water molecules observed in the low temperature structure of the V66D variant could contribute significantly to the high apparent polarizability reported by Asp-66. The matter is complicated by the fact that the internal water molecules are not observed in the structure of the V66D protein obtained at room temperature. In fact, with the exception of one internal water molecule observed in the room temperature of the structure with Glu-66, the internal water molecules that are observed in cryogenic structures of SNase with internal ionizable groups are not observed in structures obtained at room temperature (6,11). Furthermore, in the case of the V66E variant, which has more internal water molecules than the V66D variant at 100 K, the shift in the pKavalue of Glu-66
FIGURE 9 pKa values calculated with the finite-difference Poisson-Boltzmann continuum method as a function of the protein dielectric constant (ein) with (dashed line) or without (solid line) explicit treatment of the internal water molecules observed in the structure obtained at 100 K. The horizontal lines describe the range of pKavalues measured experimentally for Asp-66. The different calculations described by these data are: (d) all energy terms, room-temperature structure; (s) all energy terms, 100 K structure; (n) Born term only, room-temperature structure; (:) self-energy term (Born and background) only, room-temperature structure; (h) self-energy term only, 100 K structure, W5 included explicitly; (n) self-energy term only, low temperature structure, W5 and W6 included explicitly; and ()) self-energy term only, low-temperature structure, W2, W3, W5, and W6 included explicitly.
could not be rationalized solely in terms of the internal water molecules.
The factors that determine the temperature-dependence in the observed patterns of hydration in the hydrophobic core of proteins are not obvious. In the specific case of the V66D protein, the absence of observable internal water molecules in the room temperature structure could be related to a constriction at this temperature in the channel that connects bulk solvent with the internal microcavity where the Asp-66 side chain resides (Fig. 8, D and E). As expected, the temperature factors at 298 K are higher than at 100 K (61–63); in a 5 A˚ sphere surrounding the ionizable moiety of Asp-66, the median B factor is 19.86 in the low temperature structure and 27.21 in the room temperature structure. The high temperature factors suggest that disorder might be the reason that the internal water molecules are more difficult to detect crystallographically at higher temperatures. The presence of internal water molecules in structures obtained at 100 K could also represent an artifact of the flash-freezing used to protect crystals (64).
The internal water molecules may be present at room temperature in the internal microcavity near Asp-66, albeit in a disorganized state. This would be the situation if the thermal energy of the water molecules were higher than the energy of their hydrogen-bonding interactions in the internal locations. A flat binding surface near Asp-66 with multiple binding minima would also render the internal water molecules invisible in the crystallographic experiment. This would also be consistent with magnetic relaxation dispersion studies of variants with Lys-66 and Glu-66, which failed to detect internal water molecules at room temperature (11). What is clear is that the patterns of internal hydration observed crystallographically are highly sensitive to the temperature at which the diffraction data are collected. Caution should be exercised when interpreting details of internal water molecules, or the lack thereof, at active sites, cavities, and other internal locations in proteins.
Regardless of what the contributions by internal water molecules to the high apparent polarizability reported by Asp-66 might be, they are eclipsed by incontrovertible evidence of local conformational reorganization coincident with the ionization of Asp-66. If the conformational changes reported by far UV-CD reflected solely the loss ofa-helical structure, the data would be consistent with at least 1.5 turns ofa-helix becoming disorganized upon ionization of Asp-66. Because there is no evidence of conformational reorga-nization in the near UV CD or in the intrinsic fluorescence signal, and because Asp-66 is located near the C-terminus of a helix, where fraying is possible, we suspect that the conformational reorganization monitored by far UV CD reflects the loss of a small segment of the helix where Asp-66 resides. Unwinding of one turn of this a-helix would be sufficient to expose the charged form of Asp-66 to bulk water. A recent free energy perturbation simulation with a novel and ingenious overcharging procedure, suggests that a
relatively modest conformational rearrangement in this helix is sufficient to allow the side chain of Glu-66 to gain access to bulk water (13).
The direct observation of a conformational transition linked to the ionization of Asp-66 has several implications. It suggests that internal water molecules are not as significant a source of polarizability in the protein interior as hypothe-sized previously based on low temperature crystal structures (1,3). The internal water molecules that might hydrate the carboxylic moiety are not as effective as bulk water in hydrating the charged form of Asp-66 in its buried location. The protein also seems to be unable to solvate Asp-66 when its side chain is buried in the charged state in this highly hydrophobic region of SNase. Studies with NMR spectros-copy are underway to describe in detail the character and amplitude of the subtle, local conformational reorganization triggered by ionization of this internal Asp residue.
The spectroscopic observation of local conformational reorganization linked to the ionization of Asp-66 is partic-ularly significant in one important respect: it explains the structural basis behind the high protein dielectric constants needed to reproduce the pKavalue of Asp-66 in continuum
calculations with static structures. The dielectric constant reported by Asp-66 is high because the dielectric constant has to capture the energetic consequences of the local conformational reorganization associated with the ionization of Asp-66. These conformational rearrangements are not treated explicitly in calculations with static structures; therefore, they need to be treated implicitly with high dielectric constants. The pKavalues of Glu-66 and Lys-66 in
SNase are reproduced with similarly high protein dielectric constants of ein 10. We suspect that these apparent
dielectric constants are high because they also have to account for local conformational reorganization concomitant with the ionization of these groups, although in the case of these groups, optical spectroscopic methods have been unable to detect these changes.
Local conformational changes coupled to ionization reactions of internal residues are central to many key biochemical processes in energy transduction, such as the conversion of light into mechanical energy by the photo-active yellow protein (65), the coupling of H1gradients and the synthesis of ATP (66), the establishment of proton gradients by proteins such as bacteriorhodopsin (67–70), and H1transport in general (39). To elucidate the structural and physical origins of these important biochemical processes in detail, it is necessary to understand the coupling between ionization of internal residues and local conformational reorganization and fluctuations. Structure-based calculations of pKa values and electrostatic energies in proteins will be
essential for this purpose, but they will not be useful until the methods are capable of treating the coupling between the ionization of internal residues and conformational reorgani-zation rigorously. A variety of computational approaches have been proposed and are being used to study this problem
(12–19). The V66D variant of SNase constitutes an ideal model system for further development and benchmarking of computational methods that treat pH-linked local confor-mational reorganization and fluctuations rigorously and explicitly.
The authors are indebted to Prof. Maurice Bessman at Johns Hopkins for his invaluable help in the synthesis of pdTp.
This work was supported by a grant to B.G.M.E. from the National Institutes of Health (grant No. GM-061597). D.A.K. and M.R.S. were supported by predoctoral and REU fellowships, respectively, from the National Science Foundation.
REFERENCES
1. Fitch, C. A., D. A. Karp, K. K. Lee, W. E. Stites, E. E. Lattman, and B. Garcı´a-Moreno E. 2002. Experimental pKa values of buried residues: analysis with continuum methods and role of water penetration. Bio-phys. J.82:3289–3304.
2. Schutz, C. N., and A. Warshel. 2001. What are the dielectric ‘‘constants’’ of proteins and how to validate electrostatic models? Proteins Struct. Funct. Gen.44:400–417.
3. Dwyer, J., A. Gittis, D. A. Karp, E. E. Lattman, D. Spencer, W. Stites, and B. Garcı´a-Moreno E. 2000. High apparent dielectric constants in the interior of a protein reflect water penetration.Biophys. J.79:1610– 1620.
4. Garcı´a-Moreno E., B., J. Dwyer, A. Gittis, E. E. Lattman, D. Spencer, and W. Stites. 1997. Experimental measurement of the effective dielectric in the hydrophobic core of a protein.Biophys. Chem.64: 211–224.
5. Dao-pin, S., D. E. Anderson, W. A. Baase, F. W. Dahlquist, and B. W. Matthews. 1991. Structural and thermodynamic consequences of burying a charged residue within the hydrophobic core of T4 lysozyme. Biochemistry.30:11521–11529.
6. Nguyen, D. M., R. L. Reynald, A. G. Gittis, and E. E. Lattman. 2004. X-ray and thermodynamic studies of staphylococcal nuclease variants I92E and I92K: insights into polarity of the protein interior.J. Mol. Biol.341:565–574.
7. Stites, W. E., A. G. Gittis, E. E. Lattman, and D. Shortle. 1991. In a staphylococcal nuclease mutant the side-chain of a lysine replacing Valine 66 is fully buried in the hydrophobic core.J. Mol. Biol.221: 7–14.
8. Langen, R., G. M. Jensen, U. Jacob, P. J. Stephens, and A. Warshel. 1992. Protein control of iron-sulfur cluster redox potentials.J. Biol. Chem.267:25625–25627.
9. Warshel, A., and S. Russell. 1986. Theoretical calculations of structure and energetics in the catalytic reaction of trypsin.J. Am. Chem. Soc. 108:6569–6579.
10. Damjanovic, A., B. Garcı´a-Moreno E., E. E. Lattman, and A. E. Garcı´a. 2005. Molecular dynamics study of water penetration in staphylococcal nuclease. Proteins Struct. Funct. Bioinform. 60: 433–449.
11. Denisov, V. P., J. L. Schlessman, B. Garcı´a-Moreno E., and B. Halle. 2004. Stabilization of internal charges in a protein: water penetration or conformational change?Biophys. J.87:3982–3994.
12. Khandogin, J., and C. L. Brooks III. 2006. Towards the accurate first-principles prediction of ionization equilibria in proteins.Biochemistry. 45:9363–9373.
13. Kato, M., and A. Warshel. 2006. Using a charging coordinate in studies of ionization induced partial unfolding.J. Phys. Chem. B.110:11566– 11579.
14. Alexov, E. G., and M. R. Gunner. 1997. Incorporating protein con-formational flexibility into the calculation of pH-dependent protein properties.Biophys. J.74:2075–2093.
15. Alexov, E. 2003. Role of the protein side-chain fluctuations on the strength of pair-wise electrostatic interactions: comparing experimental with computed pKas.Proteins Struct. Funct. Gen.50:94–103. 16. Georgescu, R. E., E. G. Alexov, and M. R. Gunner. 2002. Combining
conformational flexibility and continuum electrostatics for calculating pKas in proteins.Biophys. J.83:1731–1748.
17. Kuhn, B., P. A. Kollman, and M. Stahl. 2004. Prediction of pKashifts in proteins using a combination of molecular mechanical and con-tinuum solvent calculations.J. Comput. Chem.25:1865–1872. 18. Koumanov, A., A. Karshikoff, E. P. Friis, and T. V. Borchert. 2001.
Conformational average in pKacalculations: improvement and limita-tions in prediction of ionization properties of proteins.J. Phys. Chem. B.105:9339–9344.
19. Khandogin, J., and C. L. Brooks III. 2005. Constant pH molecular dynamics with proton tautomerism.Biophys. J.89:141–157. 20. Shortle, D., and A. Meeker. 1986. Mutant forms of staphylococcal
nuclease with altered patterns of guanidine hydrochloride and urea denaturation.Proteins Struct. Funct. Gen.1:81–89.
21. Byrne, M., R. Manuel, L. Lowe, and W. Stites. 1995. Energetic contribution of side chain hydrogen bonding to the stability of staphylococcal nuclease.Biochemistry.34:13949–13960.
22. Pace, C., F. Vajdos, L. Fee, G. Grimsley, and T. Gray. 1995. How to measure and predict the molar absorption coefficient of a protein. Protein Sci.4:2411–2423.
23. Gill, S. C., and P. H. Von Hippel. 1989. Calculation of protein extinction coefficients from amino acid sequences. Anal. Biochem. 182:319–326.
24. Whitten, S. T., and B. Garcı´a-Moreno E. 2000. pH dependence of stability of staphylococcal nuclease: evidence of substantial electrostatic interactions in the denatured state.Biochemistry.39:14292–14304. 25. Pace, C. 1986. Determination and analysis of urea and guanidine
hydrochloride denaturation curves.Methods Enzymol.131:266–280. 26. Tener, G. M. 1961. 2-cyanoethyl phosphate and its use in synthesis of
phosphate esters.J. Am. Chem. Soc.83:159–168.
27. Brunger, A., P. Adams, G. Clore, W. DeLano, P. Gros, R. Grosse-Kunstleve, J. Jiang, J. Kuszewski, M. Nilges, N. Pannu, R. Read, L. Rice, T. Simonson, and G. Warren. 1998. Crystallography and NMR system: a new software suite for macromolecular structure determina-tion.Acta Crystallogr. D Biol. Crystallogr.54:905–921.
28. Jones, T. A., J. Y. Zou, S. W. Cowan, and M. Kjeldgaard. 1991. Improved methods for building protein models in electron density maps and the location of errors in these models.Acta Crystallogr. A. 47:110–119.
29. Lee, K. K., C. A. Fitch, and B. Garcı´a-Moreno E. 2002. Distance dependence and salt sensitivity of pairwise Coulombic interactions in a protein.Protein Sci.11:1004–1016.
30. Lee, K. K., C. A. Fitch, J. T. J. Lecomte, and B. Garcı´a-Moreno E. 2002. Electrostatic effects in highly charged proteins: salt sensitivity of pKa values of histidines in staphylococcal nuclease. Biochemistry. 41:5656–5667.
31. Antosiewicz, J., J. A. McCammon, and M. K. Gilson. 1994. Prediction of pH-dependent properties of proteins.J. Mol. Biol.238:415–436. 32. Antosiewicz, J., J. A. McCammon, and M. K. Gilson. 1996. The
determinants of pKas in proteins.Biochemistry.35:7819–7833. 33. Antosiewicz, J., J. M. Briggs, A. H. Elcock, M. K. Gilson, and J. A.
McCammon. 1996. Computing ionization states of proteins with a detailed charge model.J. Comput. Chem.17:1633–1644.
34. Davis, M. E., J. D. Madura, B. A. Luty, and J. A. McCammon. 1991. Electrostatics and diffusion of molecules in solution—simulations with the University of Houston Brownian Dynamics program. Comput. Phys. Commun.62:187–197.
35. Neria, E., S. Fischer, and M. Karplus. 1996. Simulation of activation free energies in molecular systems.J. Chem. Phys.105:1902–1921. 36. Jorgensen, W. L., and J. Tirado-Rives. 1988. The OPLS potential
functions for proteins. Energy minimizations for crystals of cyclic peptides and crambin.J. Am. Chem. Soc.110:1657–1666.
37. Gilson, M. K. 1993. Multiple-site titration and molecular modeling: two rapid methods for computing energies and forces for ionizable groups in proteins.Proteins Struct. Funct. Gen.15:266–282. 38. Jorgensen, W. L., J. Chandrasekhar, J. D. Madura, R. W. Impey, and
M. L. Klein. 1983. Comparison of simple potential functions for simulating liquid water.J. Chem. Phys.79:926–935.
39. Burykin, A., and A. Warshel. 2004. On the origin of the electrostatic barrier for proton transport in aquaporin.FEBS Lett.570:41–46. 40. Meeker, A. K., B. Garcı´a-Moreno E., and D. Shortle. 1996.
Contri-butions of the ionizable amino acids to the stability of staphylococcal nuclease.Biochemistry.35:6443–6449.
41. Shortle, D., W. E. Stites, and A. K. Meeker. 1990. Contributions of the large hydrophobic amino acids to the stability of staphylococcal nuclease.Biochemistry.29:8033–8041.
42. Shortle, D., and A. K. Meeker. 1989. Residual structure in large fragments of staphylococcal nuclease: effects of amino acid substitu-tions.Biochemistry.28:936–944.
43. Green, S. M., A. K. Meeker, and D. Shortle. 1992. Contributions of the polar, uncharged amino acids to the stability of staphylococcal nuclease: evidence for mutational effects on the free energy of the denatured state.Biochemistry.31:5717–5728.
44. Matthew, J. B., F. R. N. Gurd, B. Garcı´a-Moreno E., M. A. Flanagan, K. L. March, and S. J. Shire. 1985. pH-dependent properties in proteins.CRC Crit. Rev. Biochem.18:191–197.
45. Tanford, C., and J. G. Kirkwood. 1957. Theory of protein titration curves. I. General equations for impenetrable spheres.J. Am. Chem. Soc.79:5333–5339.
46. Gilson, M. K., and B. H. Honig. 1986. The dielectric constant of a folded protein.Biopolymers.25:2097–2119.
47. Bashford, D., and M. Karplus. 1990. pKas of ionizable groups in proteins: atomic detail from a continuum electrostatic model. Bio-chemistry.29:10219–10225.
48. Yang, A.-S., and B. Honig. 1993. On the pH dependence of protein stability.J. Mol. Biol.231:459–474.
49. Yang, A.-S., M. R. Gunner, R. Sampogna, K. Sharp, and B. Honig. 1993. On the calculation of pKas in proteins.Proteins Struct. Funct. Gen.15:252–265.
50. Klapper, I., R. Hagstrom, R. Fine, K. Sharp, and B. Honig. 1986. Focusing of electric fields in the active site of Cu-Zn superoxide dismutase: effects of ionic strength and amino-acid modification. Proteins Struct. Funct. Gen.1:47–59.
51. Rogers, N. K., and M. J. E. Sternberg. 1984. Electrostatic interactions in globular proteins. Different dielectric models applied to the packing ofa-helices.J. Mol. Biol.174:527–542.
52. Warshel, A., and M. Levitt. 1976. Theoretical studies of enzymic reactions—dielectric, electrostatic and steric stabilization of carbo-nium-ion in reaction of lysozyme.J. Mol. Biol.103:227–249. 53. Warshel, A., and S. T. Russell. 1984. Calculations of electrostatic
interactions in biological systems and in solutions.Q. Rev. Biophys. 17:283–422.
54. Linderstrøm-Lang, K. 1924. The ionization of proteins.C. R. Trav. Lab. Carlsberg.15:7.
55. Warshel, A. 1978. Energetics of enzyme catalysis.Proc. Natl. Acad. Sci. USA.75:5250–5254.
56. Warshel, A., S. T. Russell, and A. K. Churg. 1984. Macroscopic models for studies of electrostatic interactions in proteins—limitations and applicability.Proc. Natl. Acad. Sci. USA.81:4785–4789. 57. Harvey, S. C., and P. Hoekstra. 1972. Dielectric relaxation spectra of
water adsorbed on lysozyme.J. Phys. Chem.76:2987–2994. 58. Pethig, R. 1979. Dielectric and Electronic Properties of Biological
Materials. John Wiley and Sons, Chichester, UK.
59. King, G., F. S. Lee, and A. Warshel. 1991. Microscopic simulations of macroscopic dielectric constants of solvated proteins.J. Chem. Phys. 95:4366–4377.
60. Sham, Y. Y., Z. T. Chu, and A. Warshel. 1997. Consistent calculations of pKas of ionizable residues in proteins: semi-microscopic and microscopic approaches.J. Phys. Chem. B.101:4458–4472. 61. Fraunfelder, H., G. A. Petsko, and D. Tsernoglou. 1979.
Temperature-dependent x-ray diffraction as a probe of protein dynamics.Nature. 280:558–563.
62. Tilton, R. F. J., J. C. Dewan, and G. A. Petsko. 1992. Effects of temperature on protein structure and dynamics: x-ray crystallographic studies on the protein ribonuclease-A at nine different temperatures from 98 to 320 K.Biochemistry.31:2469–2481.
63. Quillin, M. L., W. A. Breyer, I. J. Griswold, and B. W. Mathews. 2000. Size vs. polarizability in protein-ligand interactions: binding of noble gases within engineered cavities in T4 lysozyme.J. Mol. Biol.302: 955–977.
64. Halle, B. 2004. Biomolecular cryocrystallography: structural changes during flash-cooling.Proc. Natl. Acad. Sci. USA.101:4793–4798. 65. Hendricks, J., W. D. Hoff, W. Crielaard, and K. J. Hellingwerf. 1999.
Protonation/deprotonation reactions triggered by photoactivation of photoactive yellow protein fromEctothiorhodospira halophila.J. Biol. Chem.274:17655–17660.
66. Raslogi, V. K., and M. E. Girvin. 1999. Structural changes linked to proton translocation by subunit c of the ATPase synthase. Nature. 402:263–268.
67. Luecke, H. 2000. Atomic resolution structures of bacteriorhodopsin photocycle intermediates: the role of discrete water molecules in the function of this light-driven ion pump.Biochim. Biophys. Acta.1460: 133–156.
68. Luecke, H., B. Schobert, H. T. Richter, J. P. Cartailler, and J. K. Lanyi. 1999. Structural changes in bacteriorhodopsin during ion transport at 2 A˚ ngstro¨m resolution.Science.286:255–260.
69. Luecke, H., B. Schobert, H. T. Richter, J. P. Cartailler, and J. K. Lanyi. 1999. Structure of bacteriorhodopsin at 1.55 A˚ resolution.J. Mol. Biol. 291:899–911.
70. Shurki, A., M. Strajbl, C. N. Schutz, and A. Warshel. 2004. Electrostatic basis for bioenergetics. Methods Enzymol. 380: 52–84.