C OV E R S TO R Y
By Marc J. Epstein and F. Warren McFarlan
Measuring the
Efficiency and
Effectiveness of
a
Nonprofit’s
Performance
N
onprofit organizations devote signif-icant effort to measuring perfor-mance that’s often focused on financial metrics related to dollars raised from donors and budget achievement. Although these mea-surements are certainly important, measuring organizational success must focus primarily on achieving their mission. But we know that, just as with for-profit organizations, these nonfinancial measures of success are often less precise and far more difficult to measure. The relevancy, though, is obvious and the task critical. In the March 2011 issue of Strategic Finance, we described some key differences between governance of for-profit and nonprofit organizations, which we dis-cussed in our new book, Joining a Nonprofit Board: WhatYou Need to Know. In this article, we describe the critical
importance of including both financial and nonfinancial measures to evaluate nonprofit organizations.
Without financial resources, there’s no mission. Con-versely, all of the financial resources in the world are
irrelevant if the company isn’t focused on a well-thought-out mission. For this reason, it’s important for nonprofit organizations to constantly measure performance related to both their financial efficiency and their effectiveness in meeting organizational goals. Financial efficiency calls for the company to develop, implement, and oversee a coher-ent financial strategy to which organizations devote sig-nificant effort. To measure its effectiveness, a nonprofit must ask itself, “Are we really delivering on our mission, not just meeting budget, and are we getting maximum impact from our expenditures?” These questions lie at the heart of nonprofit governance. Although the definition of mission and implementation are critical, current practice in performance measurement against an organization’s mission has often been weak.
Performance Metrics
The purpose of a nonprofit is to improve the lives of individuals, members, organizations, communities, and society as a whole. Some organizations, such as charities, may be considered purely social-impact-focused, whereas others, such as professional organizations, may be viewed
primarily as member-focused. But classifying nonprofit organizations isn’t easy as some have elements of both. For this reason, you should envision a continuum of not-for-profit organizations spanning from purely socially focused to member-focused organizations, with numer-ous nonprofit organizations having dual roles of serving both their members and society.
To develop performance metrics, we begin by grouping the organization’s resource-gathering and -disbursing activities into five clusters: inputs, activities, outputs, out-comes, and impacts.
Inputs: Inputs are the key tangibles and intangibles
that enable the nonprofit to perform its tasks. They include cash, personnel, equipment, and other material items as well as the mission statement and strategy. You should have a keen understanding of others that provide service similar to yours and how you stack up against them. Finally, inputs include the current depth and breadth of your board’s and staff ’s understanding of the organization’s mission and strategy.
Activities:Activities are all the specific programs and
tasks that the organization undertakes, and they should be grouped into meaningful but flexible clusters for analysis. These groupings help trigger intense debate about the appropriate balance within the group and can lead to a number of adjustments between board and staff.
Outputs:Outputs are the tangible and intangible
products and services that are the result of the organiza-tion’s activities. The selection of these specific outputs for any institution would vary by its mission, core competen-cies, and strategy inputs. When the world changes, these measured outputs may no longer be exactly the right ones to focus on and may need to be modified.
Outcomes: Outcomes are the specific changes in
behaviors and individuals affected by the delivery of these services and products.
Impacts:The impacts include benefits to
communi-ties and society as a whole as a result of the nonprofit’s outcomes.
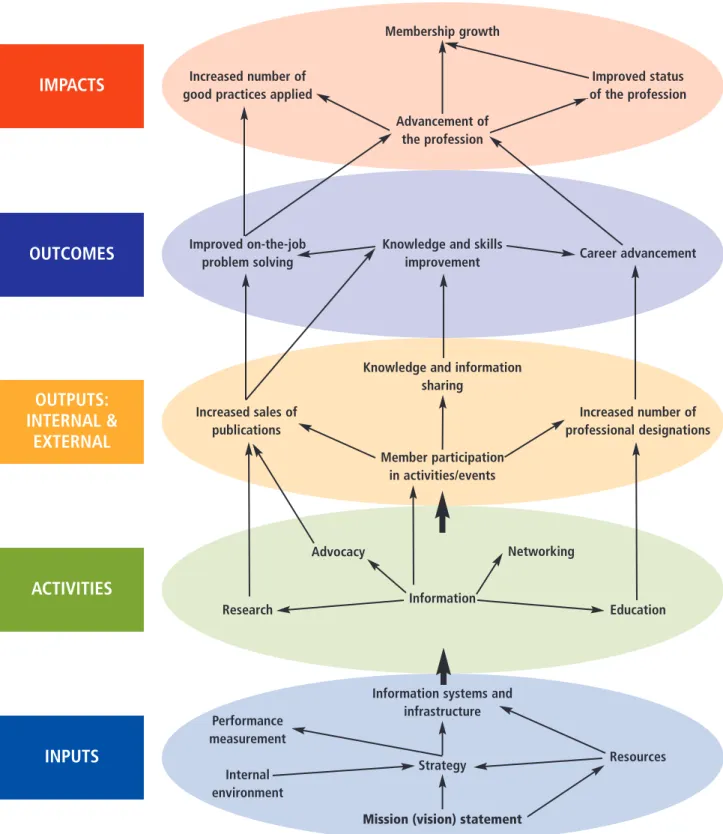
Breaking the organization into these pieces and analyz-ing it in parts allows for the development of a number of performance metrics that, in aggregate, give insight into how the organization is performing against mission. A “Causal Linkage Map” links the key components of resource acquisition and an impact chart for a profes-sional association (see Figure 1).
Figure 1 shows the processes that impact the members of a professional organization. As shown, inputs, such as the internal environment and available resources, help
C OV E R S TO R Y
Membership growth
Advancement of the profession Increased number of
good practices applied
Improved status of the profession
Knowledge and skills improvement Improved on-the-job
problem solving Career advancement
Knowledge and information sharing Member participation in activities/events Increased sales of publications Increased number of professional designations Information Research Education
Information systems and infrastructure
Strategy
Mission (vision) statement
Performance measurement Internal environment Resources Advocacy Networking
IMPACTS
OUTCOMES
OUTPUTS:
INTERNAL &
EXTERNAL
ACTIVITIES
Figure 1:
Causal Linkage Map of Impact Drivers for a Professional Association
INPUTS
define the strategy that can be implemented to fulfill the mission statement. This strategy then determines the activities that the association wants to carry out. The results, or outputs, of these activities then translate into outcomes for association members, such as career advancement. Finally, you can measure the impact of an association based on its growth and the increased promi-nence of its members.
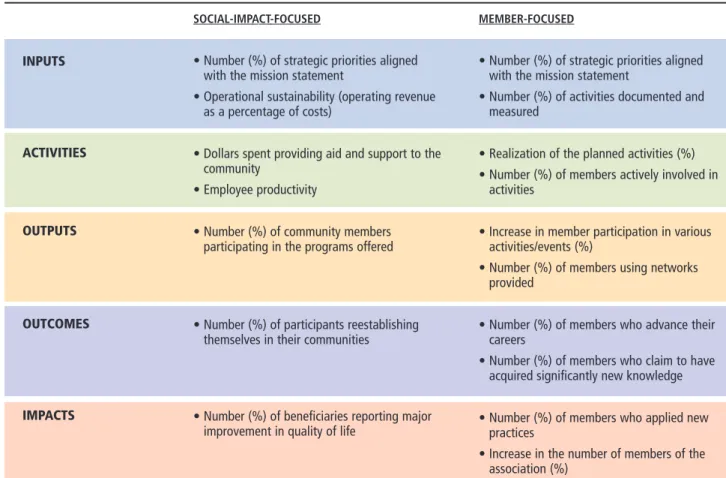
Using the Causal Linkage Map, you can then identify performance measures for each category. These measures provide a quantitative analysis of how the organization is doing in fulfilling its mission. Table 1 presents examples of performance measures for two different organizations. One is a nonprofit focused on social impact, and the oth-er is a memboth-er-focused nonprofit, such as a professional association.
Figure 1 and Table 1 demonstrate how organizations can and do build the bridge between the qualitative worlds of mission definition and the development of solid metrics that demonstrate how progress is being made on
achieving the mission. To implement this successfully in a nonprofit, you should be sure of the following:
1.There’s a clear, proven methodology on how to go about establishing performance metrics. This method-ology involves a lot of process and meetings where both the board and staff work independently to generate the causal maps and then come up with a reconciled version. The process of reconciliation is critical, and the end product is somewhat subjective.
2.These performance measures draw on a combina-tion of financial numbers, activity rates (such as number of people in training sessions), and general indices from local, state, and national government agencies. The board clusters items in these measures together in flexible ways that it believes are useful.
3.Depending on the performance metric, some may be reported in time spans as short as a month and others as long as a year. In general, management needs more fre-quent and detailed performance metrics than the board does.
C OV E R S TO R Y
SOCIAL-IMPACT-FOCUSED
• Number (%) of strategic priorities aligned with the mission statement
• Operational sustainability (operating revenue as a percentage of costs)
• Dollars spent providing aid and support to the community
• Employee productivity
• Number (%) of community members participating in the programs offered
• Number (%) of participants reestablishing themselves in their communities
• Number (%) of beneficiaries reporting major improvement in quality of life
MEMBER-FOCUSED
• Number (%) of strategic priorities aligned with the mission statement
• Number (%) of activities documented and measured
• Realization of the planned activities (%) • Number (%) of members actively involved in
activities
• Increase in member participation in various activities/events (%)
• Number (%) of members using networks provided
• Number (%) of members who advance their careers
• Number (%) of members who claim to have acquired significantly new knowledge • Number (%) of members who applied new
practices
• Increase in the number of members of the association (%)
Table 1:
Examples of Nonfinancial Performance Measures for Social-Impact-Focused
and Member-Focused Organizations
INPUTS
ACTIVITIES
OUTPUTS
OUTCOMES
IMPACTS
CATEGORIES PERFORMANCE MEASURES
4.Comparing indices and activity levels of one non-profit to other, similar organizations is particularly useful, but this data is often very hard to gather. Use of this data may be slightly complicated because a low-performing organization may fudge a little in its reporting to delay word getting out about problems it’s having.
This example of applying mission-effectiveness mod-els, Causal Linkage Maps, and performance measures illustrates the critical connection between a defined mis-sion and strategy and the selection of appropriate perfor-mance measures. This approach is equally useful in both social-impact-focused nonprofits and member-focused nonprofits. We’ll now discuss two examples of best prac-tices: Opportunity International and AARP.
Opportunity International is a large and growing microfinance network whose mission is “to provide opportunities for people in chronic poverty to transform their lives.” Although the organization has a social mis-sion, financial sustainability is critical to achieving it. The network’s success is based on financial sustainability, donor funding, good microfinance partners, training, tapping business leaders, gaining massive scale and rapid growth, and empowering people locally. It uses various performance metrics to measure success and guide strate-gy in pursuit of its financial excellence. These perfor-mance measures are complemented by a set of
nonfinancial performance measures that attempt to
cap-ture the organization’s success in improving its clients’ economic, social, and spiritual life (see Table 2).
Formerly the American Association of Retired Persons, AARP is the largest not-for-profit membership organiza-tion for people age 50 and older in the United States, and its mission is “enhancing the quality of life for all as we age.” Activities are managed by AARP and the AARP Foundation, which administers various charitable pro-grams and legal services for older Americans, including those who aren’t members of AARP.
The AARP Foundation measures its performance using four perspectives: resources and stewardship, people, social impact and value, and organizational leadership and integration (see Table 2). The AARP Foundation uses very broad metrics, which include:
◆Input measures, such as dollars raised, costs, and the like;
◆Process measures, such as maintenance of the BBB Wise Giving Certification;
◆Output measures, such as on-time strategic plan;
◆Outcome measures, such as the level of satisfaction of diverse groups of employees; and
◆Social-impact measures, such as the percentage of new age/disability employment discrimination, pensions and employee benefits, financial fraud, grandparenting, and government or public benefits cases affected positive-ly by the AARP policy positions.
OPPORTUNITY INTERNATIONAL
• Operational sustainability (operating revenue as a percent-age of costs)
• Dollars loaned per year
• Percentage of loans made to women
• Financial sustainability (ability to cover lending expenses and the cost of capital)
• Loan repayment rate
• Number of new clients or businesses per year • Percentage increase in profits
• Number of jobs created per year
• Percentage of clients with increased civic/leadership involvement
• Percentage improvement in quality of life
AARP FOUNDATION
• Fundraising costs as a percentage of all related contributions • Level of operating reserves
• Maintenance of the Better Business Bureau Wise Giving Certification
• Level of satisfaction of diverse groups of employees • On-time strategic plan for AARP Foundation
• Number of members donating to the AARP Foundation • Number of volunteers engaged
• Percentage of new age or disability employment discrimina-tion, pensions and employee benefits, financial fraud, grand-parenting, and government or public benefits cases positively affected by the AARP policy positions
Table 2:
Selected Performance Metrics from Opportunity International
and the AARP Foundation
Financial Strategy and Insight
Although assessment of mission performance is a high-priority item for a board, the performance is difficult to measure and often has a long-term horizon. On the other hand, financial performance is highly critical and often demands a short-term focus and immediate attention. Without liquidity and solvency in the short and long term, an organization can’t continue the work on its mission.
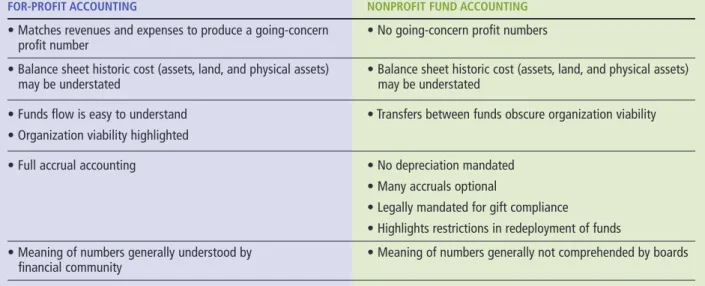
Significant differences exist in the preparation and content of nonprofit financials and those of for-profits. Some performance metrics in the for-profit world, such as net income and earnings per share, don’t exist in the nonprofit world, but two financial metrics of the for-profit world—free cash flow and revenue growth—are very relevant to the nonprofit world. An important addi-tional source of funds for the nonprofit world that isn’t available to the for-profit is philanthropy in its various forms of annual giving, capital campaigns, and planned giving. As Table 3 shows, other significant differences exist between for-profit and nonprofit financial measures and strategies, which we’ll now discuss.
Accounting Framework
Instead of normal accrual accounting, nonprofit accounts are segregated and kept track of through a series of funds in a system called fund accounting. Although it can be
highly confusing for new board members, fund account-ing makes it possible for nonprofits to ensure compliance for the terms of all contracts and restricted gifts. Funds are often broken down into three types: operating/cur-rent funds, building and equipment funds, and endow-ment funds.
Depreciation
Depreciation frequently isn’t included in a nonprofit’s financial statements. Board members must add this charge to ensure that the organization is viable over the long term. For example, it’s quite easy for the organiza-tion to underreach in service pricing and philanthropy efforts and, as a consequence, allow the plant and other tangible assets to gradually decay into faded elegance. Thus, some directors request that depreciation accounts be included in their nonprofit statements for management-control reasons.
Fixed Assets
Fixed assets, such as substantial amounts of land, are often significantly undervalued, which causes an organi-zation to have more resources than it knows about. Con-versely, with inadequate or no depreciation in other situations, assets may be grossly overvalued on the bal-ance sheet.
Table 3:
Key Differences Between Corporate Accounting and Nonprofit Accounting
FOR-PROFIT ACCOUNTING NONPROFIT FUND ACCOUNTING
• Matches revenues and expenses to produce a going-concern • No going-concern profit numbers profit number
• Balance sheet historic cost (assets, land, and physical assets) • Balance sheet historic cost (assets, land, and physical assets) may be understated may be understated
• Funds flow is easy to understand • Transfers between funds obscure organization viability • Organization viability highlighted
• Full accrual accounting • No depreciation mandated • Many accruals optional
• Legally mandated for gift compliance
• Highlights restrictions in redeployment of funds
• Meaning of numbers generally understood by • Meaning of numbers generally not comprehended by boards financial community
C OV E R S TO R Y
Quarterly Numbers
Quarterly numbers don’t have the same external signifi-cance as in the for-profit arena where financial markets are looking for specific profit performance. Instead of being distributed externally, variances from the budget on either revenue or expense items are used for internal con-trol purposes.
Cash Flow
Cash flow is king! The board must be focused on both the short run and long run. When cash is gone and there are no additional sources, the nonprofit disappears.
Hidden Liabilities
Hidden liabilities (such as potentially uncollectable loans to staff members) and unrecognized pledging of assets (such as a house title being transferred to an individual when he or she retires from the organization) can be spe-cial problems for midsize organizations that have been around a long time and may have had weak institutional memory and sloppy procedures. Similarly, clarity is need-ed to understand any legal encumbrances on assets and funds. A history of weak auditors and business managers may have left significant surprises for subsequent boards.
Endowment Management
Management of endowment and the rate of income
with-drawal from it must be carefully examined for both pru-dence and long-term viability. Endowment is a double-edged sword; no matter how much you have, your appetite is always hungry for more. Therefore, endowment yield is a very complex topic because, as you know, the more you withdraw, the less is available for the future. A withdrawal rate of 4.5% to support operations has been a widely used industry benchmark over the years, but there are wide variances in actual practice. A final issue about endowment is how much of it is donor-restricted to purposes that may no longer be aligned to the organization’s mission.
Annual Giving
Annual giving and capital gifts often may play a very important role in the operations of the nonprofit. It isn’t unusual for many nonprofits to have a negative cash flow from operations, even after adding in annual gift giving. When you add in capital gifts, foundation grants, planned gifts, and the like, the picture may change. Yet philan-thropic support may be hardest to get when you most need it because, in difficult times, major donors tend to sit on the sideline and watch, thereby intensifying the crisis. For this reason, liquidity is very important for nonprofits.
Debt and Its Servicing Status
Medium-size and large nonprofits have access to the pub-lic debt markets. Though tapping these markets can allow
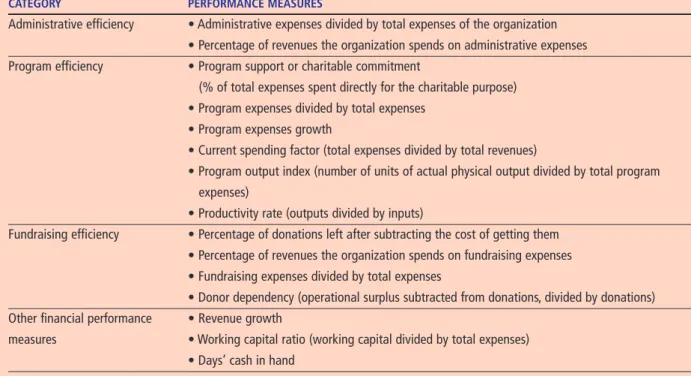
Table 4:
Examples of Financial Performance Measures of Nonprofit Organizations
CATEGORY PERFORMANCE MEASURES
Administrative efficiency • Administrative expenses divided by total expenses of the organization • Percentage of revenues the organization spends on administrative expenses Program efficiency • Program support or charitable commitment
(% of total expenses spent directly for the charitable purpose) • Program expenses divided by total expenses
• Program expenses growth
• Current spending factor (total expenses divided by total revenues)
• Program output index (number of units of actual physical output divided by total program expenses)
• Productivity rate (outputs divided by inputs)
Fundraising efficiency • Percentage of donations left after subtracting the cost of getting them • Percentage of revenues the organization spends on fundraising expenses • Fundraising expenses divided by total expenses
• Donor dependency (operational surplus subtracted from donations, divided by donations) Other financial performance • Revenue growth
measures • Working capital ratio (working capital divided by total expenses) • Days’ cash in hand
much quicker progress on facility expansion, it also brings balance-sheet risk and the need to comply with various debt covenants. (Smaller nonprofits often don’t have assets or revenue streams to pledge as debt collateral).
Auditing
Auditing is a potential vulnerability of the small nonprofit. The combination of a small audit firm (sometimes one person), an inexperienced volunteer audit chair, and a semi-experienced CFO opens the door to risk either through fraud or incompetence. As we mentioned earlier, it’s important to have one or two experienced financial members on the board to ensure the company observes normal protocols of a post Sarbanes-Oxley Act world. After all, bad things happen in the nonprofit world as well.
Embedded For-Profit Activities
Eager to raise funds, some nonprofit organizations have launched earned-income ventures and other hybrid orga-nizational structures. Earned-income ventures relate to payments in direct exchange for a product, service, or privilege. They are for-profit activities that often support a nonprofit venture and may also be known as social entrepreneurship, social enterprise mission-based ventur-ing, and venturepreneurship.
Financial Performance Measurement
in the Nonprofit Sector
Table 4 features some of the most appropriate financial performance measures that nonprofit organizations often use to measure and evaluate financial performance. But nonprofits can’t use many of them to compare across organizations—even in the same industry—because of the differences in organizational missions, strategies, organizational structures, and systems. Nonetheless, the numbers are important for the board to think about.
To provide information to potential donors, organiza-tions such as Charity Navigator analyze the financial health of charities (excluding hospitals, schools, universi-ties, and community foundations). The analysis provides important information about the organization’s efficiency of spending valuable resources, costs incurred, revenue growth, and how financially successful the organization is with its various programs. Using the information each charity provides annually in its public disclosures, Chari-ty Navigator evaluates the nonprofits in two broad areas of financial health—effectiveness and capacity.
To determine organizational efficiency, the company analyzes four performance categories: program expenses
divided by total operational expenses; administrative expenses divided by total operating expenses; fundraising expenses divided by total operating expenses; and fundraising efficiency, calculated as the charity’s fundrais-ing expenses divided by the total contributions the chari-ty receives as a result.
To measure organizational capacity, the company ana-lyzes three performance categories: primary revenue growth over four years; program expenses growth over four years; and working capital ratio, calculated as work-ing capital divided by total expenses. Charity Navigator scores charities qualitatively in each category, assigns rat-ings in organizational efficiency and organizational capa-bility, and finally evaluates their overall financial health. But it doesn’t address the program effectiveness and social impact measures. Instead, Charity Navigator pro-vides examples of financial performance measures that managers and potential donors can use to evaluate their organization’s financial health.
Measuring the Mission
While finance remains important for nonprofit organiza-tions since sustained losses can lead to their demise, this data must be supplemented by measures that relate to achieving mission success. Increasingly, nonprofits are developing performance measurement systems to evalu-ate success toward achieving their missions. Combined with financial performance metrics in both social-impact-focused and member-focused organizations, such data allows organizations to have a more informed view of their performance and a better understanding of the manner in which they are affecting the communities that they serve. SF
Marc J. Epstein, Ph.D., is Distinguished Research Professor of Management at Jones Graduate School of Business at Rice University in Houston, Texas. He is also a member of IMA. You can reach Marc at (713) 348-6140 or
F. Warren McFarlan, DBA, who has been a member of the Harvard Graduate School of Business Administration faculty since 1964, is currently a Baker Foundation Profes-sor of Business Administration. You can reach Warren at
(617) 495-6402 or [email protected].
Note: This article draws heavily on the 2011 book Joining a
Nonprofit Board: What You Need to Know by Marc J.
Epstein and F. Warren McFarlan, published by Jossey-Bass.