OUR LDC DEBTS
Rudiger Dornbusch
Working Paper No. 2138
NATIONAL BUREAU OF ECONOMIC RESEARCH 1050 Massachusetts Avenue
Cambridge, MA 02138 January 1981
The research reported here is part of the NBER's research program in International Studies. Any opinions expressed are those of the author and not those of the National Bureau of Economic Research.
Our LOC Debts
ABSTRACT
The U.S. has significant interests involved in the world debt problem. It affects the profitability and even the stability of our banking system, but the debt problem also matters because debt service requires trade surpluses for debt-ors. Debtor countries have made their goods extra competitive, are selling in our market and are competing with our exports. The debt problem is therefore a part, though perhaps a small part, of the U.S. trade crisis. Finally we have a major foreign policy stake in the debt crisis in that debt collection brings about social and political instability.
The paper sets out debt facts, followed with a brief look at the origins of the debt problem. The "transfer problem" is the general framework in which we discuss the problem of debt service for the debtor countries. We then discuss bank exposure and the quality of debts. The paper then addresses the trade
implications of debt service and concludes with an overview of alternative pro-posals for solving the debt problem.
Rudiger Dornbusch E52—357
MIT
OUR IDC DEBTS' Rudiger Dornbusch
Nassachusetts Institute of Technology and
National Bureau of Economic Research
This paper deals with the U.S. interest in the world debt problem. We have a major stake in the debt problem because it affects the profitablity and even the stability of our banking system. But it also matters because debt service requires trade surpluses for debtors. We are now experiencing the reverse side of the coin from collecting debt: debtor countries, having made their goods extra competitive are selling in our market and are competing with our exports. The debt problem is therefore a part, though perhaps a small part, of the US trade crisis. Finally we have a major foreign policy stake in the debt crisis in that debt collection brings about social and political
instability.
-The paper reviews these various aspects of the debt problem. Section 1 sets out debt facts, followed in section 2 with a brief look at the origins of the debt problem. That issue is important in laying the groundwork for solutions that involve sharing the adjustment. The "transfer problem" is the general framework in which we discuss the problem of debt service for the debtor countries in section 3. Section 4 deals with bank exposure and the quality of less developed countries' (LDCs) debts. The U.S. trade implications of the debt crisis are briefly addressed in section 6. The paper concludes with an overview of alternative proposals for solving the debt problem.
'
Paper prepared for the volume on The U.S. in the World Economy,
?LFeldstein (ed.), to be published by the NBER. I am indebted to Eliana Cardoso, Martin Feldstein, Stanley Fischer and Simon Johnson for many helpful comments and suggestions.
1. DEBT FACTS
In this section we provide an overview of debt facts: in the aggregate and in country detail, who owes whom how much, with what maturity, and in which currency.2
An Overview
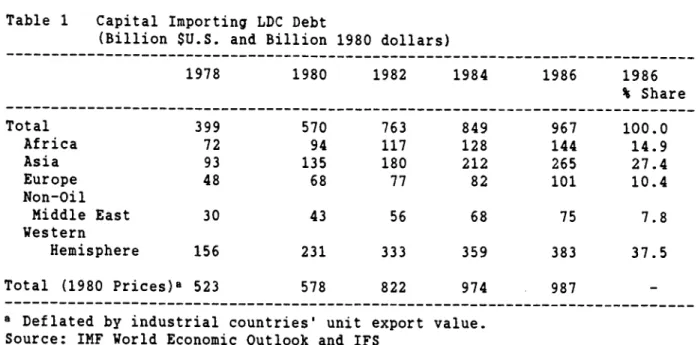
Table 1 shows aggregate debt data for selected years both in current and constant dollars. There is a problem in finding a suitable deflator for the world economy. Possible candidates are the U.S. GNP deflator, or either import or export prices for LDCs. We select instead the price (export unit value) of industrial countries' exports as a broader price index of trends in the world economy. World trade prices since 1980 have declined, and even in 1986 are below their 1980 level. Accordingly this index behaves very
differently from, for example, the U.S. deflator which has been steadily increasing.
Since 1978 LDC debt has increased by 142 percent in nominal terms and 88 percent in real terms. In these aggregate data we observe the slowdown of debt growth since 1982 and the effect of changing trends in world prices with inflation in the early period and deflation since 1980.
2There is a lot of flux in debt data. A good survey of the problems can be found in Mills (1986). We use here the IMF data, data reported by Morgan Guaranty World Financial Markets and the US country exposure
survey except where otherwise noted.
3The classification of countries follows the IMF. See World Economic Outlook, October l986,pp.31—34.
Table 1 Capital Importing LDC Debt
(Billion $U.S. and Billion 1980 dollars)
1978 1980 1982 1984 1986 1986 % Share Total 399 570 763 849 967 100.0 Africa 72 94 117 128 144 14.9 Asia 93 135 180 212 265 27.4 Europe 48 68 77 82 101 10.4 Non-Oil Middle East 30 43 56 68 75 7.8 Western Hemisphere 156 231 333 359 383 37.5 Total (1980 Prices)a 523 578 822 974 987 —
a Deflated
by industrial countries' unit export value. Source: IMF World Economic Outlook and IFS
-A second perspective is provided by looking at debt relative to some scale variable. The most common scale variables are exports of goods and services and GD?. Table 2 shows debt relative to GD?.
Table 2 Debt GD? Ratios (Percent)
Africa Asia Europe Non—Oil LEast Western Hemisphere
1978 32.2 15.9 23.7 52.9 31.8
1982 36.3 21.5 30.8 66.6 43.5
1986 44.3 30.0 40.0 63.2 47.0
Memo: Cumulative Real GDP Growth 1982-86
4.2 31.1 11.4 —0.3 5.5
The most interesting point made by this data is that differences, at least at this aggregate level, are minor. Latin America is normally singled out as the problem case. But on a debt—income basis non—oil Middle east countries stand out as having an even larger burden. The other point to note is the deterioration in debt ratios since 1982. This is surprising when one sees banks today rationing credit. The explanation lies primarily in the fact that GD? in U.s. dollars has declined for most debtor countries as a result of large real depreciation.4
There is another interesting presentation of debt—income ratios,
singling out different groupings of countries. Interestingly small, low—income countries have a higher debt/GD? ratio (64.0 %) than net oil imports (35.3%) or the grpup of problem debtors (46.6 %). Thus countries in a group with Afghanistan and Bangladesh have higher debt ratios than the group including Brazil and Mexico. We shall see below that this does not translate into higher debt burdens since much of the poor countries' debt is concessional.
Short, Long, Official and Private Debt
The maturity structure of the debt is primarily medium—term.
Throughout the period 1978-86 the share of short-term debt (less than one year maturity) in total debt of all capital importing LDCs never exceeded 20
percent. But, of course, there are significant differences between countries. The larger borrowing from commercial banks the shorter the maturity of debt. In the period to 1982 there was an increase in the share of short—tern debt, reflecting the increasing recourse to commercial bank financing. But since
4Note that real GD? and dollar GDP behave very differently. A real depreciation may raise real GD? but is certain to lower dollar GD?.
then, with rescheduling and increased official lending the share of short—tern debt has declined from 20 percent to only 13 percent. Since most debtors are not in a position to amortize their debts the distinction between short and long—term debt is becoming increasingly irrelevant.
Table 3 shows the share of debt to official creditors in total debt. The table reports the data for various regions.
Table 3 Share of Long—term Debt to Official Crediors in Total Debt (Percent of Total)
Africa Asia Europe Non—Oil Western Middle East Hemisphere
1978 34.0 54.9 27.6 57.6 15.9
1982 38.9 42.5 30.7 58.5 12.4
1986 48.6 43.5 33.3 58.5 20.3
Source: IMF World Economic Outlook
The differences among country groupings in their funding is quite striking. Latin America stands out as borrowing from private sources a very much larger share than the remaining countries. But there is also an
interesting difference in the behavior over time. For Latin America and Africa the absolute and relative increase in official credit since 1982 is much more substantial than for other regions. In 1985, for example, commercial bank exposure declined in absolute terms while official exposure, especially of multilateral agencies, increased.
Debt Service Burdens
The burden of debt service is made up of interest payments and amortization. As such it is affected by three factors:
.The maturity profile of debt which dicatates the amount of
amortization in a given year. Any bunching of maturities would translate into large year—to—year fluctuations in debt service.
.Interest rates on the debt. This factor depends on the private— official composition of the debt. Official debt may be concessional and long— term while private typically involves floating rate interest payments.
.Debt service measured relative to some benchmark such as exports or GDP. The benchmark is affected by the country's real exchange rate. Real depreciation, as already nioted above, will reduce real GDP in dollars and hence raise the debt income ratio. Measuring debt relative to exports imples that changes in the value of exports, say as a result of exchange rate policy or as a consequence of changes in world commodity prices, will affect the debt export ratio.
The distinction between long and short—term debt, in an environment of universal rescheduling, is becoming quite uninteresting. We thus focus only on interest payments. Table 4 shows debt service measured by interest payments as a fraction of debt, GD?, and exports. We again focus on the geographical
distribution.
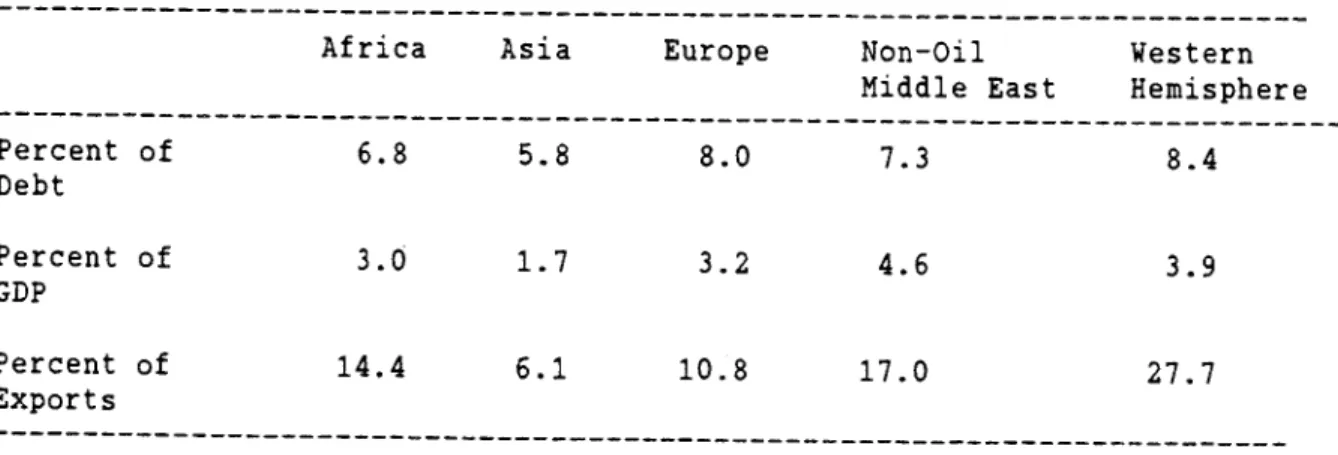
Table 4 LDC Interest Payments: 1986
Africa Asia Europe Non—Oil Western
Middle East Hemisphere
Percent of 6.8 5.8 8.0 7.3 8.4 Debt Percent of 3.0 1.7 3.2 4.6 3.9 GD? Percent of 14.4 6.1 10.8 17.0 27.7 Exports
The first row makes apparent the difference in effective interest rates paid. Africa and Asia have a significantly larger share of concessional loans and accordingly interest payments as a fraction of debt are in excess of 2 percentage points less than for Latin America. As a benchmark we can compare the effective interest rate with the L,ibor rate, which in 1985—86 averaged 7.8 percent. Divergences of the effective rate from Libor reflects concessional loans and the spreads above Libor on commercial bank loans.
The interest burden as a fraction of GDP shows Africa and Europe in the middle range, a low figure for Asiaand high indebtedness for Latin America and the non—oil middle east with high indebtedness. Differences between the GD? and export—based comparisons reflect economic structure. Europe is wide open while Latin America is much more closed. Latin America's export to GD?
ratio is much lower than that for Asia, for example.
The difference between debtors with commercial and those with concessional debt becomes particularly apparent when comparing effective interest payments. While the effective interest rate for small, low—income countries in 1986 averaged 3.4 percent, for the remaining groups it was between 6.9 and 8.7 percent.
Currency Denomination
The currency composition of lending to LDCs is not well documented. There is little doubt that the major part of loans, perhaps 60 to 70 percent,
is in U.s. dollars. The denomination issue is very important since large
fluctuations of real exchange rates between the U.S., Europe and Japan involve changing burdens of real debt and changing bank exposure.
Since February 1985 the dollar has declined in world markets by more than fifty percent relative to key currencies. Over the same period prices of industrial countries' exports which we might use as an index of prices in world trade have fallen only 5 percent while prices of commodities exported by LDCs fell 7 percent over the 1982—86 period. For debtor countries the movement of the dollar thus did not carry significant conmsequences if they were
entirely denominated in dollars. If, however, a significant part was
denominated in Yen or in European currencies the vast exchange rate movements would have meant an increase in real debt burdens.5
Major Problem Debtors
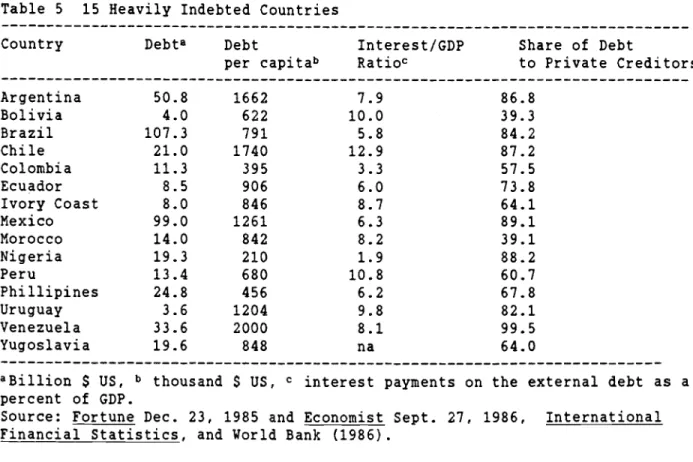
We conclude the review of facts with a listing of major problem debtors. This group of countries corresponds to the "15 heavily indebted countries" Table 5 shows their total debts, interest payments and debt per capita.
5This increase in real debt burdens would have outpaced any advantages from cumulatively lower interest rates on non—dollar debt. As is well— known exchange rate movements have far exceeded the depreciation
Table 5 15 Heavily Indebted Countries
Country Debta Debt Interest/GD? Share of Debt
per capitab Ratioc to Private Creditors
Argentina 50.8 1662 7.9 86.8 Bolivia 4.0 622 10.0 39.3 Brazil 107.3 791 5.8 84.2 Chile 21.0 1740 12.9 87.2 Colombia 11.3 395 3.3 57.5 Ecuador 8.5 906 6.0 73.8 Ivory Coast 8.0 846 8.7 64.1 Mexico 99.0 1261 6.3 89.1 Morocco 14.0 842 8.2 39.1 Nigeria 19.3 210 1.9 88.2 Peru 13.4 680 10.8 60.7 Phillipines 24.8 456 6.2 67.8 Uruguay 3.6 1204 9.8 82.1 Venezuela 33.6 2000 8.1 99.5 Yugoslavia 19.6 848 na 64.0
aBjilion $ US, b thousand S US, C
interest
payments on the external debt as a percent of GDP.Source: Fortune Dec. 23, 1985 and Economist Sept. 27, 1986, International Financial Statistics, and World Bank (1986).
In this table Chile, Peru, and Bolivia are shown as having the highest debt/GD? ratio while Chile, Argentina, and Mexico show the highest per capita debt figures. Bolivia and Morocco are interesting in that their debts are predominantly to official creditors. Finally Nigeria is of interest because of the relatively low per capita debt by comparison with the other countries.
3. THE ORIGINS OF THE DEBT PROBLEM
In this section we review where the debt problem stems from. Three facts combined to produce the debt crisis of 1982. The proportions vary from one case to another, but in almost all instances there is a combination of the following factors:
• Poor macroeconomic policies of debtor countries. These include specifically overvaluation of their currencies.
• The downturn in the world economy, involvingsharply higher interest rates and lower growth.
• Initial overlending and subsequent credit denial by commercial banks.
We now review these factors in turn.
Domestic Mismanagement
In the late 1970s debtor countries worldwide, with rare exceptions, embarked on policies inducing currency overvaluation. The policies were motivated by a single purpose: to contain and reduce stubborn inflationary pressure. The popularity of the policy, in the shortterm, stems from the fact that real wages increase. The increase in real wages translates only gradually into lower employment. Hence there is a period of euphoria as standards of living are artificially inflated by the real appreciation while the resulting external imbalance is financed via reserve depletion and external borrowing.
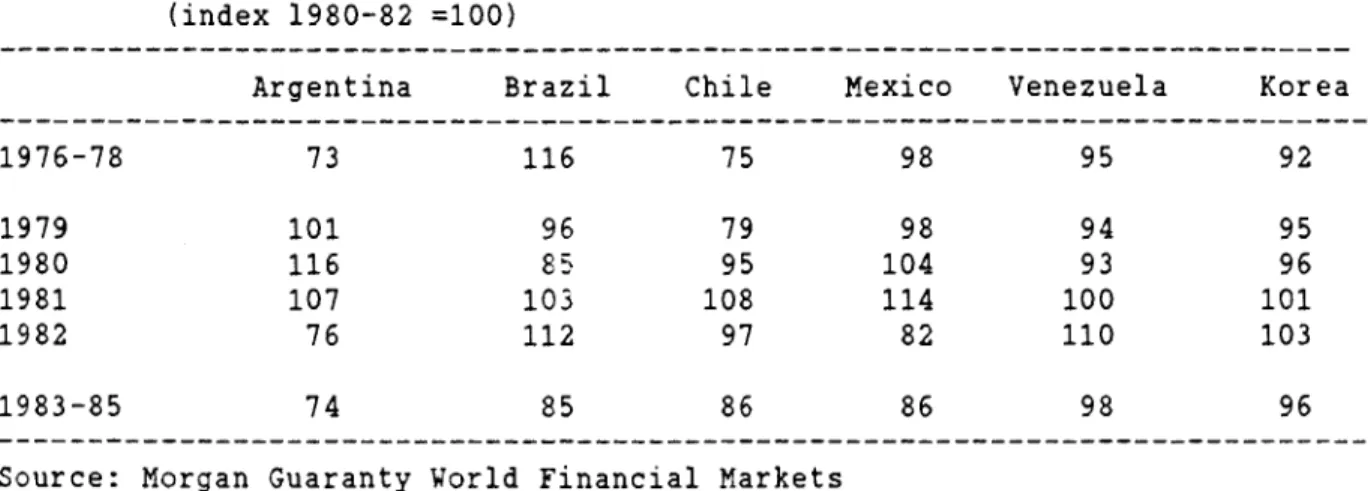
Table 6 Real Exchange Rates (index 1980—82 =100)
Argentina Brazil Chile Mexico Venezuela Korea
1976—78 73 116 75 98 95 92 1979 101 96 79 98 94 95 1980 116 85 95 104 93 96 1981 107 103 108 114 100 101 1982 76 112 97 82 110 103 1983—85 74 85 86 86 98 96
Each of the countries in Table 6 showed some real appreciation in 1979—82 as indicated by an increase in the real exchange rate index. For
example in Argentina the rera]. exchange rate moves from a value of 73 in 1976— 78 to 116 in 1980. Not all cases were as extreme and the annual averages
conceal some of the even higher peaks. But the basic point is that most debtor countries, sometime in 1979—82, experienced real appreciation of some degree.
The exact timing of real appreciation differs but the story is invariably the same. There are, however, significant differences in the magnitude of overvaluation. Argentina, Chile, Mexico and Venezuela have much more extreme experiences than Brazil or Korea. Brazil is interesting because
its policy of using (normally) a crawling peg geared to the US—Brazil economy— wide inflation differentials assured that high productivity growth in
tradeab].es translates into a steady real depreciation. Dollar depreciation reinforces the gain in competitiveness in the late 1970s, but when the dollar strenghtens in the 1980—2 period competitiveness is lost. In Korea's case the real appreciation was very shortlived and, in fact quite minor compared to say Argentina.
The particular details of mismanagement differ between countries. For concreteness we look at Argentina, Brazil, Chile and Mexico.
Argentina: Under Finance Minister Martinez de Hoz in the post-Peronist
military government inflation was reduced from more than 600 percent in 1976 to less than 200 percent by 1978. But further inflation reduction was hard to achieve. A large budget deficit was an obvious reason. Yet the government preferred to focus on the inflation—depreciation spiral and the role of expectations.
Appealing to the law of one price, and the critical role of expectations, the government implemented in December 1978 a policy of
preannouncing the rate of exchange depreciation. The preannounced 'tablita' showed a steady deceleration of the rate of depreciation, and this was
actually implemented. But inflation reduction was very slow. Hence the real exchange rate became steadily overvalued.6 Even so the policy was continued until March 1981 when it ultimately broke down.
The consequences for debt of overvaluation came primarily from the side of the capital account. Argentina had liberalized international capital flows entirely. As a result residents, aware of the growing overvaluation, could freely shift into foreign assets, ranging from dollar bills to foreign deposits and securities or real estate. The extreme overvaluation, reaching more than 40 percent, led to large scale capital flight. The government borrowed in New York, using the proceeds to sustain the exchange rate along its preannounced path. The public bought dollars and redeposited them in the very same banks from which the government had borrowed. And that process continued, in the fullest knowledge of all concerned until a change in the military government led to a collapse of the policy.
My estimate of Argentine capital flight in the period 1978—82 is $23 billion, not counting unrepatriated interest earnings which would raise the figure to well above $30 billion.
Chile: The Pinochet government instituted free market reforms and fiscal orthodoxy in Chile. These included elimination of tariffs and quotas and a
balancing of the budget.7 But inflation, while sharply reduced from the near hyperinflation levels of 1972—74 would not disappear. By 1979, with inflation
the only major economic problem, the government fixed the exchange rate. The rate was fixed at 39 pesos/S even though inflation was still near 30 percent, way above world inflation, and wages were indexed in a backward looking
fashion.
Not surprisingly the exchange rate became increasingly overvalued. Wage increases far outpaced world inflation and thus the real exchange rate appreciated steadily. In the short—run the policy was popular since it raised living standards. But it became increasingly apparent that there was an
unsustainable overvaJ.uation was accumulating. By 1981 the system started to unravel. The public responded in their accustomed way. Taking advantage of what was perceived to be a very transitory "sale" of imports the entire
country participated in the flight into imports (in particular durables). The real exchange rate appreciated by more than 25 percent between 1978 and 1981. The value of imports increased by 50 percent. Import volume indices tell an extraordinary story: breeding stock +328 %,
automobiles
+226%,
electro
domestic equipment +156%. The Chilean example highlights thatespecially in the case of producer and consumer durables a transitory exchange rate overvaluation has major effects on the timing of purchases. The
government was not deterred by these developments. Steadfastedly, the
authoritiers maintained the exchange rate and asserted that the exchange rate policy was visibly successful as evidenced by the declining rate of inflation.
70n the Chilean experiment see Edwards and Edwards (1987) and Ramos (1986)
As in all other cases the policy ultimately broke down. Tariffs are back today and so are quotas. Inflation is back to the point where the
adventure started. The lasting difference is an extraordinary debt burden and extremely high unemployment. We return to these issues below.
Mexico: The large increase in oil prices during 1978/79 would lead one to expect that Mexico should have done well. But even with sharply increased revenues from oil the currrent account deteriorated in the period 1979—81 from $5 to $13 billion. At the same time there was a major outflow of capital. B
An estimate by Morgan Guaranty places the amount of capital flight during 1976—82 at $36 billion while a World Bank estimate for 1979—82 gives $26.5 billion.9 The extent of capital flight is associated with a peculiarly Mexican institution: the 6th and final year of the presidency. 1982 was such a year and people expected, correctly, that overvaluation and an excess of
spending would ultimately lead to a balance of payments crisis. Under these circumstances capital flight became extreme.
Brazil: The Brazilian case is special in that the policy mistakes nay well have been minor. Brazil certainly ran very large budget deficits. Oil price increases and increased world interest rates were absorbed by the public sector deficit and the resulting external deficit was financed by increased borrowing abroad. But it turns out that much of the earlier borrowing by state enterprises, especially in the 1972—78 period, financed a massive national investment effort. 10
80n the Mexican case see Cardoso and Levy (1986)
9Morgan Guaranty World Financial Markets, March 1986 and World Development Report, 1986..
In Brazil's case tight restrictions on imports, and the near—absence of capital flight made for an experience very different frtorn that of
Argentina, Mexico or Chile. The chief source of debt accumulation was the public sector. This meant that the damage was much more limited than was the case in the other countries. Indeed, by early 1985 it seemed that lopwer interest rates and a sharply reduced oil price helped solve Brazil's debt problems for the major part. Since then the current acxcount has once again deteriorated, in part as a result of an overly expansionary policy. But even so Brazil is among the debtor countries who are more likely to be able to sustain growth and debt service.
The World Macro—economy
A major part in the origins of the debt crisis was played by the sharp downturn in the world economy during 1979—81. In the 1970s, partly as a result of the oil shocks, but also because of overexpansionary policies, the U.S. had experienced increasing inflation. In 1979—81, under the pressure of the
collapsing dollar, U.S. policies changed sharply. The full—employment budget was cut by
nearly 1.5 percentage points of GNP. Nominal interest rates were allowed to rise from 9 percent in 1978 to 17 percent in 1981 and real interest rates increased sharply.
The sharp change in the world economic environment is brought out in Table 7 which compares the early 1970s and the period preceding the debt
crisis. The early 1970s favored debtors: strong growth, high inflation and low interest rates. By comparison, in 1980—82 inflation was low, interest rates were extraordinarily high, and growth was stagnant.
Table 7 Key Macroeconomic Variables of the World Economy (Annual percentage rates)
Libor Inflationa OECD Growth
Manufactures Commodities
1970—73 7.6 12.4 14.4 5.9
1980—82 14.7 —2.4 —13.3 0.9
alnflation rate in world trade
Source: IMF IFS and World Bank Commodity Trade and Price Trends
It is particularly important in this context to see the real interest rate issue. For debtor LDCs the US real intererst rate is hardly appropriate. An alternative is provided by the inflation rate in world trade. We note that manufactures prices were declining by 2.4 while commodity prices fell by 13.3 percent per year. Any realistic estimate of real interest rates cannot fail to come up with extraordinarily high rates.
It is worth noting that commodity price developments have different effects depending whether a particular debtor is a net exporter or a net importer of commodities. The point is important in a comparison of Korea and Latin America. Korea (like Japan, for example) is a net importer of
commodities. As a result the collapse of commodity prices in 1979—81 helped offset in part at least the oil price increase. Brazil, by contrast is a net exporter of commodities and has a production structure which makes her
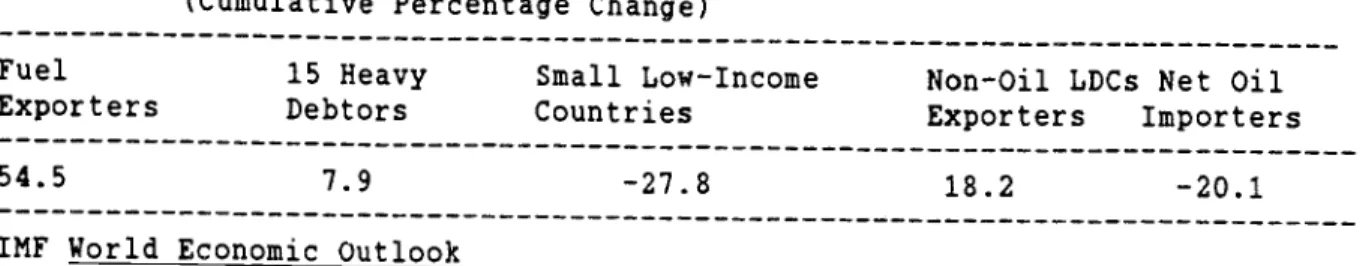
vulnerable to oil price increases and commodity price decreases. Table 8 shows terms of trade changes and highlights the very different experience of various debtor groups.
Table 8 Terms of Trade Changes: 1978—82 (Cumulative Percentage Change)
Fuel 15 Heavy Small Low—Income Non—Oil L.DCs Net Oil
Exporters Debtors Countries Exporters Importers
54.5 7.9 —27.8 18.2 —20.1
IMF World Economic Outlook
These world economic developments meant that most LDCs experienced a sharp deterioration in their current accounts. Reduced export revenues, on account of the decline in commodity prices and world recession, were
reinforced by sharply increased nominal debt service burdens. Thus debtors were made illiquid. To continue on the accustomed course external financiang needed to increase sharply. The lack of smooth financing in the case of Mexico then brought on generalized credit rationing.
Overlending and Credit Rationing
In the period to mid—1982 reckless lending was the rule. It is possible today to look search the 1980—81 discussion of debt problems for warnings of the crisis to come. The Bank for International Settlements had
expressed concern at least since 1978. A Group of Thirty enquiry in 1981 sought to uncover whether banks felt debt was a major issue and failed to find dominant concern.'' In a survey of 100 banks the question was posed "Last time no serious debt defaults arose. This time do you think that a general debt problem affecting countries is likely to emerge.. ?"
In
response 72 percent of the banks questioned expressed the view that a debt crisis was not likely, 13percent thought it might possibly happen and only 15 percent replied in the affirmative.'2
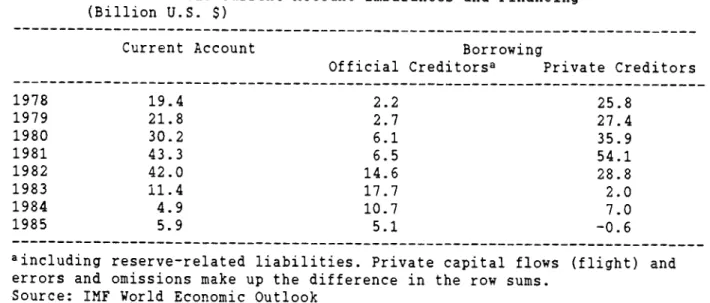
But if there were perhaps some concerns, they were certainly not enough to stop a final lending boom. Table 9 shows Latin America's current account deficit and its financing. Between 1979 and 1981 private lending to Latin America exactly doubles. It is not clear how these credits were
justified at the time. There were two arguments. One was the need for
recycling which had worked well at the time of the first oil shock. The other was the lack of information on country exposure. Neither of course is a
reasonable explanation.
Table 9 Latin America: Current Account Imbalances and Financing (Billion U.S. $)
Current
Account BorrowingOfficial Creditorsa Private Creditors
1978 19.4 2.2 25.8 1979 21.8 2.7 27.4 1980 30.2 6.1 35.9 1981 43.3 6.5 54.1 1982 42.0 14.6 28.8 1983 11.4 17.7 2.0 1984 4.9 10.7 7.0 1985 5.9 5.1 —0.6
aincluding reserve—related liabilities. Private capital flows (flight) and errors and omissions make up the difference in the row sums.
Source: INF World Economic Outlook
Subsequent to overlending was credit rationing following the Mexican moratorium of August 1982. As shown in Table 9 private lending fell off dramatically, and in 1985, even turned negative. The credit rationing
phenomenon is not surprising; faced with a country's inability to meet debt service each individual lender is reluctant to put up money which would only serve to pay other banks' claims. Hence without a cartel there is no lending. But if there is no lending then, of course, debt service is impossible and hence debtors will default.
The problem in 1982 was therefore to develop a system that would organize creditors. They would have to provide the part of debt service that could not be extracted by improvements in debtor country external balances. At the same time the cartel would serve, much as the occupation of customs houses in the old days, to extract a maximum of debt service by a lien on the debtor countries' macroeconomic policies. The IMF, having been ignored in the 1970s, eagerly (and skillfully) assumed the task of orchestrating debt collection, fiscal discipline, and forced lending.
3. THE TRANSFER PROBLEM AND DEBT SERVICE FATIGUE'3
We now ask why debt service appears to be such a major problem. In one sense the answer is quite straightforward: countries that used to spend,
borrowing the resources from official and private creditors (with little
thought of how to service or even less repay the loans), now no longer command these resources: they are limited to spending. The adjustment is complicated by two facts. The first is the macroeconomics of earning foreign exchange, the second is the political economy problem of finding extra budget resources for debt service. These issues are familiar from the discussion of German
reparation payments following World War 1.14 Exactly the same issues arise in the context of the involuntary debt service now underway.
The Reduction in Spending: The first issue is how a country adjusts to a reduction in its spendable resources. Before the debt crisis foreign loans supplemented domestic income, enlarging the resources that could be spent. Interest payments on loans were automatically provided in the form of new money and the principal on debts was automatically rolled over. With managing the debt so easy, and with ready access to resources beyond what was required to service the debt, spending ran high. After credit rationing begain in 1982, spending had to be limited, and absorption fell below the level of output as interest now had to be paid out of current production. Interest payments now had to be earned by noninterest surplusses in the current account.
Table 10 shows the debt service process at work. In the post—1982 period of involuntary lending debtor countries have achieved a shift in their noninterest external balance of nearly 5 percent of GDP. This external balance improvement serves to make net transfers of interest to the creditors. It is matched by a nearly equal reduction in investment in the debtor countries.
Table 10 Latin America: Investment and the External Noninterest Surplus (Percent of GDP)
1977—82 1983—85 Change
Gross Investment 24.3 18.5 —5.8
Noninterest External Surplus —0.6 4.7 5.3
Source: INF World Economic Outlook
'4See especially Fraga (1986) for a comparison between Germany in the 1920s and Brazil in the l980s. See,too, Dornbusch (1985).
This perverse resource transfer, of course, cones at the expense of living standards in the developing countries. But more importantly the
transfer has as a counterpart a sharp decline in investment. Interest payments thus are really financed by a mortgage on future standards of living and on the debtors' growth potential. In countries where population growth is high and income distribution is appaling such a policy may turn out to be very shortsighted.
But there remained the issue of how to distribute the cut in spending between its various components: government, consumption, and investment. As we saw above a large part of the cut took the form of reduced investment. But there was, of course, also a decline in consumption. A fall in investment was not enough has due to two special features of the adjustment process. First, cutting total demand has macroeconomic multiplier effects that translate into a reduction in output, income, and hence private spending. Second, at the same time as involuntary debt service started there also occurred a deterioration in the world economy which required an extra downward adjustment in spending.
The Foreign Exchange Problem: The second macroeconomic issue in adjusting to debt concerns the fact that the country needs to earn dollars, not pesos. In other words it needs to generate a trade surplus. The cut in spending will, of course, reduce import demand and also free exportables for sale abroad, but for two reasons that will not be enough. First, a sizeable fraction of the expenditure cut will fall on domestic (nontraded) goods, not tradeables. The spending cut thus creates directly unemployment rather than potential foreign
exchange earnings. Even for those goods that are directly tradeable it is not necessarily the case that increased supplies can be sold. Often there is the problem of obtaining market access and, if the goods are not homogeneous commodities like cotton or copper, a cut in their price is required to realize increased sales. Even then, unless demand is sufficently responsive, total earnings may not increase.
To translate the spending cut into foreign exchange earnings, a gain in competitiveness is required. The gain in competitiveness draws resources into the tradeable goods sector and in the world market makes it possible to sell the increased production of tradeable goods. Of course, the only way to gain competitiveness is by reducing the wage in dollars by a real
depreciation. But the real wage cut also generates, at least in the shortrun, increased unemployment as the spendable income of workers is cut. The size of the required cut in real wages deserves further comment. It is larger the larger the share of trade goods in income and the smaller the share of wages in GD?.
The overwhelming difficulty in the adjustment process is that external adjustment via a gain in competitiveness reduces employment. The dominant effect on employment is from the reduction in real wages and the resulting reduction in domestic demand. The positive employment response that would be expected in the tradeable goods sector from the gain in competitiveness is often very weak and slow. One of the reasons for this is that expectations of
a sustained change in competitiveness do not take hold immediately. The traded goods sector thus adopts a wait—and—see attitude, which makes real depreciation a highly precarious policy tool. The Mexican experience in this respect is particularly instructive.
A second important difficulty arises from the world—wide adjustment to forced debt service. Since most debtor countries were overspending in the early 1980's, and are now under a forced debt service regime, they all had to resort to real depreciation to enhance their competitiveness. But that means they are competitively cutting their wages relative to each other, and not only relative to those of the creditor countries. As a result an isolated country, cutting its dollar wage say by 50 percent, will gain much less in terms of increased dollar revenues because all the competing LDCs are doing much the same.
The Budget Problem: The third macroeconomic problem in
the adjustment process involves the budget. Much of the external debt is public or publicly
guaranteed. Of the part that was not initially, much has wound up in the public sector in the aftermath of the crises, as a result of bank failures. The government thus winds up having to service a debt which before was either in private hands or automatically serviced by new money. The problem, of course, is where to find the extra three or four percent of budget revenue that will pay these new interest costs.
There are basically four avenues: raising taxes and public sector prices, reducing government outlays, printing money, or issuing domestic debt. Raising taxes is notoriously difficult since most of the taxes are already levied in the form of social security taxes on workers. An easier solution is to raise public sector prices or to eliminate subsidies. The elimination of subsidies is particularly cheered by creditors and international agencies since it means moving closer to efficient resource allocation.1 Of course,
'5The fact that it is often food subsidies that are eliminated, without the proverbial neutral lumpsum tax, to compensate the losers does not seem to limit the case for the policy recommendation.
the imposition of extra taxes or the withdrawal of subsidies is inevitably inflationary from the price side unless the tax increase or subsidy cut is offset by a reduction in other prices or wages. Of course, via the revenue side reduces the growith in money and hence, in combination, it leads to a recession with inflationary pressure sustained by prevailing inflation.
Cutting government spending is another option. Attention here focusses on the often extreme inefficiency of the public sector. The public perceives that there must be a way to pay the bills out of increased efficiency, rather than reduced private absorption. The fact is, of course, that there is very little room for public sector improvements in the shortterm. Large—scale firing of redundant workers would create an overwhelming political problem. Plant closings are of the same kind and selling inefficient, overunionized firms runs into the obvious problem that the potential buyers might need to be paid to take over the liability. Perhaps the best advice may be that public sector firms should be simply given away. The problem is that the workers might oppose even that.
The most common adjustment is a cut in or freeze of public sector
wages. This has happened in most of the debtor countries, and in some cases on a very large scale. It does help the budget, but it presents its own problems. The reduction in relative wages for the public sector promotes an exodus of the wrong kind. The efficient workers leave and only those with little alternative stay in the public sector.
In many of the debtor countries the answer to forced debt service has almost inevitably been to increase government budget deficits, and to finance this by issuing debt or printing money. Noney finance brings with it the
problem of high and often extreme inflation. It is no accident that Argentina and Brazil experienced extraordinary inflation rates in the aftermath of the debt crisis. When deficits are financed by debt, while the imminent inflation problem may be absent, there is still the issue of excessive debt accumulation which ultimately poses the risk of an inflationary liquidation or a
repudiation in the manner discussed by Sargent and Wallace (1982).
There is an interaction between the foreign exchange problem and the budget problem. The need to devalue, to gain competitiveness implies that the value of debt service in home currency increases. A given payment of say $1 billion now amounts to more in pesos, produces a larger peso deficit and hence gives rise to the need for increased inflationary finance. Thus devaluation is
a source of inflation not just directly via the increased prices of traded goods and any accompanying indexation effects. It works also indirectly by raising the required inflation tax. In the classical hyperinflations major movements in the exchange rate were the prelude to the outbreak of
uncontrolled inflation and there is some evidence that exactly the same process is at work in the debtor countries today.'6
The budget is also adversely affected by the problem of capital flight. To stem capital flight, provoked by the inflationary consequences of debt service or perhaps by an impending tax reform, the country will have to raise real interest rates to very high levels. These high real interest rates in turn apply to the domestic debt, causing it to grow more rapidly, and thereby raising future budget deficits and hence the prospect of instability. That in turn feeds to more capital flight and yet higher rates. There is thus
an extraordinary vicious circle surrounding the sudden need to service debt and the inability to do so through ordinary taxation.
It is worth recognizing an important trade—off in the adjustment process. To earn foreign exchange the real wage must be cut in terms of
tradeable goods, thus enhancing competitiveness. But to balance the budget it is often necessary or at least recommended to cut subsidies for such items as food or transportation and that also means a cut in real wages. There is thus competition between two targets, a cut in the dollar wage or a cut in the tortilla wage. A choice must be made because there is only so much one can cut. Because of the lags with which the trade sector adjusts this suggests that the competitiveness adjustment should take precedence and that budget balancing should follow once the economy's resources are reallocated. Since the real depreciation by itself is already bound to produce slack there is no risk of overheating in this sequence of adjustment.
A final point worth noting is the link between budget cutting and the extraordinary fall in Latin American investment. The reason is that in the category of government spending the easiest cuts are in investment. Postponing investment and maintenance is much easier than firing workers. The resulting impact on aggregate investment is so large because the public sector, in the form of public sector enterprises, accounts for a large part of total
investment, and because the public sector was in the forefront of adjustment. It is immediately obvious that this is a very ineffective means of adjustment, failing to recognize the distinction between the public sector's current and capital accounts.
Case Study: Mexico
Mexico illustrates in a very striking way many of these issues. The least noted fact, apparent in Table 11, is the dramatic shift in the budget over the past three years. The noninterest or primary budget has improved by more than 7 percent of GD?. From a deficit of nearly four percent of GD? in 1982 the noninterest balance has shifted to an estimated surplus of 3.2 percent in 1986. The improvement is all the more impressive in view of the large decline in oil revenue in 1986. Note that the whole improvement in the noninterest budget went to finance increased interest payments on the domestic and foreign debt.
Table 11 Mexico's Budget
(Percent of GD?)
1982 1983 1984 1985 1986*
Budget Deficit 17.1 8.9 7.7 8.4 15.8
Primary Deficit 3.7 —5.2 —5.4 —4.2 —3.2
Operational Deficit n.a. —0.2 —0.7 —0.9 —2.1
Public Investment 9.3 6.6 6.5 6.1 5.1
*estimate
Source: Mexico, Presidencia de la Republica and Secretaria de Heacienda y Credito Pubico
The total budget records a deficit of nearly 16 percent of GD? for 1986. The increase in interest payments is largely a reflection of inflation. Inflation and the accompanying exchange rate depreciation raise the nominal interest rates required to make Mexicans hold the depreciating asset. These interest rates in turn translate into a large interest bill in the budget.
There is a budget deficit because there is inflation, not the other way around.
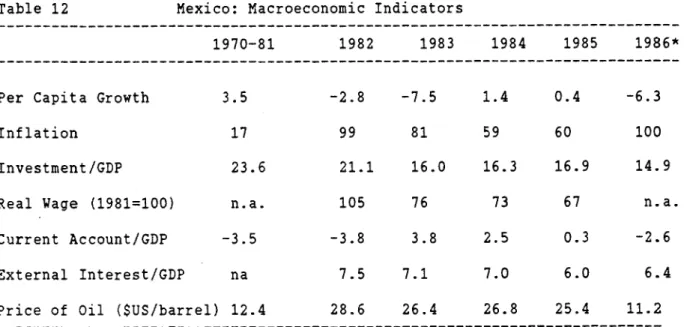
Table 12 shows further details on the Mexican macroeconomic situation. We already saw the cut in public sector investment. The table shows that total investment shows a sharp decline, leaving little net investment.
Table 12 Mexico: Macroeconomic Indicators
1970—81 1982 1983 1984 1985 1986*
Per Capita Growth 3.5 —2.8 —7.5 1.4 0.4 —6.3
Inflation 17 99 81 59 60 100
Investment/GDP 23.6 21.1 16.0 16.3 16.9 14.9
Real Wage (1981=100) n.a. 105 76 73 67 n.a.
Current Account/GD? —3.5 —3.8 3.8 2.5 0.3 —2.6
External Interest/GDP na 7.5 7.1 7.0 6.0 6.4
Price of Oil ($US/barrel) 12.4 28.6 26.4 26.8 25.4 11.2 *estjmate
Source: INF and Secretaria de Hacienda y Credito Publico
Consider next the current account. There is a striking turn—around, from the deficits prior to the crisis to surpluses afterwards. In 1983—84 the surpluses were enough to help finance capital flight and also meet the
interest payments. In 1985 interest was paid out of these surpluses, and by attracting a reflow of private capital via very high interest rates. But with the oil price decline the external financing problem returned, forcing a
choice betwen further real depreciation, and an alteration in the terms of debt service.
The real exchange rate and the real wage both declined sharply in the past few years. Real wages today are 40 percent below their 1980 levels and the external competitiveness has improved by 40 percent. These are
extraordinary adjustments for any country to make. Finally there is the employment story. The labor force is growing at 3.5 percent per year, but employment after an initial decline has been entirely stagnant over the past four years. The informal sector and migration to the U.S. were the main shock absorbers in employment. Thus unemployment is growing and thus so too is social conflict. The lack of employment growth, even after so extreme a real depreciation, is an issue of major concern. It suggests that depreciation reduces employment for quite a while before the substitution takes over.
Early results for trade were disappointing. More recently Mexico has started to build up a strong non—oil export growth. But that has turned out to be a mixed blessing. US trade concerns have spilled over to Mexico in the form of more than 100 countervailing duty cases!
Case Study: Brazil
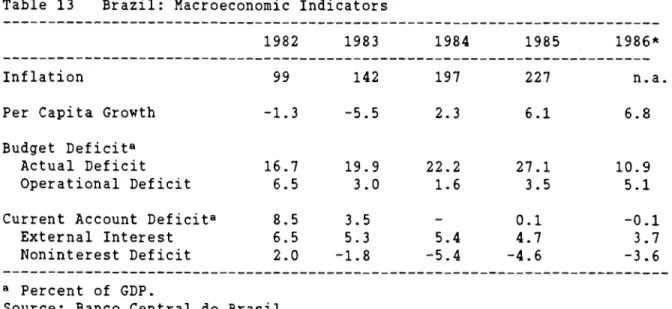
Brazil, just like Mexico, started off her adjustment with a large decline in per capita income and with a sharp acceleration of inflation. The inflation acceleration is largely due to the real depreciation required to generate a noninterest surplus. The presence of indexation translated exchange depreciation into an increase in inflation. The higher inflation in turn
Table 13 Brazil: Macroeconomic Indicators
1982 1983 1984 1985 1986*
Inflation 99 142 197 227 n.a.
Per Capita Growth —1.3 -5.5 2.3 6.1 6.8
Budget Deficita
Actual Deficit 16.7 19.9 22.2 27.1 10.9
Operational Deficit 6.5 3.0 1.6 3.5 5.1
Current Account Deficita 8.5 3.5 —
0.1
—0.1External Interest 6.5 5.3 5.4 4.7 3.7
Noninterest Deficit 2.0 —1.8 —5.4 —4.6 —3.6
a Percent of GDP.
Source: Banco Central do Brasil
The noninterest external balance improved sharply. This is seen in Table 15 in the shift of the noninterest current account from a deficit of 2 percent of GDP in 1982 to a 3.5—5 percent surplus in 1984—86. In contrast to Mexico the Brazilian budget has not improved sharply. That meant more stimulus to growth and to recovery.
The difference between Mexico and Brazil, in 1986, is both oil and macroeconomics. Lower oilprices in Brazil's case more than compensate for the
adverse conditions of the boom on the external balance. But the external balance is certainly also improved by the import substitution and export capacity expansion made possible by the investments of the early 1970s, which came on line just in time to help service the debt.
In this section we review the debt problem from the side of commercial bank creditors. We look at the extent of exposure and at the quality of debts.
Exposure:
Table 14 gives a broad overview of loans by US banks to regions other than the industrial countries or offshore banking centers. In these categories Nigeria and Venezuela are included among the Opec countries while Mexico is part of the Non—Opec countries.
Table 14 U.S. Bank Claims on Non-Industrial Countries (Billion $)
Year
Opec Non-Opec Eastern Europe1977 14.3 45.0 7.0
1982 23.2 101.9 6.6
1985 20.4 100.9 5.1
Source: Federal Reserve
Between 1977 and 1982 claims on Non-Opec countries more than doubled. By contrast, since then there has been a complete standstill in lending. The
table shows that loans to Eastern Europe are small and relatively stable in size. Exposure to Opec countries is more sizeable and has declined since 1982.
Table 15 looks at lending to non—Opec developing countries, this time disaggregating by size of bank. We also show how these claims have evolved relative to equity capital.
Table 15 U.s. Bank Claims on Non-Opec LDCs
All Banks 9 Major 15 Major All Other Total Claims of U.S. Banks ($
Bill.)
1978 52.5 33.4 9.9 8.9 1982 101.9 61.5 20.6 19.8 1985 100.9 63.5 19.8 16.9 Percent of Capital 1978 110 163 107 57 1982 154 227 162 75 1985 99 156 99 41
Source: Federal Reserve
Three conclusions emerge from Table 15. First, debt is a "big bank" problem. More that 60 percent of total debt is owed to the major money center banks, and nearly 85 percent to only 25 major banks. Second, small banks have managed to to reduceng their claims over the past three years by 15 percent. Third, all banks and in particular the money center banks have been able to reduce their exposure measured as a percent of capital. The exposure reduction has occurred primarily via a build—up of capital, in part by issueing equity commitment notes. But in part the exposure reduction is due to sell—off of loans, write—downs, and simply due to a slowdown or actual halt in new money commitments.
To judge the implications of LDC problem debts for the banking system we look in Table 16 at the group of most heavily indebted countries. For simplicity we take all of Latin America (including Venezuela) plus Nigeria, Phillipines, Morocco and Yugoslavia. The total exposure in 1985 was close to $100 billion and approximately 90 percent of bank capital. Thus, in the
extreme situation of all these debtors repudiating their debts completely bank stock holders would be largely, though not altogether, wiped out while
depositors are left fully intact. That picture is more favorable than much of the public discussion of the 'IDC debt bomb' might lead one to believe. Of course, this point holds only in the aggregate and thus is not very revealing. The more revealing comparison disaggregates by bank size. In this case it becomes apparent that their exposure is far in excess of their equity. Brazil, Argentina and the Phillipines alone (to take the 1987 major confrontation cases) account already for more than half of the capital of major banks.
Table 16 U.S. Bank Exposure to Problem Debtors: 1985a (Billion $ and Percent of Capital)
All Banks 9 Major 15 Major All Other (Billion $)
Latin
America 80.4 60.5 16.0 15.2 Other Debtors 12.6 8.8 1.9 1.2 (Percent of Capital) Latin America 78.9 148.6 80.0 36.9 Other Debtors 12.3 21.7 9.5 2.9Source: Federal Reserve
The second point worth noting is that even Latin America's debt is to a large extent held by non—U.S. banks. The Bank for International Settlements reports Latin American debt to banks in the reporting countries of $160
billion in 1985. Table 18 shows that only about one half of that debt is owed to US banks. For the remaining problem debtors the BIS total is $37 billion. In their case the U.S. loans are thus only one third of the total of exposure to banks in the U.S. and elsewhere.17
'7See Bank for International Settlements International Banking and Financial Markets Developments, October 1986.
There is an important difference, though, between European and US banks. During the period of dollar appreciation European banks were forced to increase their reserves against dollar loans. Furthermore these loan
provisions were facilitated by tax advatages. Since 1985 the dollar has depreciated significantly and this has worked to further increase European loan loss reserves relative to their claims. As a result European banks are said to have, in some instances, been able to set aside loan loss reserves to fully cover problem debts. This, of course, is far from being the case for U.S. banks.
The Quality of Debts:
In the 19th century and until World War II, LDC debt mostly took the form of bonds traded on organized markets and widely held by the public. The post—war debt, by contrast, is owed to official institutions and commercial banks. Accordingly there are no good price quotations that might be used as a measure of the qualtity of debts. Very little of claims on debtor LDCs takes the form of bonds.18 But for some time bank claims on various LDCs have been swapped between banks, sold outright between banks, and are now even being sold to non-banks. The market has become central to discussions of debt—equity swaps. In these transactions, further discussed below, purchase of discounted debt is the starting point for a foreign investment in a debtor country.
Table 17 shows the average of the bid and offer price in the secondhand market. It would be a mistake to believe that all debts are
'8There are a few public sector bonds oustanding. Edwards (1985) and Dornbusch (1986) look at the yields of Mexican, Argentine, Venezuelan and Brazilian bonds.
actively traded. But even so the prices provide some indication of market valuation.
Table 17 Market Price of Problem Debt: December 1986 (Billion $ and cents per dollar)
Country Total Debt Debt to US Banks Pricea
Argentina 50.8 8.4 66.0 Bolivia 4.0 0.1 7.5 Brazil 107.3 22.2 75.5 Chile 21.0 6.5 68.0 Colombia 11.3 2.2 86.5 Ecuador 8.5 na 65.5 Ivory Coast 8.0 0.4 77.0 Mexico 99.0 24.2 56.5 Morocco 14.0 0.8 69.5 Nigeria 19.3 0.9 39.0 Peru 13.4 1.5 19.0 Philippines 24.8 5.1 73.5 Uruguay 3.6 0.9 66.5 Venezuela 33.6 9.7 74.5 Yugoslavia 19.6 2.2 79.0 Weighted Average 67.1
aAverage of bid and offer price in cents per dollar debt. Source:Dealer Information
There are quite extraordinary divergences in prices. Bolivia, Peru and Nigeria have low valuations. But perhaps more interesting is the difference between Mexico and Brazil. Why is Brazil thought to be a so much better credit risk than Mexico? The major difference would have to be between being an
exporter and an importer of oil. The average price of problem debts is 67 cents per dollar. Discounts of 25 percent and more, suggests that these are indeed problem debts, and that the prospect of a return to voluntary lending might be very remote.
However, story is not that simple. Consider the case of Uruguay. The country's debt stands at a discount of 23.5 percent, suggesting that the debt is poor. Yet, in the fall of 1986 Uruguay issued a long-term public sector bond at the same rate as the U.S. Treasury. This would suggest that the large discounts reflect above all a market that is too narrow, so that it is
illiquidity of banks which dominates in depressing the prices.
6. US TRADE EFFECTS OF THE DEBT CRISIS
There is considerable difficulty in allocating the deterioration of the U.S. external balance between competing causes: the overly strong dollar, the rapid domestic growth relative to that abroad, the budget deficit, and the turn around forced on debtors' trade balances by the need to service external debts.
Table 18 gives some indication of the shift in our trade with Latin America. Not all of this can be attributed to the debt crisis since our loss in competitiveness must certainly account for some part of what happened. It is also true that the trade figures of the early 1980s are inflated by Latin America's overvaluation and spending spree. But even so it is quite apparent
that there was a major shift in the bilateral balance amounting to $lO—12 billion from 1979 to 1985.'
19The change in the bilateral trade balance in manufactures is more significant than the change in the total bilateral trade balance. The reason is that declining oil and commodity prices reduce our import bill and hence are reflected in a smaller change of the total balance.
Table 18 U.s. Trade with South America (Billion $U.S.)
Exports Imports Trade Balance
1979 13.6 13.2 0.4 1980 17.4 14.4 3.0 198]. 17.7 15.5 2.2 1982 15.3 14.4 0.9 1983 10.5 16.0 —5.5 1984 11.0 21.0 —10.0 1985 11.0 20.9 —9.9
Source: Survey of Current Business
It is interesting to compare the evolution of Latin American trade with different countries, to compare what happened with the U.S. This is done
in Table 19. The table shows a substantial shift toward bilateral surpluses with respect to each of these groups. While the surplus with the US is far
larger in absolute terms, this is not the case when the change is expressed relative to exports. This is a crude way of illustrating that the dollar appreciation may not be so dominant in this bilateral trade balance swing.
Table 19 Latin America's Bilateral Trade Balance with Various Groups (Billion $)
U.S.
Japan EEC Industrial Countries1980 —3.4 —2.4 2.8 —4.2
1985 10.8 0 7.7 18.7
Change as
% of Exports 42.9 54.8 20.8 35.1
If $10 billion is taken as the change in the bilateral trade balance then, even attributing all of this to the debt crisis, one does not come up with much damage to the U.S. After all, this is less than a quarter of 1 percent of U.S. GNP! Of course, this does not exhaust the damage and GNP is not the proper scale variable. Other damage to U.S. trade and investment interests occur via the depression of demand and profitability in the debtor countries. U.S. multinationals who produce in in those countries have sharply reduced sales and profits. Similarly there are declines in US exports of services (other than interest) to debtors. There are no ready estimates of losses in service exports.
In judging whether a $10 billion deterioration in the trade balance is a large one must bear in mind two points. First, the swing in the trade
deficit helps facilirate a non—inflationary absorption of our budget deficit. Switching lending from LDCs to the US Treasury helps finance our own deficits under better (short—term) macroeconomic conditions. But there is clearly a cost for the affected industries. A large share of the trade deterioration, for example is in the capital goods sector as Latin Americas decline in investment reduced our exports. For this sector the trade deterioration with Latin America is, of course, far above the one quarter of one percent of income. But even so it would be difficult to make the debt crisis the main reason for our $150 billion trade problem.
7. SOLUTIONS TO THE DEBT PROBLEM ?20
The ordinary aftermath of imprudent borrowing and adverse
international conditions, as in the 1920s and 1930s most recently, is to cause debt default. Debts are normally written down, or simply not serviced for many years. When sevicing is ultimately resumed this occurs without full payment of
arrears and often at reduced interest rates.
The major differences in the present debt crisis are two. The first is that commercial banks and governments, rather than bond holders, are the main creditors. A more significant difference is the fact that the governments of the major industrialized countries have insisted on debt service and have managed a system of debt collection, with the IMF as the chief coordinating agent. The system avoids illiquidity by making available essential "new money" at profitable spreads over the cost of funds to banks, and it enforces the debts by behind—the—scenes political pressure. The creditors are efficiently organized in this case by case approach while debtors have been unable to put up a united front.2'
The debtors' problem, especially in the case of Latin America, is how to gain debt relief or additional credit, so as to make available resources for investment and develop speculation in support of the government's ability to promote growth policies without risking financial instability. Tax reform and improved tax enforcement is certainly of overriding importance in this. Improved efficiency in the public sector is important, but measures to attract
20For an extensive discussion of solutions see Lessard and Williamson (1985).
21The Mexican settlement forced the commercial banks to put up an unexpectedly large contribution. The settlement has demonstrated that the debt problem is not dead at all but also that government involvement might become a boomerang.
capital or secure relief on the external debt seem the most desirable or practicable alternatives. We review here five possible directions of change: an improved world macroeconomy, a facility, debt-equity swaps, a reversal of capital flight, and Bradley—style debt—relief.
The World Macroeconomy
In 1982 the prospects of strong growth in the industrialized
countries, lower interest rates, a weaker dollar and stronger real commodity prices were the central scenario which encouraged the "muddling through
process". This favorable scenario implied that by the end of the decade debt— export ratios would have declined significantly. Some of these developments have in fact occurred, and for some countries they have even been reinforced by an unexpectedly large decline in the oil price. But the expected benefits in terms of enhanced creditworthiness have not in general appeared. It is true that South Korea is certainly at present not a problem debtor, but Brazil clearly is and so are many other countries.
Looking ahead to the next few years, what macroeconomic developments can be expected and how will they affect the debt situation? The most
important development for the world economy is US budget balancing. There are basically three scenarios. In one case rapid budget cutting is accommodated by monetary expansion in the U.S. and in the rest of the world. In this setting
interest rates decline sharply, growth is sustained and the main exchange rates between industrial countries remain unaltered. This is a highly
favorable scenario for LDCs in that much lower interest rates implicitly transfer to them resources in amounts far in excess of what can be expected from creditor country taxpayers.
The second scenario envisages the same budget cutting, perhaps more spread out in time, but without monetary accommodation. In that case interest rates decline, somewhat but there will be a world recession. Most debtors would not benefit, or at least very little, since the lower interest rates are offset by slack in their export markets.
A third scenario envisages a hard landing: budget cutting and a flight from the dollar that forces the Federal Reserve to raise interest rates to stem the inflationary impact of depreciation. Such a development would certainly bring about systenwide illiquidityy and likely default.
The world macroeconomy does hold out some promise. A Gramin—Rudman— Hollings budget cut, soon and with worldwide monetary accommodation, would make a major advance toward solving the debt problem. But for the time being there is not much of a sign of either the budget cutting or the monetary acconmodat ion.
Debt-Equity Swaps:
The debt problem has two aspects. The first is that debtors cannot service their debts as contracted. Moreover, the interest they pay comes largely at the expense of much needed investment in their economies. Thus debtors have a resource and investment shortage. On the lenders side small banks are tired of the acrobatics involved in debt collection. They want to avoid yet another round of rescheduling. But there is no money in the
debtor countries to pay them off, nor can the large banks do so, given their already extravagant exposure. These twin problems strain the skills of
The poor quality of LJDC loans can be judged by the discount at which they trade in the emerging second—hand market. The large discounts suggest that an imminent return to voluntary lending is highly unlikely. Creditors' attention is therefore shifting to new ways of liquidating debts without taking outright and massive losses on the entire portfolio. But if banks are to get out, who will get in?
Debt—equity swaps have emerged as a seemingly attractive solution to the debt problem. Clearly not the solution, but a sound contribution with all the rings of free enterprise.22 Their apparent merit is in solving two
problems at once: they allow banks to sell off loans without a massive decline in loan prices, debtors can reduce their external debt and at the same time pull in foreign investment. All things considered, they appear to be a good
idea. But there are reasons for scepticism. Before turning to these
objections, a qualification is important. There should be no doubt that debt— equity swaps agreed between private firms and their commercial bank creditors (without government intervention or subsidies) are entirely appropriate. Likewise there cannot be any objection to direct foreign investment. On the contrary, there should have been more in the past, and the more there is in the future the better. The objections raised here concern exclusively the use of an already strained debtor budgets to grease the wheels.
The basic difficulty is that debt—equity swaps amount to a budget subsidy by debtor countries that will let banks get out and foreign investors get in. Here are the mechanics: First Regional Bank sells Brazilian government bonds at a discount to Dreams, Inc., a U.S. firm specializing in services.
22For a strong statement of support for debt-equity swaps see the Morgan Guaranty World Financial Markets issue of September 1986.
Dreams,Inc. presents the debt to the Banco Central do Brasil to be paid off in cruzados. The proceeds are used for the purchase of a Brazilian firm. It seems that everybody gains: the bank has found a way of selling some its illiquid portfolio without depressing the second-hand market the investing firm gains the advantage of buying cruzados at a discount and Brazil gains because she can pay the foreign debt in local currency rather than in dollars. Moreover, much needed investment takes place.
The debtor government will have to finance the repurchase of debt from the foreign investor. One cannot simply print local money to pay. In fact the government will issue domestic debt and use the proceeds tobuy back its
foreign debt as it is presented by the foreign investor. Hence, when
everything is done, the government has a reduced external debt, but a matching increase in domestic debt. The country owns less of its capital stock, since the foreign investor will have bought some, and in return has redeemed some of its external debt.
Is there any advantage for the budget? In the budget there will now be reduced interest payments on external debt offset by increased domestic debt service. There is a net reduction in interest if the debtor country can appropriate most of the discount at which the external debt is traded and if the real domestic interest rate (in dollars) is not too high relative to the cost of servicing the external debt. The net result is likely to be an
increase in debt service, because real interest rates in debtor countries are exceptionally high.
On the balance of payments side, however, swaps might seem to be good news: foreign debt is reduced and as a result burdensome interest payments to
abroad come down. But the reduced external interest payments are matched, at least potentially, by increased remittances of dividends or profits by the new foreign owners of the national capital stock. Hence, on the payments side the trick also does not do much good. In fact, the country becomes less liquid since it is much easier to control the service of bank debt than the
remittances of multinationals. The massive outflow of remittances from Brazil in 1986 makes this point.
Debt-equity swaps are primarily a balance sheet operation, not a net rersource transfer. One might argue that the government could target deals to make them less a transaction in existing assets and instead be directed toward new, extra investment. 1ore likey, financial intermediaries will look for firms, domestic or foreign, who are already investing. They will approach them with a new kind of financing package involving debt—equity
swap which, because of an implicit subsidy by the government turns out to be less costly than alternative sources of finance. Thus debt—equity swaps will finance investment, but they finance at the budget cost of a subsidy investment that would have taken place anyway. This explains the reluctance of debtor
countries to plunge into the scheme.
Debt equity swaps bring together, with the glue of budget pesos, two entirely separate operations that would arise in a free, unregulated market. To solve the banks' problem, marking—to-market of LDC debts would occur and hence debts could be sold to the non-bank public. To cope with the resource problem debtor countries would set up investment funds in which non-residents can invest in the private economy with liberal facility for repatriation of dividends. The two separate steps assure that old, bad debts do not prevent
new investment. The bad debts are distributed more widely, though at a possible loss to all banks' stock holders. The debtor countries gain extra resources which they nay use to expand investment or to buy back their debt, whichever appears more profitable. This is the market solution. Debt—equity
swaps, by contrast, are a way of nationalizing the transaction, pushing budget subsidies to bank stock holders rather than to extra investment.
Balance sheet trick are not a substitute for gaining extra real
resources for investment. Improved government budgets in the debtor countries, increased private saving, increased efficiency in their public sector and net resource transfers from abroad are the only way for investment and growth to return. Of course, debtor countries should open all doors to foreign direct investment—— the sooner ans wider, the better. But there is no justification for subsidizing such investment.
Reversal of Capital Flight:
Wishful thinking turns to the $100 billion or more of Latin American assets that have fled from financial instability and taxation to the
industrial countries, especially the U.S. Reversing these capital flights, primarily in the case of Mexico or Argentina, would make it almost possible to pay off the external debt. The reason is that much of the debt was incurred in the first place to finance the exodus of private capital.
Estimates of the amount of capital fliught in the 1970s and early 1980s differ widely. But whatever the methods by which the magnitudes are estimated, the fact of at least a $100 billion capital flight from Latin America is not in question. Estimates are particulary large for Mexico,