EVALUATION OF AGGREGATES FOR BASE COURSE CONSTRUCTION
FINAL REPORT
Sponsored by the Florida Department of Transportation State Contract No. B-9886
WPI 0510753
DEPARTMENT OF GEOLOGY
COLLEGE OF LIBERAL ARTS AND SCIENCES AND
DEPARTMENT OF CIVIL ENGINEERING
ENGINEERING & INDUSTRIAL EXPERIMENT STATION COLLEGE OF ENGINEERING
UNIVERSITY OF FLORIDA
Dr. Guerry H. McClellan Principal Faculty Investigator Dr. Byron E. Ruth and Dr. James L. Eades
Faculty Co-Investigators Kendall B. Fountain
Gary Blitch
Graduate Student Investigators
ACKNOWLEDGMENTS
This report, entitled “Evaluation of Aggregates for Base Course Construction”, was prepared in cooperation with the State of Florida Department of Transportation (FDOT) and the Federal Highway Administration (FHWA) as required by State Contract No. B-9886, WPI 0510753. We wish to gratefully acknowledge their financial support of this research investigation. The authors also wish to acknowledge the staff of the State Materials Office, FDOT, Gainesville, for their technical support, materials, testing, and cooperation throughout this research investigation. We are indebted to these colleagues.
Research was performed at the Department of Geology and Department of Civil Engineering, University of Florida, and at the State Materials Office, FDOT, Gainesville. The research program was under the general administration of Mr. Thomas Malerk, State Materials Engineer. The project manager was Mr. John Shoucair of the State Materials Office, FDOT, Gainesville. The project leader and director was Dr. Guerry H. McClellan.
The opinions, findings and conclusions expressed in this publication are those of the authors and not necessarily those of the State of Florida Department of Transportation or the U.S. Department of Transportation.
TABLE OF CONTENTS
ACKNOWLEDGMENTS ______________________________________________________ ii TABLE OF CONTENTS _______________________________________________________ iii LIST OF TABLES _____________________________________________________________v LIST OF FIGURES__________________________________________________________ vii EXECUTIVE SUMMARY______________________________________________________ ix INTRODUCTION ____________________________________________________________ 1 Objectives_________________________________________________________________ 3 Results ___________________________________________________________________ 3 TESTING AND EVALUATION OF LIMEROCK BEARING RATIO AND MOISTURE-DENSITY DATA _____________________________________________________________ 5
Materials, Test Specimen Preparation, and LBR Testing (Part 1) __________________ 5 Analysis of Variables Affecting LBR Values (Part 1) ____________________________ 10 Untreated Aggregates _____________________________________________________ 10 Treated Aggregates _______________________________________________________ 18 Materials, Test Specimen Preparation and LBR Testing (Part 2) __________________ 24 Analysis of Variables Affecting LBR Values (Part 2) ____________________________ 29 Untreated Aggregates _____________________________________________________ 29 Treated Aggregates _______________________________________________________ 37 TRIAXIAL SHEAR TESTS, RESULTS AND ANAYSIS ____________________________ 43 Test Specimen Preparation and Testing _______________________________________ 43 Test Results and Analyses __________________________________________________ 43 TRIAXIAL RESILIENT MODULUS TESTS, RESULTS AND ANALYSIS_____________ 48 Test Specimen Preparation and Testing _______________________________________ 48 Test Results and Analyses __________________________________________________ 48 Analysis of Variables Affecting MR Values ____________________________________ 60 Untreated Aggregates _____________________________________________________ 60 Treated Aggregates _______________________________________________________ 62 ANALYSIS OF DATA COMBINED WITH PREVIOUS FDOT RESILIENT MODULUS TRIAXIAL TEST RESULTS __________________________________________________ 69
Methods of Data Analysis___________________________________________________ 69 Discussion of Results_______________________________________________________ 69 GYRATORY TESTING, DATA ANALYSIS AND COMPARISONS ___________________ 74 Relationships between GS and Φ_____________________________________________ 81
Relationships between GS and MR____________________________________________ 81 TESTING AND EVALUATION OF RAPID PROCEDURES TO DETERMINE
RECEMENTATION POTENTIAL _____________________________________________ 86 Materials, Test Specimen Preparation and UCT Testing _________________________ 86 Test Results and Analyses __________________________________________________ 87 CONCLUSIONS AND RECOMMENDATIONS___________________________________ 89 Limerock Bearing Ratio (LBR) ______________________________________________ 89 Triaxial Shear ____________________________________________________________ 89 Triaxial Resilient Modulus (MR) _____________________________________________ 90 Gyratory Shear (GS) Testing ________________________________________________ 90 Development of MR and a2 Predictions ________________________________________ 90 Unconfined Compression Test (UCT)_________________________________________ 90 Summary of Conclusions ___________________________________________________ 91 REFERENCES _____________________________________________________________ 92 APPENDICES ______________________________________________________________ 93
APPENDIX A: MODIFIED PROCTOR MOISTURE-DENSITY DATA FOR
UNTREATED AND TREATED BASE COURSE AGGREGATES (PART 1) _______ 93 APPENDIX B: MODIFIED PROCTOR MOISTURE-DENSITY DATA FOR
UNTREATED AND TREATED BASE COURSE AGGREGATES (PART 2) _______ 96 APPENDIX C: RESULTS FROM TRIAXIAL SHEAR TESTS __________________ 99 APPENDIX D: STRESS-STRAIN CURVES FROM TRIAXIAL SHEAR TESTS FOR MODULUS COMPUTATIONS ____________________________________________ 112 APPENDIX E: TEST DATA AND ANALYSES FOR REPEATED LOAD TRIAXIAL RESILIENT MODULUS __________________________________________________ 125 APPENDIX F: RESULTS FROM UNCONFINED COMPRESSION TESTS ______ 297
LIST OF TABLES
Table Page
1 Standard FDOT specifications for materials used in base course construction ……..1 2 Composition and optimum moisture contents for base materials (Part 1) ……..5 3 Lithology and mineralogy of base course materials (Part 1) ……..6 4 LBR values of untreated and treated aggregates (Part 1) ……..6 5 Bivariate correlation matrix for untreated aggregate samples (Part 1) ……12 6 LBR linear regression models for untreated aggregate samples (Part 1) ……14 7 Comparison of measured and predicted LBR values – untreated (Part 1) ……16 8 Bivariate correlation matrix for treated aggregate samples (Part 1) ……19 9 LBR linear regression models for treated aggregate samples (Part 1) ……21 10 Comparison of measured and predicted LBR values – treated with 1.0 percent
lime (Part 1) ……22
11 Composition and optimum moisture contents for base materials (Part 2) ……24 12 Lithology and mineralogy of base course materials (Part 2) ……25 13 LBR values of untreated and treated aggregates (Part 2) ……25 14 Bivariate correlation matrix for untreated aggregate samples (Part 2) ……31 15 LBR linear regression models for untreated aggregate samples (Part 2) ……33 16 Comparison of measured and predicted LBR values – untreated (Part 2) ……35 17 Bivariate correlation matrix for treated aggregate samples (Part 2) ……38 18 LBR linear regression models for treated aggregate samples (Part 2) ……40 19 Comparison of measured and predicted LBR values – treated with 1.0 percent
lime (Part 2) ……41
20 Summary of shear strength parameters from triaxial tests ……44 21 Tangent moduli derived from triaxial shear tests ……47 22 Mean triaxial resilient modulus test results for both untreated and treated base
course samples at 20 psi confining horizontal stress ……49 23 Regression equations derived from triaxial MR tests for Pit No. 36-246 ……52
24 Regression equations derived from triaxial MR tests for Pit No. 70-279 ……53
25 Regression equations derived from triaxial MR tests for Pit No. 56-465 ……53
26 Regression equations derived from triaxial MR tests for Pit No. 17-091 ……54
27 Regression equations derived from triaxial MR tests for Pit No. 93-406 ……54
28 Regression equations derived from triaxial MR tests for Pit No. 26-001 ……55
29 Regression equations derived from triaxial MR tests for Pit No. 58-486 ……55
30 Regression equations derived from triaxial MR tests for Pit No. MX411 ……56
31 Regression equations derived from triaxial MR tests for Pit No. AL-149 ……56
32 Moisture-density of resilient modulus test specimens 36-246 and 70-279 ……57 33 Moisture-density of resilient modulus test specimens 56-465, 17-091, 93-406
and 26-001 ……58
34 Moisture-density of resilient modulus test specimens 58-486, MX411 and
AL-149 ……59 35 Result of regression analyses for Pit Nos. 36-246 and 70-279 assuming no
36 MR correlation matrix for untreated aggregate samples ……61
37 MR correlation matrix for treated aggregate samples ……63
38 MR (internal) linear regression models for treated aggregate samples ……65
39 Comparison of measured and predicted MR values (psi) – treated ……66
40 Prediction of MR values @ Θ = 50 psi ……70
41 Typical values of Θ for base course ……70 42 Resilient moduli for different limestones ……71 43 Prediction of MR values @ Θ = 20 psi ……72
44 AASHTO base and subbase coefficients for limestone aggregates ……72 45 AASHTO base and subbase coefficients for bank-run shell ……73
46 GTM dry density results ……75
47 Results of regression analyses ……79
48 Summary of gyratory shear results ……80 49 Comparative analyses of Gs and Φ ……82
50 Relationship between Gs and Φ ……83
51 Gs and MRdata at 14-days ……83
52 a2 predictions from Gs ……85
53 Unconfined compression test results ……88 A-1 Modified proctor moisture/density data for untreated base course aggregates
(part 1) ……94
A-2 Modified proctor moisture/density data for lime treated base course aggregates
(part 1) ……95
B-1 Modified proctor moisture/density data for untreated base course aggregates
(part 2) ……97
B-2 Modified proctor moisture/density data for lime treated base course aggregates
LIST OF FIGURES
Figure Page
1 Plot of LBR data for untreated base course materials (Part 1) ……..8 2 Plot of LBR data for treated base course materials (Part 1) ……..8 3 Plots illustrating the differences in LBR test results between untreated and
treated base course materials (Part 1) ……..9 4 Scatter plot of strength change and carbonate content illustrating the relationship
between curing time and the strength difference observed for treated versus
untreated samples (Part 1) ……10
5 Scatter plots of variables thought to affect LBR test results of untreated aggregate
samples (Part 1) ……13
6 Scatter plot of LBR and dry density illustrating the relationship between pit
source and location on the plot for untreated aggregate samples (Part 1) ……15 7 Prediction plot of LBR value as a function of carbonate content for untreated
aggregate samples (Part 1) ……17
8 Scatter plots of variables thought to affect LBR test results of treated aggregate
samples (Part 1) ……20
9 Prediction plot of LBR value as a function of carbonate content for treated
aggregate samples (Part 1) ……23
10 Plot of LBR data for untreated base course materials (Part 2) ……27 11 Plot of LBR data for treated base course materials (Part 2) ……27 12 Plots illustrating the differences in LBR test results between untreated and
treated base course materials (Part 2) ……28 13 Scatter plot of strength change and carbonate content illustrating the relationship
between curing time and the strength difference observed for treated versus
untreated samples (Part 2) ……29
14 Scatter plots of variables thought to affect LBR test results of untreated aggregate
samples (Part 2) ……32
15 Scatter plot of LBR and minus #4 illustrating the relationship between pit
source and location on the plot for untreated aggregate samples (Part 2) ……34 16 Scatter plot of LBR and dry density illustrating the relationship between pit
source and location on the plot for untreated aggregate samples (Part 2) ……34 17 Prediction plot of LBR value as a function of carbonate content for untreated
aggregate samples (Part 2) ……36
18 Scatter plots of variables thought to affect LBR test results of treated aggregate
samples (Part 2) ……39
19 Prediction plot of LBR value as a function of carbonate content for treated
aggregate samples (Part 2) ……42
20 Plot of cohesion (C) versus curing time for both untreated and treated base
course materials from Pit Nos. 36-246 and 70-279 ……45 21 Plot of angle of internal friction (Φ) versus curing time for both untreated and
treated base course materials from Pit Nos. 36-246 and 70-279 ……45 22 Plot of the percentage change in cohesion (C) and angle of internal friction (Φ)
versus curing time for base course materials from Pit Nos. 36-246 and 70-279 ……46 23 Plot of triaxial resilient modulus (MR) data as a function of curing time for
Pit Nos. 36-246 and 70-279 (untreated and treated samples) ……50 24 Scatter plot of MR change (internal) and carbonate content illustrating the
relationship between curing time and the strength difference for treated versus
untreated samples ……50
25 Scatter plot of MR change (external) and carbonate content illustrating the
relationship between curing time and the strength difference for treated versus
untreated samples ……51
26 Comparison of predicted resilient moduli for Pit Nos. 36-246 and 70-279 ……60 27 Scatter plots of variables thought to affect triaxial resilient modulus test results
of untreated aggregate samples ……62
28 Scatter plots of variables thought to affect triaxial resilient modulus test results
of treated aggregate samples ……64
29 Prediction plot of MR (int.) value as a function of carbonate content for treated
aggregate samples ……67
30 Prediction plot of MR (ext.) value as a function of carbonate content for treated
aggregate samples ……68
31 Average MR versus Θ and σ3 ……73
32 Gyratory shear strength for Pit No. 36-246 ……76 33 Gyratory shear strength for Pit No. 70-279 ……76 34 Gyratory shear strength for Pit No. 56-465 ……77 35 Comparison of gyratory shear trends for aggregates from Pit Nos. 36-246,
70-279, and 56-465 ……78
EXECUTIVE SUMMARY
An investigation of limestone base course aggregates was performed to ascertain if strength and stiffness changes in carbonate aggregates could be evaluated for the purpose of quantifying their effects on the base structural layer coefficient (a2) used in pavement design. One of the
goals of this approach was to develop a laboratory test or series of tests, which the FDOT might use to quantify or predict strength and stiffness gains, that could be generally applied to a range of materials types given field operating conditions. Materials of varying carbonate content were selected, prepared at optimum moisture content and compacted by modified proctor for testing at different ages after curing by two methods (soak and moisture room). Replicate specimens were prepared with 1.0 percent lime and tested for the purpose of accelerating cementation or
modifying clay contained in the aggregate to simulate observed increases in field based strength performance. Limerock Bearing Ratio, cohesion and angle of internal friction, triaxial resilient modulus (MR), and gyratory shear (Gs) tests were performed and evaluated.
Based on the data accumulated with this study, carbonate content does not necessarily relate to higher strength gain. This does not mean that high carbonate content materials cannot achieve cementation and greater strength, rather that the series of tests included in this report were unable to quantify and/or accurately reproduce the effect of cementation within a curing time of 60 or less days. However, it does suggest that use of a higher layer coefficient for high carbonate aggregates strictly based on percent carbonates may not be appropriate.
Several key complications in ascertaining the relationship between carbonate content and potential strength gain were identified as a result of this study. First, the use of the term
carbonate content alone as an aggregate descriptor is problematic. Variations in aggregate carbonate mineralogy (low-Mg calcite, high-Mg calcite, aragonite, and dolomite) and
crystallite/particle size among the various lithologies used in this study should have a significant impact on cementation potential, based on both kinetic and thermodynamic constraints. As a result, in order to fully ascertain the importance of aggregate carbonate content to strength gain potential, aggregates may need to be evaluated on a lithological basis, as the character of carbonate mineralogy varies among the aggregate sources employed as base course in Florida. Second, test variables other than carbonate content were found to have a major impact on strength gain, particularly dry density (γd) and aggregate gradation, impacting test ability to
elucidate the role of carbonate content. Lastly, poor test precision added further to the difficulty in identifying a relationship, if any, between carbonate content and strength gain in the materials tested.
Lime addition (1.0 percent) produced both increases and decreases in strength-associated properties depending upon the material source. Results also varied among the different tests employed with this study for individual sources, and under different curing conditions. Triaxial MR values gave a fairly consistent range in values. Computation of a mean layer coefficient
from the MR of the different aggregates indicated that an average a2 value of 0.18 was typical for
both limestone and bank-run shell aggregates. A relationship between Gs and MR was developed
to facilitate the computation of a2 using Gs data.
An attempt was made to develop a rapid and practical method to accelerate cementation of base course materials in order to predict increases in field-based strength. Both untreated and treated (1% hydrated lime) samples from several pit locations, representing both high carbonate and low carbonate aggregate sources were prepared using a variety of experimental procedures, and then tested using an unconfined compression test in order to determine the unconfined shear
strength of the materials. Although it was believed that a controlled environment of some combination of variable humidity and variable CO2 pressure would result in the conditions
necessary to accelerate cementation, the experiments failed to produce the desired results. Apparently, we have been unable to mimic the proper natural field conditions over a short time span that will accelerate the increases in observed field-based strength performance.
INTRODUCTION
Research into the characterization of carbonate materials used for highway construction in Florida is of great interest to the Florida Department of Transportation (FDOT). As new quarry locations are opened, and new materials are used, it becomes more and more important to carefully monitor these materials to insure that proper specifications are being met. Recent studies of base course materials have been one of many areas of focus. The research outlined in this report was undertaken to evaluate the engineering properties of limestone base course materials for the potential assessment of their structural properties for use in pavement design.
The FDOT requires that aggregates to be used for base course meet the following
specification requirements for approval with designated layer coefficients as outlined in Table 1.
Table 1. Standard FDOT specifications for materials used in base course construction MATERIAL TYPE STANDARD SPECIFICATION MINIMUM LBR MINIMUM CARBONATES (%) LAYER COEFFICIENT (STD. INDEX) Limerock 911 100 70 0.18 Shell 913 100 50 0.18 Shell-Rock 913A 100 50 0.18 Cemented Coquina 915 100 45 0.18 Graded Aggregate 204 100 0 0.15
In 1961, the AASHO Committee on Design of Flexible Pavements first proposed structural layer coefficients for base course materials (Zimpfer et al., 1973). These coefficients, adopted at the time by the FDOT, were based on the AASHO Road Test, which began in 1958, and used local Illinois base materials for the study. As part of the recommendations of the AASHO Committee on Design, utilization of satellite test pavements by the states was suggested as a means of supplementing and adjusting the AASHO Road Test findings to local conditions. During the 1960's many states followed this suggestion, including Florida (Schrivner and Moore, 1968). Zimpfer et al. (1973) were the first to point out that a combination of (1) AASHO
coefficients, (2) Florida satellite studies, (3) field performance studies, (4) laboratory and test pit studies, and (5) research by other agencies was most likely required to develop reasonable estimates for structural layer coefficients that can account for environmental and material factors unique to Florida.
The AASHO Road Test coefficients initially were established as interim values based on the materials used in the study. In that study, the base materials included crushed stone, gravel, cement-treated gravel, and bituminous-treated gravel. The crushed stone base was a well-graded crushed dolomitic limestone with an approximate LBR value of 140. A structural coefficient of 0.14 was established for this material based on the AASHO Road Test. Based on a comparison of Florida limestones to the AASHO crushed limestone (Zimpfer et al., 1973), the FDOT established a layer coefficient of 0.15 for limerock materials used in the state, and a minimum LBR strength requirement of 100. This coefficient was correlated to an LBR value of 140, and
was approximately the mid-range of materials tested. Furthermore, it was recognized that the FDOT required AASHTO T-180 density requirements for limerock base course construction. A review of the approach to this conclusion is documented in Research Report 177, “Structural Layer Coefficients for Flexible Pavement Design”, August, 1973. With the concurrence of the Federal Highway Administration (FHWA), the FDOT later raised the structural layer coefficient of limerock from 0.15 to 0.18 in accordance with recommendations of a 1981 FDOT research report FL/DOT/OMR-235/81 entitled “Pavement Design Coefficients, A Reevaluation of Florida Base Materials” (Smith and Lofroos, 1981). This report studied the strength and stiffness
increase over a five, six, and nine year period of three roads constructed with limerock bases. The study showed that field plate moduli increased significantly to levels above 40,000 psi, which exceeded a structural coefficient of 0.18 denoted in the AASHO Design nomograph from NCHRP Report 128. Potential reasons for the strength and stiffness increase were suggested, but no attempt was made to establish a method of predicting these increases.
A potential problem arises because the FDOT cannot evaluate a new material and assign a layer coefficient equivalent to limerock, based on equivalent performance in the FDOT’s test pit and/or a test road section (per FDOT Procedure 675-000-004-a) without significant time delay. The decision cannot be made on the basis of the new material’s initial performance, without understanding its potential strength gain or the field conditions that may contribute to strength gain.
The issue of strength and stiffness gain also highlights the controversial issue of minimum required carbonates. It has been suggested that strength and stiffness gains may be caused by cementation of base course aggregate, and that a minimum carbonate requirement is essential to achieve this result. In fact, high carbonate content aggregates (especially, high-CaO) have for some time been known to exhibit long-term gains in strength due to cementing action (Gartland, 1979; Zimpfer, 1981; Graves, 1987). In these earlier studies, the materials used were mixtures of pure limestone (CaCO3) with varying amounts of quartz sand. However, this is not
fully representative of the various lithologies employed as base material in Florida. From the previous table (Table 1), it is evident that some disparities appear to exist between the required minimum carbonate content of various aggregates, with no clear correlation to layer coefficient. It should be noted for Table 1 that graded aggregate may use either Group 1 aggregates
(limestone, marble, or dolomite) or Group 2 aggregates (granite, gneiss, or quartzite), and as such, the minimum carbonate content of the material may be 0 % if Group 2 aggregates are employed.
Based solely on the disparities seen in Table 1, it is evident that there is a need to verify the validity of the carbonate strength gain hypothesis and to determine whether it is a relevant specification for assigning a structural number. Part of the problem with deciphering this relationship is the present terminology used with the study of high versus low carbonate base materials. The term high carbonate historically has been used by the FDOT for materials high in carbonates of calcium and/or magnesium. Whether the material in question is a limestone (CaCO3), a dolomitic limestone (CaCO3 and CaMg(CO3)2), or a dolostone (CaMg(CO3)2) will
have a significant impact on the likelihood for strength gain derived through cementation based on kinetic considerations. Furthermore, even the mineral speciation within various limestones (CaCO3 as low-Mg calcite, high-Mg calcite, and/or aragonite) should have an impact on
cementation potential for the same reason. Therefore, one must consider the source lithology of base materials in question in order to fully ascertain the likelihood for strength gain via carbonate cementation.
Currently, no laboratory tests are used by the FDOT to quantify or predict strength and stiffness gains that could be generically applied to a range of material types. There is a need to
quantify potential increase in performance characteristics of an aggregate base, and to identify the causal physical/chemical characteristic of the aggregate. There also is a need to investigate other laboratory test procedures that might be useful in supplementing the LBR test. These tests could be used on low-cohesive materials or on water-sensitive materials to estimate
constructability or durability issues to which the LBR test may not be adequately sensitive.
Objectives
1. To develop and evaluate test procedures for the evaluation of base course materials (not currently specified) based on generic, measurable engineering properties and not based on limited chemical or mineralogical criteria. These measured properties will include aggregate properties and predictions of strength gains over varying time periods using methodologies reported in the technical literature and of practical use to the FDOT. 2. To evaluate the performance of these new tests on current and proposed aggregate
sources and aggregate substitutes, including recycled products, to determine the acceptance of these materials for use as base materials in traditional roadway designs, specifically to ensure conformance to AASHTO design requirements.
3. To select materials being used or having been used in current and previous field construction projects.
Both high carbonate and low carbonate (high-SiO2) aggregates from different quarries
(pits) that conformed to FDOT base course specifications were selected for this study and tested using Limerock Bearing Ratio (LBR), triaxial shear, repeated triaxial resilient modulus (MR),
gyratory shear (GS), and unconfined compression (UCT) tests. These aggregates were prepared
with and without one (1.0) percent lime for the purpose of accelerating strength gain and/or cementation of carbonate materials. High carbonate content aggregates (both high-CaO and low-CaO) selected for the study came from both limestone lithologies (Suwannee Limestone, Ocala Limestone, Tamiami Formation, etc.) and dolostone/limestone lithologies (Avon Park
Formation), while low carbonate content aggregates (high-SiO2) came from limestone lithologies
known for a high silica sand content (Ft. Thompson Formation, Anastasia Formation, etc.).
Results
Results of the study are as follows:
(1) The test results indicated that variability in LBR values over various time periods up to 60 days impacted the analyses and consequently, dry density (γd) was the only
significant factor affecting the LBR values, primarily with the untreated samples, in Part 1 of the LBR study. In Part 2 of the LBR study, the only correlation observed with LBR data seemed to be material gradation, however, that was found to be a statistical artifact of the gradation of MX411. When MX411 was excluded from analysis, no correlation was found to exist among the Florida materials tested. Dry density was held more constant for the samples used in Part 2, and therefore was not
found to impact LBR results as much as was observed in Part 1. LBR data for treated samples (1 percent lime) from both Part 1 and Part 2 also showed the most
statistically significant correlations to gradation, although the correlations in Part 2 were again an artifact of MX411. The effect of strength gain by cementation (carbonate content versus LBR) was not statistically significant in either part of the LBR portion of this study, and no equations predicting LBR results based on carbonate content were produced which were statistically significant.
(2) Triaxial shear tests were inconclusive. The effect of time on strength gain of lime treated aggregates was minor although the lime treatment appeared to produce a small increase in angle of internal friction (Φ). Tangent moduli derived from these tests gave no indication of time dependent effects although the moduli for lime treated aggregates were in all cases slightly greater than for untreated aggregate. (3) The Resilient Moduli (MR) test results were very consistent with aging time having
no apparent effect on the test results for aggregate from all the pit locations tested. These results combined with FDOT data from prior tests on seven other aggregates were analyzed to determine AASHTO structural design coefficient a2 for sum of
principal stresses (Θ) equal to 137.9 kPa (20 psi). Values of a2 ranging from 0.15 to
0.22 were obtained which were similar to the range (0.16 to 0.23) of 10 different bank-run shell specimens.
(4) Limited tests performed using the Gyratory Testing Machine (GTM) equipped with air roller gave lower gyratory shear (Gs) strength with lime treated Pit 36-246 high
carbonate aggregate than the untreated aggregate. Conversely, low carbonate (44%) aggregate from Pit 70-279 produced higher shear strength for the lime treated aggregate. The effect of density was not apparent except for lime treated aggregates from Pit 56-465 which showed a substantial increase in shear strength with
densification. Apparently, this material most likely contained clay, which may have reacted to the lime treatment. A tentative relationship between the Gs and the MR
values was developed and used to establish a prediction equation for a2 based upon
this relationship.
(5) Unconfined compression tests (UCT) performed on both high carbonate (Pit 36-246 and Pit 56-465) and low carbonate (Pit 70-279 and Pit 93-406) materials was
undertaken as a means of developing a practical method to accelerate cementation of limestone base course materials in order to predict increases in field based strength performance. Through experimenting with a total of eleven autoclave-based treatments of prepared test specimens, it was hoped that a rapid and reliable technique could be developed. However, average failure stress values showed no correlation to either aggregate carbonate content or to the other engineering
parameters measured in this study over the short time spans tested. Untreated samples did, however, show greater strength gains in almost all experiments.
The ensuing sections of this report present the test conditions, testing procedures, analysis, and the results of the various tests conducted on base course aggregates from a variety of quarries (pits) located around the state of Florida.
TESTING AND EVALUATION OF LIMEROCK BEARING RATIO AND MOISTURE-DENSITY DATA
Materials, Test Specimen Preparation, and LBR Testing (Part 1)
For the first stage of this study (Part 1), base course aggregates from seven (7) sources (pits) were selected and used to prepare lime treated and untreated test specimens for the purpose of evaluating strength gain effects on the Limerock Bearing Ratio (LBR). Two (2) separate splits from pit 93-406 were examined in this part of the study, resulting in a total of eight (8) samples. Initially, four to five specimens, each at different moisture contents, were compacted according to AASHTO Method T-180 to establish moisture-density curves. The optimum moisture content was determined from these curves for each source (pit) of aggregate. Treated aggregate samples were prepared by the addition of one (1.0) percent of lime (by weight) prior to the addition of water. Table 2 presents basic information on the aggregate and optimum
moisture content for each source of material, while Table 3 outlines the material type, lithology, and mineralogy of the materials studied. The quantitative X-ray diffraction (XRD) data outlined in Table 3 was determined using a Rietveld refinement technique.
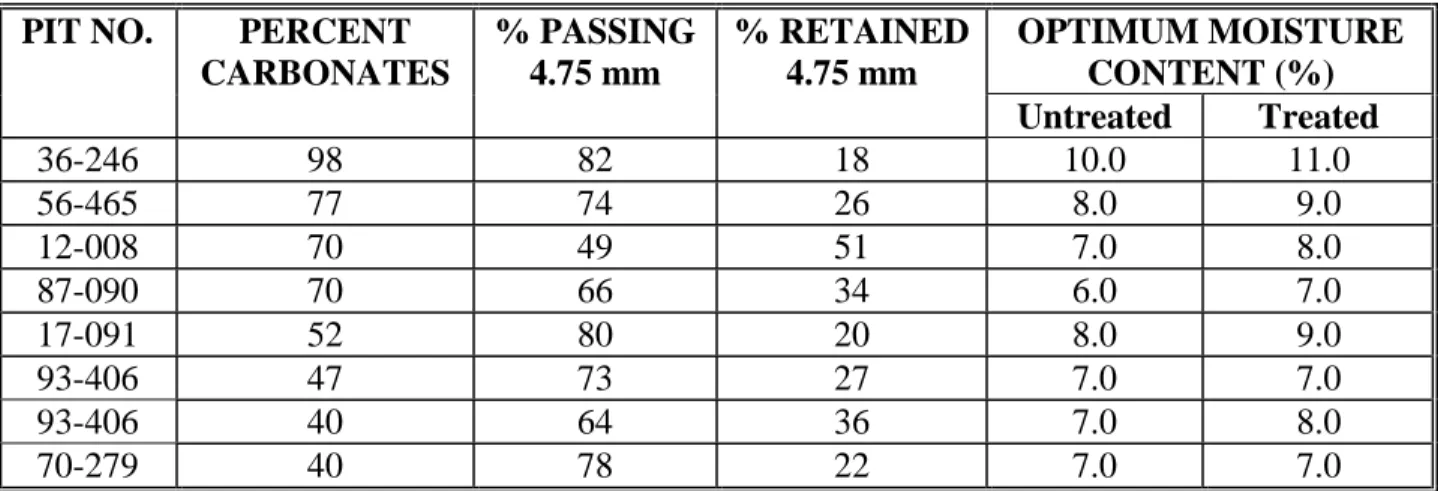
Table 2. Composition and optimum moisture contents for base materials (Part 1) OPTIMUM MOISTURE
CONTENT (%) PIT NO. PERCENT
CARBONATES % PASSING 4.75 mm % RETAINED 4.75 mm Untreated Treated 36-246 98 82 18 10.0 11.0 56-465 77 74 26 8.0 9.0 12-008 70 49 51 7.0 8.0 87-090 70 66 34 6.0 7.0 17-091 52 80 20 8.0 9.0 93-406 47 73 27 7.0 7.0 93-406 40 64 36 7.0 8.0 70-279 40 78 22 7.0 7.0
Five samples of untreated and lime treated materials were prepared for each aggregate source. Moisture-density data for the compacted LBR test samples are given in Tables A-1 and A-2 of Appendix A. The dry density (γd) values were based upon the test specimen volume,
sample weight, and moisture content after LBR testing at the different ages (3, 7, 14, 28, and 60-day).
LBR tests were initially conducted using a modification of Florida test method FM-515, for which samples were continually soaked in plain tap water during curing. Continuous soaking was performed for several reasons. This is the standard method for LBR testing used at the FDOT (although normally for 2 days), and Gartland (1979) showed that continuous soaking in plain water resulted in some of the largest strength gains compared to other methods of curing
Table 3. Lithology and mineralogy of base course materials (Part 1) PIT NO. MATERIAL TYPE FORMATION Calcite (%) Dolomite (%) Quartz (%) Aragonite (%) R (%)* 36-246 Limerock Ocala 100 --- --- --- 5.9
56-465 Limerock Avon Park 73.6 1.8 12.6 11.9 9.1 12-008 Limerock Tamiami 61.5 36.2 2.3 --- 12.1 87-090 Limerock Ft. Thompson 81.5 --- 18.5 --- 15.8
17-091 Shell Tamiami 22.2 --- 41.9 35.9 18.5
93-406 Shell-rock Anastasia 38.1 --- 37.4 24.6 34.7 70-279 Coquina Anastasia 31.2 --- 58.4 10.4 26.2 * R-values are residuals from quantitative Rietveld refinement of XRD data
Table 4. LBR values of untreated and treated aggregates (Part 1) PIT NO. (% CARB.) 36-246 (98%) 56-465 (77%) 12-008 (70%) 87-090 (70%) 17-091 (52%) 93-406 (47%) 93-406 (40%) 70-279 (40%) 3-Day: Untreated 75* (27)* 174 119 143 138 160 129 Treated 99* 158 165 199 132 138 205 140 % Change 32 485 -5 67 -8 0 29 8 7-Day: Untreated (66)* (44)* 137 124 137 135 171 122 Treated 168 178 143 210 160 155 217 165 % Change 154 305 4 69 44 15 27 35 14-Day: Untreated (50)* (12)* 150 130 122 124 196 116 Treated 166 199 199 202 150 192 186 160 % Change 232 1558 33 55 23 55 -5 38 28-Day: Untreated (71)* (6)* 173 130 114 161 169 132 Treated 165 158 232 238 179 129 233 183 % Change 132 2533 34 83 57 -20 38 39 60-Day: Untreated (57)* (29)* 119 109 153 156 150 137 Treated 174 129 256 209 163 170 215 191 % Change 205 345 115 92 6 13 43 39
involving wetting and drying cycles or CO2 treatment. Since temperature remains fairly constant
over the soaking time intervals, it was believed that carbonate material would dissolve and precipitate as cement due to changes in atmospheric pressure causing pore water CO2 partial pressures to fluctuate (Graves, 1987).
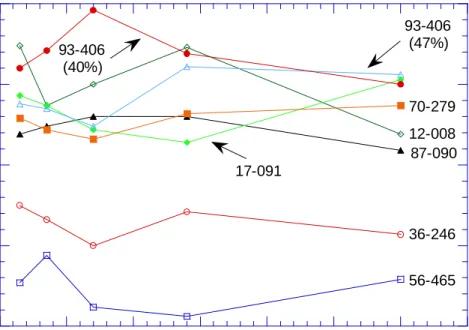
Current FDOT specifications require a minimum LBR of 100 for compacted base course materials. Test results for the untreated and treated base course aggregates at the different ages are given in Table 4. LBR values for all untreated materials except those from Pits 36-246 and 56-465 exceeded 100, and on the average ranged between 127 and 169 (Fig. 1). None of the samples exhibit any discernable trend with age. The low values for 36-246 and 56-465 may have been due to relatively low dry density/high moisture content or perhaps relatively high clay content (56-465). The dry density for these two samples averaged nearly 200 kg/m3 less than that of the other samples studied, and the moisture content averaged approximately 3% more. However, the same differences in dry density and moisture content occur with the lime treated samples, but without the poor LBR results.
As outlined by Graves (1987), addition of lime to the dry base course materials before compaction and soaking was done in an attempt to enhance cementation and therefore strength gain variation with differences in composition. Lime treated aggregates on the average varied between an LBR of 154 and 212 (Fig. 2). Treated aggregates from Pit Nos. 12-008, 87-090, and 93-406 (40% carbonates) provided the highest mean LBR values (199 to 212). Unlike the lack of any discernable trends seen with the untreated aggregates, treated samples from Pit Nos. 36-246, 12-008, 17-091, and 70-279 appear to show an increasing trend with age. However, as with 36-246, most of the increase occurs early, suggesting that cementation is completed, the lime is depleted early, or the lime acted as a modifier/stabilizing agent. For most of the materials tested, the lime treated samples consistently show higher LBR values (Fig. 3). This is particularly noted with 36-246 and 56-465. However, there appeared to be no differences between untreated and treated materials from Pit Nos. 17-091 and 93-406 (47% carbonates). This is probably due to either test variability (e.g. dry density and moisture content) or a mineralogical control. The latter explanation may be associated with the high aragonite content of 17-091 (35.9%) and 93-406 (24.6%) being the primary cementing agent, thereby limiting the lime treatment to having little additional effect.
As noted previously, the most noticeable increase in LBR values for treated aggregates occurred with materials from Pit Nos. 36-246 and 56-465. The mean LBR values for the untreated materials, as given in Table 4, were extremely low, indicating substandard quality which could be attributed to moisture-density, gradation, excessive soak time during curing, and/or mineral composition (e.g. clay content). The effect of lime treatment on the LBR values of Pit No. 56-465 aggregate was extremely high. The mean LBR values increased almost 700 percent over those for the untreated material. As will be demonstrated in a subsequent section of this report, the gyratory shear strength of the treated 56-465 material increased substantially with densification whereas the untreated material had much lower strength, which did not change appreciably with densification. Undoubtedly the lime produced the improvement in properties. It is believed that chemical interactions such as the stabilization of clay minerals altered the behavior of the aggregate from Pit No. 56-465.
A scatter plot showing strength change of treated base course samples versus carbonate content was prepared for the total data set (Fig. 4). The plot suggests that base materials with higher carbonate content show greater strength gain with lime addition, as indicated by the positive slope of the fitted linear regression curves. However, the linear regression curves exhibit fair to good correlation for 7- and 60-day curing times (R2 = 0.37 and 0.55, respectively) only, and no correlation for 3-, 14-, and 28-day curing times (R2 = 0.12, 0.17, and 0.11,
0 50 100 150 200 0 10 20 30 40 50 60 70
LB
R
CURING TIME (days)
36-246 56-465 12-008 87-090 17-091 93-406 (47%) 93-406 (40%) 70-279
Figure 1. Plot of LBR data for untreated base course materials (Part 1).
50 100 150 200 250 300 0 10 20 30 40 50 60 70
LB
R
CURING TIME (days)
36-246 56-465 12-008 87-090 17-091 93-406 (47%) 93-406 (40%) 70-279
40 60 80 100 120 140 160 180 0 10 20 30 40 50 60 70 LB R
CURING TIME (days)
36-246 (Untreated) 36-246 (Treated) 0 50 100 150 200 0 10 20 30 40 50 60 70 LB R
CURING TIME (days) 56-465 (Untreated) 56-465 (Treated) 100 120 140 160 180 200 220 240 260 0 10 20 30 40 50 60 70 LB R
CURING TIME (days) 12-008 (Untreated) 12-008 (Treated) 100 120 140 160 180 200 220 240 0 10 20 30 40 50 60 70 LB R
CURING TIME (days) 87-090 (Untreated) 87-090 (Treated) 110 120 130 140 150 160 170 180 0 10 20 30 40 50 60 70 LB R
CURING TIME (days)
17-091 (Untreated) 17-091 (Treated) 120 130 140 150 160 170 180 190 200 0 10 20 30 40 50 60 70 LB R
CURING TIME (days) 93-406 (Untreated) (47%) 93-406 (Treated) (47%) 140 160 180 200 220 240 0 10 20 30 40 50 60 70 LB R
CURING TIME (days)
93-406 (Untreated) (40%) 93-406 (Treated) (40%) 100 120 140 160 180 200 0 10 20 30 40 50 60 70 LB R
CURING TIME (days)
70-279 (Untreated) 70-279 (Treated)
Figure 3. Plots illustrating the differences in LBR test results between untreated and treated base course materials (Part 1).
CARBONATE CONTENT (%)
100 90 80 70 60 50 40 30STRENGTH CHANGE (%)
3000 2500 2000 1500 1000 500 0 -500 Curing Time 60-day 28-day 14-day 7-day 3-dayFigure 4. Scatter plot of strength change and carbonate content illustrating the relationship between curing time and the strength difference observed for treated versus untreated samples (Part 1).
respectively). This latter observation is most likely the result of the extreme LBR improvement seen with the samples from Pit No. 56-465 (77% carbonates) causing the poor curve fit.
Analysis of Variables Affecting LBR Values (Part 1) Untreated Aggregates
In an effort to define the influence of density, moisture content, gradation, and carbonate content on the Limerock Bearing Ratio (LBR) of untreated base course materials, statistical procedures were used to produce graphs of LBR versus carbonate content for use in regression analyses. As a first step in this process, a bivariate correlation matrix which included
mineralogical parameters was prepared for both untreated and treated aggregate LBR test variables (Tables 5 and 8). Only correlations possessing a Pearson correlation coefficient ≥ 0.6 were considered significant for this study.
Examination of Table 5 shows that LBR values for untreated aggregate samples exhibit a positive correlation to dry density (0.870) and negative correlations to both carbonate content (-0.679) and moisture content (-0.753). LBR also correlates negatively to calcite content (-0.602), but as calcite is the dominant mineral phase in most of the samples studied, it acts as a proxy for carbonate content. Therefore, LBR-calcite content correlations will not be examined further for this study. Of note, however, is the positive correlation between quartz and aragonite content
respectively). This suggests that quartz acts as the primary diluting phase for carbonate content, and that samples containing quartz also tend to be more enriched in aragonite relative to calcite as the carbonate phase. This is of interest, as increased carbonate content under these test conditions is associated with an overall decrease in LBR values. Such an observation is in conflict with the hypothesis proposed by this study that high carbonate materials should exhibit greater strength gain due to cementation. A major cause for this conflicting observation is the exceptionally poor test results acquired for 36-246 and 56-465, the materials possessing the highest carbonate contents (98% and 77%, respectively) of those studied. Furthermore, as none of the untreated samples showed any discernable increase in strength with age, it is unlikely that the test parameters employed with this phase of the study (e.g. soaked curing) accurately
reproduced the field conditions necessary for cementation.
Scatter plots of dry density, moisture content, carbonate content, and minus #4 (used as a proxy for gradation) versus LBR further illustrate the correlations of these variables for the total data set (Fig. 5). It can be seen that dry density and moisture content mirror one another,
reflecting the fact that dry density decreases with increased moisture content. This relationship is driven, in part, by the dry density/moisture content correlation seen with samples from 36-246 and 56-465, which consistently gave poor results in this part of the study. Simple linear
regression models for these variables are given in Table 6, and include models derived for the total data set, as well as models derived for the individual curing times of 3-, 7-, 14-, 28-, and 60-days. Regression equations were developed according to the following format:
LBR = a + b(var) eqn. 1 where, LBR = Limerock Bearing Ratio
var = γd (Dry density, kg/m3), MC (Moisture Content, %), CA (Carbonate Content,
%), or M4 (Minus #4, %)
The strongest correlation to LBR tests in the regression models remains to be dry density, for both the total data set and the individual curing times, excluding the model for the 7-day curing time. Moisture content shows the strongest correlation for that curing time and is consistently the second strongest correlation other than for the 60-day curing time, for which carbonate content is the second strongest correlation. The content of minus #4 material consistently exhibits the poorest correlation to LBR of any of the other variables. Although the specific gravity of the aggregates from different pits may influence dry density, it is likely that gradation may be a primary reason for the range of dry density values observed with these LBR tests.
Examining the scatter plot for LBR versus dry density in more detail shows that data from individual pits appear to exhibit a positive correlation (Fig. 6). In fact, several of the individual pits tested, including Pit Nos. 36-246 (R2 = 0.66), 56-465 (R2 = 0.78), 12-008 (R2 = 0.76), and 93-406 (47% carbonates) (R2 = 0.76), show strong correlation to linear regression modeling of this relationship. If not for the variability in test specimen dry density among individual pits, dry density and LBR results would likely not have such an important correlation as seen with this data set.
Table 5. Bivariate correlation matrix for untreated aggregate samples (Part 1) CARB. CONT. DRY DEN. MOIST. CONT. LBR MINUS #4 CALC. CONT. DOLO. CONT. QTZ. CONT. ARAG. CONT. CURING TIME CARB. CONT. DRY DEN. -.666** (.000) MOIST. CONT. .577** (.000) -.840** (.000) LBR -.679** (.000) .870** (.000) -.753** (.000) MINUS #4 .067 (.680) -.513** (.001) .543** (.000) -.449** (.004) CALC. CONT. .920** (.000) -.626** (.000) .385* (.014) -.602** (.000) -.048 (.769) DOLO. CONT. .179 (.270) .334* (.035) -.230 (.154) .235 (.144) -.810** (.000) .097 (.550) QTZ. CONT. -.897** (.000) .454** (.003) -.377* (.016) .445** (.004) .346* (.029) -.858** (.000) -.477** (.002) ARAG. CONT. -.659** (.000) .262 (.103) .010 (.953) .320* (.044) .324* (.042) -.803** (.000) -.402* (.010) .654** (.000) CURING TIME .000 (1.000) -.003 (.985) .002 (.991) -.029 (.860) .000 (1.000) .000 (1.000) .000 (1.000) .000 (1.000) .000 (1.000)
Note: Shaded cells indicate correlations considered to be statistically significant for this study (Pearson correlation coefficient ≥ 0.6 ). * Correlation is significant at the 0.05 level (2-tailed).
** Correlation is significant at the 0.01 level (2-tailed). ( ) sig. (2-tailed), n = 40.
DRY DENSITY (kg/m3) 2200 2100 2000 1900 1800 LBR 300 200 100 0 MOISTURE CONTENT (%) 13 12 11 10 9 8 7 6 5 LBR 300 200 100 0 CARBONATE CONTENT (%) 100 90 80 70 60 50 40 30 LBR 300 200 100 0 MINUS #4 (%) 90 80 70 60 50 40 LBR 300 200 100 0
Figure 5. Scatter plots of variables thought to affect LBR test results of untreated aggregate samples (Part 1). (Note: Lines surrounding linear regression curves define the 95% confidence interval)
Table 6. LBR linear regression models for untreated aggregate samples (Part 1) UNSTANDARDIZED COEFFICIENTS LINEAR REGRES. MODEL R 2 STD. ERROR OF EST. CONSTANT STD. ERROR INDEPENDENT VARIABLE STD. ERROR TOTAL Dry Den. 0.76 23.98 -763.17 81.11 0.44 0.04 Moist. Cont. 0.57 32.00 302.00 26.79 -22.75 3.23 Carb. Cont. 0.46 35.66 220.23 19.01 -1.68 0.29 Minus #4 0.20 43.41 265.10 48.41 -2.10 0.68 3-DAY Dry Den. 0.83 21.26 -780.67 165.60 0.45 0.08 Moist. Cont. 0.58 33.62 295.11 61.84 -21.88 7.61 Carb. Cont. 0.37 41.26 208.12 49.20 -1.42 0.76 Minus #4 0.28 43.95 286.82 109.59 -2.35 1.53 7-DAY Dry Den. 0.69 25.13 -662.99 215.92 0.39 0.11 Moist. Cont. 0.74 22.98 270.57 38.33 -18.39 4.49 Carb. Cont. 0.57 29.47 211.11 35.14 -1.52 0.54 Minus #4 0.19 40.25 236.02 100.36 -1.68 1.40 14-DAY Dry Den. 0.75 30.77 -823.60 219.62 0.47 0.11 Moist. Cont. 0.65 36.74 360.21 75.87 -30.68 9.26 Carb. Cont. 0.45 45.91 227.94 54.73 -1.87 0.85 Minus #4 0.29 51.94 315.15 129.52 -2.86 1.81 28-DAY Dry Den. 0.77 29.36 -855.40 217.26 0.49 0.11 Moist. Cont. 0.61 38.12 339.50 72.52 -26.83 8.69 Carb. Cont. 0.36 49.18 221.69 58.63 -1.66 0.91 Minus #4 0.29 51.58 320.08 128.62 -2.84 1.80 60-DAY Dry Den. 0.76 24.79 -669.02 177.80 0.39 0.09 Moist. Cont. 0.40 39.62 270.39 79.98 -19.28 9.69 Carb. Cont. 0.69 28.28 232.26 33.71 -1.92 0.52 Minus #4 0.03 50.27 167.45 125.35 -0.76 1.75
DRY DENSITY (kg/m3)
2200 2100 2000 1900 1800LBR
300 200 100 0FDOT Pit No.
93-406 (40%) 93-406 (47%) 87-090 70-279 56-465 36-246 17-091 12-008 Total Data Set
Figure 6. Scatter plot of LBR and dry density illustrating the relationship between pit source and location on the plot for untreated aggregate samples (Part 1).
In an effort to quantify the correlations between LBR values and the variables of dry density, moisture content, and carbonate content, a multiple regression approach was attempted, even though several of the variables appear to be cross-correlated (e.g. dry density and moisture content). Regression analyses for the different curing times (3-, 7-, 14-, 28-, and 60-day) were performed and regression equations developed according to the following equation format:
LBR = a + b(γd) + c(MC) + d(CA) eqn. 2
where, LBR = Limerock Bearing Ratio
γd = Dry density, kg/m3
MC = Moisture Content, % CA = Carbonate Content, %
Table 7 presents a comparison of the measured values of untreated samples at different ages with those values predicted by the regression equations. In general, the predicted values are good estimates of the measured LBR values even though the coefficients of determination (R2) values are not exceptionally good. As seen previously with bivariate correlation and simple regression, dry density has the greatest effect on the LBR values whereas moisture content and percent carbonates have almost no influence on the LBR (probably statistically insignificant).
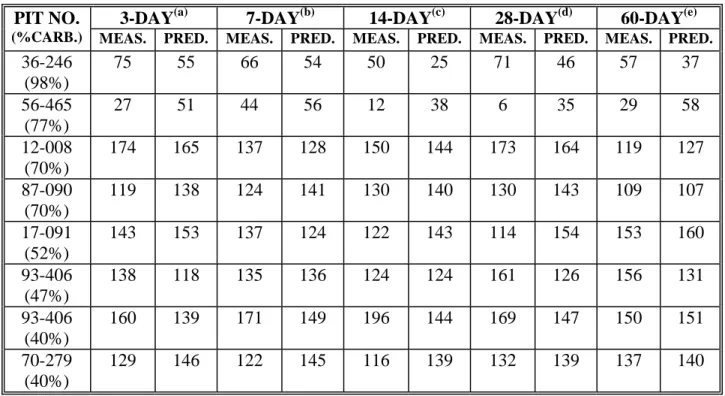
Table 7. Comparison of measured and predicted LBR values - untreated (Part 1) 3-DAY(a) 7-DAY(b) 14-DAY(c) 28-DAY(d) 60-DAY(e) PIT NO.
(%CARB.) MEAS. PRED. MEAS. PRED. MEAS. PRED. MEAS. PRED. MEAS. PRED.
36-246 (98%) 75 55 66 54 50 25 71 46 57 37 56-465 (77%) 27 51 44 56 12 38 6 35 29 58 12-008 (70%) 174 165 137 128 150 144 173 164 119 127 87-090 (70%) 119 138 124 141 130 140 130 143 109 107 17-091 (52%) 143 153 137 124 122 143 114 154 153 160 93-406 (47%) 138 118 135 136 124 124 161 126 156 131 93-406 (40%) 160 139 171 149 196 144 169 147 150 151 70-279 (40%) 129 146 122 145 116 139 132 139 137 140 Regression Equations: (a) LBR (3-d) = -781.97 + 0.4483(γd) + 1.24(MC) - 0.14(CA) n = 8, R2 = 0.83 (b) LBR (7-d) = 108.61 + 0.0730(γd) - 11.50(MC) - 0.70(CA) n = 8, R2 = 0.85 (c) LBR (14-d) = -449.92 + 0.3222(γd) - 6.46(MC) - 0.49(CA) n = 8, R2 = 0.78 (d) LBR (28-d) = -991.69 + 0.5382(γd) + 4.36(MC) - 0.08(CA) n = 8, R2 = 0.77 (e) LBR (60-d) = -595.75 + 0.3515(γd) + 7.61(MC) - 0.94(CA) n = 8, R2 = 0.87
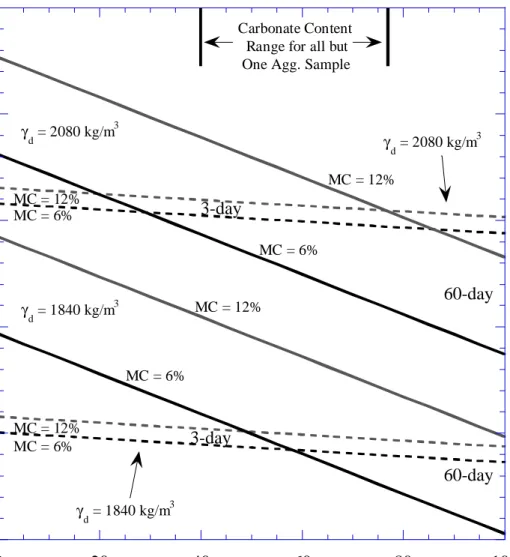
In an effort to relate LBR values to carbonate content, the multiple regression equations for 3- and 60-days were used to prepare LBR prediction lines using moisture content values of 6% and 12%, and dry density (γd) values of 1840 kg/m3 and 2080 kg/m3 (Fig. 7). The resulting
figure illustrates that moisture content and carbonate content appear to have less affect on LBR results than dry density. As noted before, variations in gradation are believed to be an important factor in producing the range of dry density values encountered with this study. In an effort to reproduce field-like conditions for this study, gradation was not held as a constant, complicating the ability of the LBR tests to elucidate the role of carbonate content in predicting strength gain. Furthermore, as shown in Figure 7, both 3-and 60-day prediction lines indicate that LBR values decrease with an increase in carbonate content. As noted previously, this observation is opposite of what was expected, with the magnitude of the relationship due, in part, to the poor test results achieved for Pit Nos. 36-246 and 56-465. Furthermore, the 3- and 60-day prediction lines overlap, illustrating the lack of an observed strength gain that was expected with this test. This supports the contention that employing a continuous soak method of curing the LBR samples did
0 50 100 150 200 250 0 20 40 60 80 100
LB
R
CARBONATE CONTENT (%)
MC = 6% MC = 6% MC = 6% MC = 6% MC = 12% MC = 12% MC = 12% MC = 12% γd = 1840 kg/m3 γd = 1840 kg/m3 γd = 2080 kg/m3 γd = 2080 kg/m3 3-day 60-day 60-day 3-day Carbonate Content Range for all but One Agg. SampleFigure 7. Prediction plot of LBR value as a function of carbonate content for untreated
aggregate samples (Part 1). (Note: Prediction lines were generated using the 3- and 60 -day regression equations shown in Table 7)
not produce the conditions necessary for subsequent cementation after initial compaction of the samples, or that lithological variability among the samples used in the study prevented
observation of this phenomenon. As a result, the prediction lines shown in Figure 7 should not be used to predict LBR test results based on carbonate content for the purpose of estimating field performance.
Treated Aggregates
Specimens prepared with 1.0 percent lime for the purpose of accelerating and/or
enhancing the cementing of high carbonate aggregates also were evaluated to assess the effects of dry density, moisture content, carbonate content, and gradation on LBR test results. As
outlined in the previous section, the first step was the production of a bivariate correlation matrix (Table 8).
Examination of Table 8 shows no significant correlations (Pearson correlation coefficient
≥ 0.6) between LBR and the variables of interest. The best correlation for LBR is with minus #4 (-0.541), but is insufficient to require detailed discussion other than the observation that an increase in fines appears to accompany a decrease in LBR values. This seems to suggest that either test variability was excessive or there is no relationship between these variables (including carbonate content) and LBR test results.
For the purpose of comparison, scatter plots of dry density, moisture content, carbonate content, and minus #4 versus LBR for the total data set are included (Fig. 8). In agreement with the bivariate correlation matrix, the scatter plots show no visual evidence for correlation of the variables of interest with LBR results. Linear regression models for these variables also are included for comparison to the untreated aggregate sample data (Table 9). As before, they include models according to the format of equation 1 for the total data set, as well as the individual curing times (3-, 7-, 14-, 28-, 60-days).
A review of Table 9 shows that minus #4 correlates best with LBR test results in the 3-day (R2 = 0.42), 14-day (R2 = 0.47), 28-day (R2 = 0.47) and 60-day (R2 = 0.65) regression analyses. Dry density also shows some evidence of correlation to LBR data during later curing times of 28-days (R2 = 0.47) and 60-days (R2 = 0.65). The similarity in coefficients of
determination (R2) for the 28- and 60-day curing times lends further credence to the
interpretation that gradation has a major impact on dictating dry density values. There appears to be absolutely no relationship between carbonate content and LBR data for this part of the study.
For comparison to the data calculated for the untreated aggregates, multiple regression analyses were once again performed for the different curing times, although they lack any real statistical significance. Using the same format illustrated with equation 2, these regression equations were used to calculate predicted LBR values (Table 10). A review of Table 10 shows that the predicted values are poor estimates of the measured LBR values, an observation in keeping with the poor statistical basis for the multiple regression analyses.
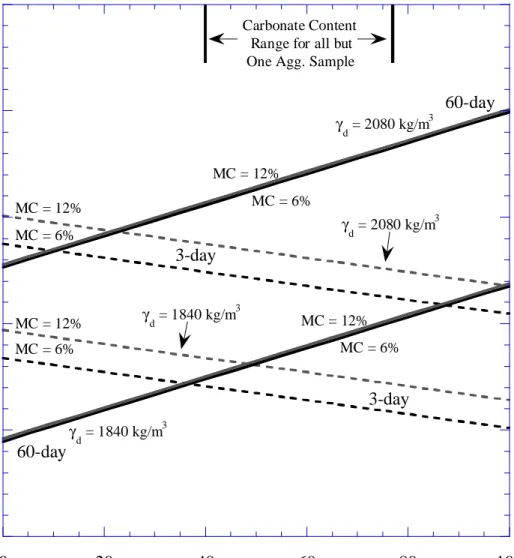
As with the untreated aggregates, the multiple regression equations for 3- and 60-days were used to prepare LBR prediction lines (Fig. 9). Although they illustrate nothing of statistical significance, the 60-day prediction lines do show a positive correlation between LBR and
carbonate content, suggesting that longer curing times may permit high carbonate aggregates to undergo greater strength gain exceeding the LBR values of aggregates with lower carbonate contents, even if the lower carbonate content aggregates have greater initial LBR values. Furthermore, it is still evident that dry density has a major impact on LBR test results, and that gradation plays a significant role in dry density variability. This suggests that greater emphasis should be placed upon selecting suitable gradations to attain a high dry density, which
consequently will yield higher LBR values.
If LBR is considered as a relative indicator of base course aggregate strength, then the use of high carbonate aggregates is not necessarily beneficial if low density is achieved. This is clearly illustrated by the LBR test results for Pit No. 56-465, which group into two distinctly different density levels. As a result the 7- and 14-day LBR values are greater than the 28- and 60-day values even though the aggregate contains 77 percent carbonates. Another condition that
Table 8. Bivariate correlation matrix for treated aggregate samples (Part 1) CARB. CONT. DRY DEN. MOIST. CONT. LBR MINUS #4 CALC. CONT. DOLO. CONT. QTZ. CONT. ARAG. CONT. CURING TIME CARB. CONT. DRY DEN. -.263 (.101) MOIST. CONT. .667** (.000) -.426** (.006) LBR -.116 (.478) .232 (.149) -.299 (.061) MINUS #4 .067 (.680) -.404** (.010) .413** (.008) -.541** (.000) CALC. CONT. .920** (.000) -.213 (.187) .479** (.002) .065 (.690) -.048 (.769) DOLO. CONT. .179 (.270) .298 (.062) -.143 (.379) .234 (.146) -.810** (.000) .097 (.550) QTZ. CONT. -.897** (.000) .146 (.369) -.511** (.001) -.093 (.569) .346* (.029) -.858** (.000) -.477** (.002) ARAG. CONT. -.659** (.000) -.069 (.672) -.058 (.724) -.207 (.201) .324* (.042) -.803** (.000) -.402* (.010) .654** (.000) CURING TIME .000 (1.000) -.003 (.984) -.060 (.715) .270 (.092) .000 (1.000) .000 (1.000) .000 (1.000) .000 (1.000) .000 (1.000)
Note: Shaded cells indicate correlations considered to be statistically significant for this study (Pearson correlation coefficient ≥ 0.6 ). * Correlation is significant at the 0.05 level (2-tailed).
** Correlation is significant at the 0.01 level (2-tailed). ( ) sig. (2-tailed), n = 40.
DRY DENSITY (kg/m3) 2200 2000 1800 1600 1400 1200 1000 LBR 260 240 220 200 180 160 140 120 100 80 MOISTURE CONTENT (%) 13 12 11 10 9 8 7 6 LBR 260 240 220 200 180 160 140 120 100 80 CARBONATE CONTENT (%) 100 90 80 70 60 50 40 30 LBR 260 240 220 200 180 160 140 120 100 80 MINUS #4 (%) 90 80 70 60 50 40 LBR 260 240 220 200 180 160 140 120 100 80
Figure 8. Scatter plots of variables thought to affect LBR test results of treated aggregate samples (Part 1). (Note: Lines surrounding linear regression curves define the 95% confidence interval)
is unexplained is why some of the 3-day LBR values for the lime treated aggregates are
substantially greater than untreated. Does the addition of lime have an initial modification effect (change in surface chemistry) that alters the LBR values or is this indicative of testing
variability? It is the prediction of these strength gain phenomena that was one of the main goals of this research.
Table 9. LBR linear regression models for treated aggregate samples (Part 1) UNSTANDARDIZED COEFFICIENTS LINEAR REGRES. MODEL R2 STD. ERROR OF EST. CONSTANT STD. ERROR INDEPENDENT VARIABLE STD. ERROR TOTAL Dry Den. 0.05 33.41 80.74 66.08 0.05 0.03 Moist. Cont. 0.09 32.77 224.58 24.78 -5.30 2.74 Carb. Cont. 0.01 34.12 190.21 18.19 -0.20 0.28 Minus #4 0.29 28.89 304.17 32.22 -1.79 0.45 3-DAY Dry Den. 0.34 31.01 -291.23 254.74 0.22 0.13 Moist. Cont. 0.21 33.86 226.01 57.65 -8.06 6.35 Carb. Cont. 0.13 35.57 192.81 42.40 -0.62 0.66 Minus #4 0.42 28.92 304.70 72.13 -2.12 1.01 7-DAY Dry Den. 0.02 28.03 103.59 221.03 3.53 0.11 Moist. Cont. 0.01 28.19 182.22 42.73 -0.86 4.65 Carb. Cont. 0.01 28.07 183.70 33.47 -0.15 0.52 Minus #4 0.00 28.24 181.30 70.43 -0.10 0.99 14-DAY Dry Den. 0.03 21.54 202.36 51.89 -0.01 0.03 Moist. Cont. 0.01 21.74 188.91 34.08 -0.79 3.67 Carb. Cont. 0.04 21.44 170.40 25.56 0.18 0.40 Minus #4 0.47 15.90 272.14 39.65 -1.28 0.56 28-DAY Dry Den. 0.47 31.78 -302.32 213.12 0.25 0.11 Moist. Cont. 0.14 40.65 266.75 81.07 -8.84 9.15 Carb. Cont. 0.01 43.58 198.61 51.95 -0.15 0.80 Minus #4 0.47 31.76 371.07 79.20 -2.57 1.11 60-DAY Dry Den. 0.65 24.54 -342.17 157.96 0.27 0.08 Moist. Cont. 0.30 34.86 290.89 64.97 -11.85 7.38 Carb. Cont. 0.02 41.23 205.51 49.16 -0.28 0.76 Minus #4 0.65 24.65 391.65 61.48 -2.87 0.86
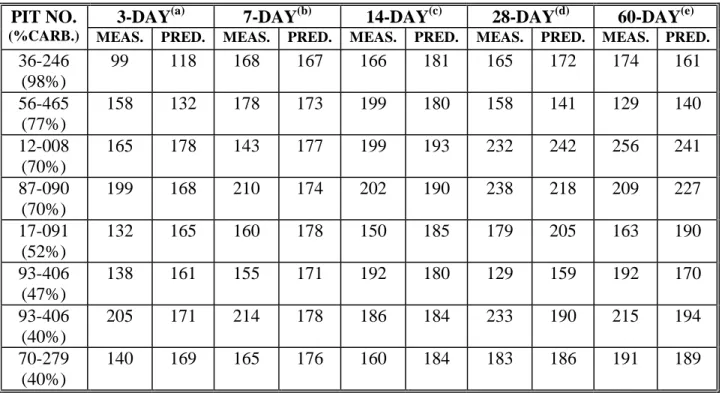
Table 10. Comparison of measured and predicted LBR values - treated with 1.0 percent lime (Part 1)
3-DAY(a) 7-DAY(b) 14-DAY(c) 28-DAY(d) 60-DAY(e) PIT NO.
(%CARB.) MEAS. PRED. MEAS. PRED. MEAS. PRED. MEAS. PRED. MEAS. PRED.
36-246 (98%) 99 118 168 167 166 181 165 172 174 161 56-465 (77%) 158 132 178 173 199 180 158 141 129 140 12-008 (70%) 165 178 143 177 199 193 232 242 256 241 87-090 (70%) 199 168 210 174 202 190 238 218 209 227 17-091 (52%) 132 165 160 178 150 185 179 205 163 190 93-406 (47%) 138 161 155 171 192 180 129 159 192 170 93-406 (40%) 205 171 214 178 186 184 233 190 215 194 70-279 (40%) 140 169 165 176 160 184 183 186 191 189 Regression Equations: (a) LBR (3-d) = -290.45 + 0.2235(γd) + 2.19(MC) - 0.33(CA) n = 8, R2 = 0.37 (b) LBR (7-d) = 42.10 + 0.0599(γd) + 2.03(MC) - 0.11(CA) n = 8, R2 = 0.02 (c) LBR (14-d) = -2.62 + 0.0837(γd) + 0.86(MC) + 0.19(CA) n = 8, R2 = 0.25 (d) LBR (28-d) = -740.11 + 0.4121(γd) + 6.65(MC) + 0.81(CA) n = 8, R2 = 0.65 (e) LBR (60-d) = -533.89 + 0.3409(γd) + 0.22(MC) + 0.73(CA) n = 8, R2 = 0.76
50 100 150 200 250 300 0 20 40 60 80 100
LB
R
CARBONATE CONTENT (%)
γd = 2080 kg/m3 γd = 1840 kg/m3 Carbonate Content Range for all but One Agg. SampleMC = 12% MC = 6% 60-day 3-day MC = 6% MC = 12% MC = 6% MC = 12% MC = 6% MC = 12% 60-day 3-day γd = 1840 kg/m3 γd = 2080 kg/m3
Figure 9. Prediction plot of LBR value as a function of carbonate content for treated aggregate samples (Part 1). (Note: Prediction lines were generated using the 3- and 60-day regression equations shown in Table 10)
Materials, Test Specimen Preparation and LBR Testing (Part 2)
For the second part of the LBR study (Part 2), base course aggregates from nine (9) sources (pits) were selected and used to prepare lime treated and untreated test specimens for the purpose of evaluating strength gain effects on the Limerock Bearing Ratio (LBR), as was done in Part 1 of the study. Included with these samples were one (1) sample of recycled crushed
concrete aggregate (58-486) and two (2) samples from outside of Florida; MX411 from Mexico and AL-149 from Calera, Alabama. As with the initial set of samples tested, four to five
specimens, each at different moisture contents, were compacted according to AASHTO Method T-180 to establish moisture-density curves. The optimum moisture content was determined from these curves for each source (pit) of aggregate. Treated aggregate samples were prepared by adding one (1.0) percent of lime prior to the addition of water. Table 11 presents basic
information on the aggregate and optimum moisture content for each source of material, while Table 12 outlines the material type, lithology and mineralogy of the materials studied. Again, the quantitative X-ray diffraction (XRD) data outlined in Table 12 was determined using a Rietveld refinement technique.
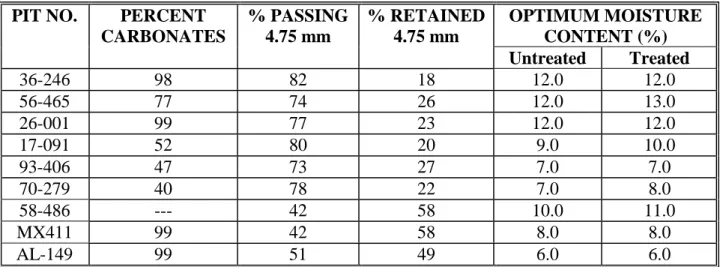
Table 11. Composition and optimum moisture contents for base materials (Part 2) OPTIMUM MOISTURE
CONTENT (%) PIT NO. PERCENT
CARBONATES % PASSING 4.75 mm % RETAINED 4.75 mm Untreated Treated 36-246 98 82 18 12.0 12.0 56-465 77 74 26 12.0 13.0 26-001 99 77 23 12.0 12.0 17-091 52 80 20 9.0 10.0 93-406 47 73 27 7.0 7.0 70-279 40 78 22 7.0 8.0 58-486 --- 42 58 10.0 11.0 MX411 99 42 58 8.0 8.0 AL-149 99 51 49 6.0 6.0
For this phase of LBR testing, six samples of untreated and 1.0 percent lime treated materials were prepared for each aggregate source. Pit Nos. 36-246 and 70-279 were an exception, having eight samples of untreated and 1.0 percent lime treated materials prepared. Moisture-density data for the compacted LBR test samples are given in Tables B-1 and B-2 of Appendix B. The dry density (γd) values were based upon the test specimen volume, sample
weight, and moisture content after LBR testing at the different ages (1, 7, 14, and 28-day). Whereas all samples were tested after curing times of 1, 14, and 28-days, Pit Nos. 36-246 and 70-279 also were tested at a 7-day curing interval.
LBR tests for this second phase of testing were conducted using a modification of Florida test method FM-515, for which samples were placed in a moisture room for curing rather than soaked. This method of curing was used after the techniques applied in Part 1 of the LBR study failed to produce expected results. Current FDOT specifications require a minimum LBR of 100 for compacted base course materials. Test results for the untreated and treated base course
Table 12. Lithology and mineralogy of base course materials (Part 2) PIT NO. MATERIAL TYPE FORMATION Calcite (%) Dolomite (%) Quartz (%) Aragonite (%) R (%)* 36-246 Limerock Ocala 100 --- --- --- 5.9
56-465 Limerock Avon Park 73.6 1.8 12.6 11.9 9.1
26-001 Limerock Ocala 100 --- --- --- 7.7 17-091 Shell Tamiami 22.2 --- 41.9 35.9 18.5 93-406 Shell-rock Anastasia 38.1 --- 37.4 24.6 34.7 70-279 Coquina Anastasia 31.2 --- 58.4 10.4 26.2 58-486 N/S --- --- --- --- --- --- MX411 Limerock --- 100 --- --- --- 5.4 AL-149 Limerock Calera 45.8 53.5 0.7 --- 30.0 * R-values are residuals from quantitative Rietveld refinement of XRD data
(a) Sample 58-486 consists of crushed recycled concrete (N/S - no sample analyzed by XRD)
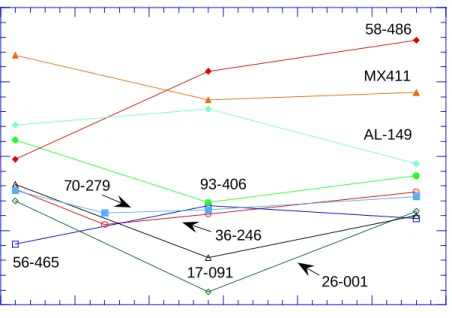
Table 13. LBR values of untreated and treated aggregates (Part 2) PIT NO. (% CARB.) 36-246 (98%) 56-465 (77%) 26-001 (99%) 17-091 (52%) 93-406 (47%) 70-279 (40%) 58-486 (---) MX411 (99%) AL-149 (99%) 1-Day: Untreateda 128 91* 120 131 161 127 148 218 171 Treateda 174 133 155 135 155 148 234 233 193 % Change 36 46 29 3 -4 17 58 7 13 7-Day: Untreateda 104 --- --- --- --- 112 --- --- --- Treateda 172 --- --- --- --- 150 --- --- --- % Change 65 --- --- --- --- 34 --- --- --- 14-Day: Untreateda 111 117 (59)* (82)* 119 114 207 188 182 Treateda 151 176 141 164 204 141 234 232 200 % Change 36 50 139 100 71 24 13 23 10 28-Day: Untreateda 126 108 113 110 137 123 228 193 145 Treateda 152 156 166 158 230 166 243 217 193 % Change 21 44 47 44 68 35 7 12 33 a
Values are an average of 2 replicate tests.
* Fails FDOT requirement for minimum LBR of 100.
aggregates at the different ages are given in Table 13. Listed LBR values in Table 13 are an average of two tests. Average LBR values for all untreated materials except from Pit 26-001 exceeded 100 and on the average ranged between 105 and 200 (Fig. 10). It should be noted that materials, which produced LBR values below the min