U n i t e d n a t i o n s e n v i r o n m e n t P r o g r a m m e
c
ommunities
to
D
isAsters
:
A
n
i
nterActiVe
g
uiDe
AnD
m
ethoDology
No use of this publication may be made for resale or for any other commercial purpose whatsoever without prior permission in writing from the United Nations Environment Programme.
Disclaimer
The designations employed and the presentation of the material in this publication do not imply the expression of any opinion whatsoever on the part of the United Nations Environment Programme concerning the legal status of any country, territory, city or area or of its authorities, or concerning delimitation of its frontiers or boundaries. Moreover, the views expressed do not necessarily represent the decision or the stated policy of the United Nations Environment Programme, nor does citing of trade names or commercial processes constitute endorsement.
UNEP
promotes
environ-mentally sound practices
globally and in its own activities.
This publication is printed on 100%
recycled paper, using vegetable -based
inks and other eco-friendly practices.
Our distribution policy aims to reduce
communities to DisAsters:
An interActiVe guiDe AnD
methoDology
Community Risk Profile Tool (CRP)
UNEP DTIE
Sustainable Consumption and Production (SCP) Branch 15 rue de Milan 75441 Paris CEDEX 09 France Tel: +33 1 4437 1450 Fax: +33 1 4437 1474 E-mail: unep.tie@unep.fr www.unep.fr/scp INERIS
Accidental Risks Division
Parc technologique ALATA, BP 2 60550 Verneuil-en-Halatte France
Tel: +33 3 4455 6582 Fax: +33 3 4455 6295 www.ineris.fr
ACKNOWLEDGEMENTS
Coordinator
Ruth Coutto, United Nations Environment Programme (UNEP)
Writer
Bruno Debray, INERIS
Technical editing
Sandra Averous, UNEP Ruth Coutto, UNEP
Design
Thad Mermer, The Graphic Environment
We are grateful to the following individuals for their guidance, contributions, and inputs in the development of this tool:
Fanny Demassieux Leo Heileman Arab Hoballah Tomas Marques Helena Rey Guido Sonnemann Tuan Vu Anh Monique Barbut
INERIS DISCLAIMER
INERIS shall not be held liable for the use of the information described and/or contained in this manual/tool and assumes no responsibility for anyone’s use of the information. This manual/tool has no legal, regulatory character nor can be considered as a standard.
INERIS has developed this manual/tool under UNEP’s request to provide communities with a means of making a rough estimate of various types of risks they are exposed to, supporting the decision making process, especially as to whether or not further assessments are needed. This manual/tool has not yet been fully validated and is not a risk assessment tool. It is a tool that aims to provide users with a qualitative approach to characterise an expected level of risk. It is also a tool that can be used to support awareness raising and capacity building activities. Recommendations or orientations contained in these documents are meant to enlighten the choice of the decision makers but do not substitute his decision duty. The manual/tool contains general information, which cannot be specifically applicable to the needs of all users.
While INERIS has made every effort to provide accurate and complete information relevant to this manual/tool, INERIS cannot guarantee that there will be no errors. INERIS makes no claims, promises, or guarantees about the accuracy, completeness, or adequacy of the contents of this manual/tool and expressly disclaim liability for errors and omissions.
Any use of the information contained in this manual/tool is under the user’s full responsibility. Bastien Affeltranger Aurélie Barbe Régis Farret Sylvie Gualdo Yann Macé Olivier Salvi Gautier Vincent Glenn Dolcemascolo Mark Hailwood
TABLE OF CONTENTS
ACKNOWLEDGEMENTS
2
INERIS DISCLAIMER
2
TABLE OF CONTENTS
3
1. INTRODUCTION
5
1.1 OVERVIEW 51.2 SCOPE OF THE MANUAL 5
1.3 WHO SHOULD USE THE COMMUNITY RISK PROFILE TOOL? 5
2. OUTLINE OF THE METHOD AND PROCEDURAL STEPS
7
2.1 RISK ASSESSMENT CRITERIA 7
2.1.1 PRESENCE 7
2.1.2 KNOWLEDGE 7
2.1.3 INTENSITY 7
2.1.4 PROBABILITY AND FREQUENCY 8
2.1.5 ELEMENTS AT RISK 9
2.1.7 PREVENTION (OF HAZARDOUS PHENOMENA) 11
2.1.8 PROTECTION, MITIGATION 13
2.1.9 EMERGENCY PREPAREDNESS 13
2.1.10 RESILIENCE 15
3. THE COMMUNITY RISK PROFILE
17
3.1 INTERPRETING THE CRP GRAPH 18
3.2 RISK ASSESSMENT PROCEDURE 19
3.2.1 DEFINING THE DECISION CONTEXT FOR THE RISK ASSESSMENT 19
3.2.2 DEFINING THE COMMUNITY AREA 19
3.2.3 IDENTIFYING HAZARD SOURCES 20
3.2.4 ESTIMATING THE RISK LEVEL ASSOCIATED WITH EACH TYPE OF RISK 21
4. THE RISK ASSESSMENT SPREADSHEETS
23
4.1 INDUSTRY 23
- Presence, Knowledge, Intensity, Frequency, Prevention, Protection
4.2 TRANSPORT OF DANGEROUS GOODS 26
- Presence, Knowledge, Intensity, Frequency, Prevention, Protection
4.3 TROPICAL CYCLONES 30
- Presence, Knowledge, Intensity, Frequency, Prevention, Protection
4.4 FLOODING 32
- Presence, Knowledge, Intensity, Frequency, Prevention, Protection
4.5 WILDFIRES 35
4.6 VOLCANOES 37
- Presence, Knowledge, Intensity, Frequency, Prevention, Protection
4.7 EARTHQUAKE 39
- Presence, Knowledge, Intensity, Frequency, Prevention, Protection
4.8 LANDSLIDES 41
- Presence, Knowledge, Intensity, Frequency, Prevention, Protection
4.9 TSUNAMI 43
- Presence, Knowledge, Intensity, Frequency, Prevention, Protection
5. LIMITS OF THE COMMUNITY RISK PROFILE
AND PERSPECTIVES FOR IMPROVEMENT
45
5.1 RISK ASSESSMENT QUESTIONNAIRES 45
5.1 SCORING AND CALCULATING RISK CRITERIA 45
6. REFERENCES AND USEFUL READING
47
6.1 GENERAL RESOURCES 47
6.2 INDUSTRY 47
6.3 TRANSPORT OF DANGEROUS GOODS 47
6.4 TROPICAL CYCLONES 47 6.5 FLOODS 47 6.6 WILDFIRES 48 6.7 VOLCANO 48 6.8 EARTHQUAKE 48 6.9 LANDSLIDES 48 6.10 TSUNAMI 48
1. INTRODUCTION
1.1
OVERVIEW
Most communities face risks which they have to assess and manage. Risks may arise from human activities such as industrial accidents, or they may be of natural origin such as floods, earthquakes, etc. Risks need to be taken into account in the decision making process of the overall disaster management policy of such communities. There are, of course, decisions concerning management of risks themselves, but other decisions, such as those relating to land use planning or industrial investment, also require consideration of risk.
Assessing risks is not an easy task. It requires conducting in-depth studies, which will only be justified if the expected level of risk is high. Against this background, UNEP decided to develop this Community Risk Profile (CRP) tool to provide communities with a means of making a rough estimate of various types of risks they are exposed to, supporting the decision making process, especially as to whether or not further assessments are needed. The CRP is not, therefore, a risk assessment tool. It is a tool that will provide users with a qualitative approach to characterise an expected level of risk and thus decide on the necessity for further assessment. It is also a tool that can be used to support awareness raising and capacity building activities. This is a guide where the methodology has not been widely used. Therefore, we strongly recommend that communities using the CRP tool provide UNEP with feedback to facilitate the review and improvement of the tool.
The CRP tool itself is in the form of a set of Excel™ spreadsheets that allow users to characterise the risks facing a given community by responding to a set of questions. Once the spreadsheets are filled out (i.e. the questions are answered) the community’s CRP is produced automatically. This process is described in detail in this manual.
1.2
SCOPE OF THE MANUAL
To assist users in their decision making, the manual extends the definition of risk from the classical combination of probability and severity to a broader one that includes the vulnerability of an area and emergency preparedness. The CRP can be used to assess an initial level of risk independently of existing mitigation measures. It can also be used to assess whether existing measures are adequate to cover an initial risk. In all cases, a high risk level should induce in-depth risk assessment.
1.3
WHO SHOULD USE THE COMMUNITY RISK PROFILE TOOL?
The CRP tool is designed for a range of users involved in risk assessment or community
management, with a focus on local authorities responsible for disaster related issues and land use planning, as well as on insurers and aid agencies wishing to investigate risk in a given community area. Industry too will find parts of the CRP relevant.
The CRP can be used in support of capacity building activities in both industrialised and developing countries, although some of the questions covered are somewhat technical and may require preliminary training. A training kit has been developed in parallel with the CRP tool for this purpose. However, the CRP can also be a very effective training tool in its own right, as it addresses the main issues of risk assessment in a community. Performing a community risk assessment with the CRP tool will lead local authorities to ask relevant questions about the way risks are managed in their communities, and will raise the whole community’s awareness of vital issues.
2. OUTLINE OF THE METHOD AND PROCEDURAL STEPS
2.1
RISK ASSESSMENT CRITERIA
The CRP considers risk as a multi-dimensional characteristic of a given area. Different types of risks are assessed but, for each one, a typical event is identified that is a cause for concern and is assumed possible. Risks are then characterised according to the criteria presented and discussed in the following sections.
2.1.1 PRESENCE
The first question to be asked is whether there is a source of hazard within the community that could cause a given type of accident. Where one or several hazard sources are identified, risk analysis is necessary to estimate all of the dimensions of the risk, as described below.
Although assessing the presence/absence of risk may appear simple, some care needs to be
exercised. A hazard source located outside of a community could nevertheless affect the community, and must therefore be taken into account.
The hazard sources to be considered are the following: • Industrial plants, including SMEs
• Transport infrastructure: roads, railways, waterways, pipelines • Volcanoes
• Rivers (as potential sources of floods) • Slopes (landslides can occur)
• Forest and vegetation (which may ignite and cause a wildfire) • Sea shore (where a tsunami can occur)
• Earthquakes
• Storms, in particular tropical cyclones.
Additional investigations may be necessary to help users identify hazard situations where the presence of a hazard source is not immediately obvious.
2.1.2 KNOWLEDGE
Knowing a risk—i.e. analysing and assessing it—is a first essential step in risk management. If a hazard source is identified it is essential that a true risk analysis be performed to obtain a true estimate of the risk. Obtaining knowledge of the risk is based on analysis and other technical means. When knowledge of a risk is insufficient, and where the CRP indicates that a relatively high risk level is to be expected, further studies should be undertaken to attain a satisfactory level of knowledge. It should be borne in mind that the CRP is only an indication of actual risk level, based on average assumptions and very general criteria. If more precise results are already available, they should be used to estimate the risk, instead of the very general indications provided by the CRP.
2.1.3 INTENSITY
For an identified hazard source, ‘intensity’ characterises the scale of a potential event. This manual considers very different types of events but uses a common intensity scale that is applicable to assessment of events of any kind. A direct relationship is assumed between intensity level and the damage sustained by a given type of element that is known to be at risk and to be vulnerable. Many accidents have a point or linear origin and develop an intensity which is maximum at the origin and diminishes progressively when moving away from the source. Below a certain level of intensity— that is, above a certain distance—no effect is observed. Intensity level can therefore be characterised by a surface area over which a given effect—lethal effect, for instance—can be observed.
This is the approach adopted by the CRP. For industry, it provides an estimate of typical intensity levels for most hazardous activities. For other types of risk that have non-localised effects, the intensity level is usually characterised by a ‘standard’ intensity indicator (e.g. wind speed for cyclones or earthquake intensity for seismic events).
A common intensity scale proposed for point or linear hazard sources is shown below (Table 1). The boundaries between risk categories are somewhat arbitrary and could be discussed further by stakeholders in the future.
Intensity level Corresponding surface area
1 Effect area <0.2ha
2 Effect area 0.2−3 ha
3 Effect area 3−12 ha
4 Effect area 12−40 ha
5 Effect area >40 ha
Table 1: common intensity scale
2.1.4 PROBABILITY AND FREQUENCY
An accident can be characterised by its intensity, a risk by the combination of the likelihood of an event (expressed in terms of probability or expected frequency) and its consequences. For example, although the intensity of a collision between the Earth and a comet would be very high—as such an event would cause massive devastation and loss of life—the probability of such an event is so low that the risk can be considered as negligible. In practice, it is never taken into account in making risk-based decisions. In the case of very rare events, or of events that can occur only once in a given place (e.g. the collapse of a cliff), probability is assessed using indirect indicators.
For more events that occur more frequently, their frequency can be assessed using a historical approach. If frequency is defined as the return period of a given event, it is possible to extrapolate an expected future frequency from the past frequency, provided the conditions under which the event occurred in the past still pertain in the future.
In the CRP, the likelihood of accidents which could occur in the future is expressed in terms of frequency, and a common frequency scale is proposed for this purpose (Table 2). When no historical data are available, the same scale is used to express likelihood on the basis of an assessment of risk criteria.
Once again, this scale is open to debate amongst stakeholders.
Frequency level Frequency (events per time period)
5 1/10 years
4 1/100 years
3 1/1000 years
2 1/10000 years
1 1/100000 years
2.1.5 ELEMENTS AT RISK
Elements at risk are, first of all, people (i.e. the population, workers or users of a transport system) but they can also be economic in nature. It is the number of such vulnerable elements that will be affected by a hazardous phenomenon that determines the damage level of an accident. For example, an accident occurring where no vulnerable element (e.g. population, building, natural environment) is present will cause no damage, whereas one with an intensity beyond the lethal effect limit occurring in a densely populated area would cause a large number of fatalities. An estimate of the elements at risk exposed to the effects of an accident is thus an essential aspect of a risk estimate. The CRP assesses elements at risk by inviting users to make the choices indicated below:
Human beings exposed:
• Local population: Select the human density of the area at risk
• Transport users: Select the type of transport lines present in the area at risk Economic assets exposed:
• Industry: Select the type of industrial activity in the area at risk • Service: Select the type of economic activity in the area at risk
• Transport lines (roads, railways, waterways): select the types of transport lines present in the area at risk.
• Critical facilities*: Select the answer that characterises the exposed area
*Critical facilities are the amenities and equipment that are necessary to ensure the smooth functioning of an area and that play a major role in its resilience. They include schools, hospitals, major administrative departments, railway stations, airports, police stations, fire department, etc.
• Energy: Select the types of energy production and transport infrastructure present in the area at risk
• Communications: Select the types of communication infrastructure present in the area at risk Environmental exposure:
• Natural environment: Describe the natural environment in the exposed area
• Water supply system: Select the type of water resource present in the exposed area The level of exposure of each of these categories of element is obtained by selecting the most representative characteristics for the area. For example, where the population is concerned, the user is asked to select the description that best fits the potentially exposed area, as shown in Table 3:
Level Description of the area
1 Very low density (farmland, scattered houses), very few vulnerable elements
2 Low density area (individual dwellings, villages, quiet residential areas), a few vulnerable elements 3 Intermediate density area (residential area), several
vulnerable elements
4 High density area (busy residential area), many vulnerable elements
5 Very high density area (urban area, city centre, very active commercial zone), very large number of
vulnerable elements
Elements at risk may vary from one part of the community to another. The CRP’s elements at risk - vulnerability questionnaire (Figure 1) allows users to adapt their assessments of elements at risk to different parts of a community, in accordance with different types of risk.
2.1.6 VULNERABILITY
The vulnerability of a group of elements at risk characterises the capacity of the elements to withstand the effects of a hazard or the degree to which damage will be sustained. For example, a house that has been reinforced may withstand a flash flood. Similarly, concrete houses may withstand moderate overpressure better than metallic structures. Vulnerability is thus an aspect of risk that must be assessed, and reducing vulnerability is one of the steps that can be taken to reduce risk.
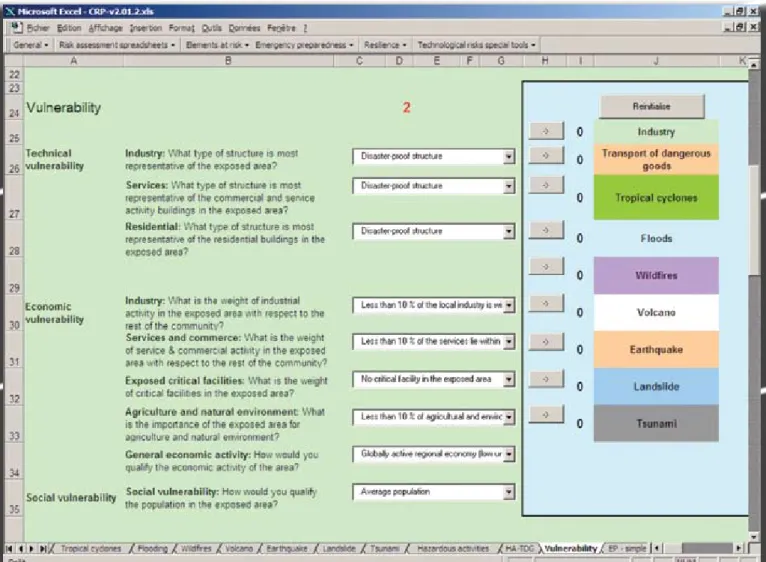
The CRP considers three types of vulnerability: technical vulnerability, or the capacity of a given set of elements to withstand an accident, and the economic and social vulnerability of a community (see Figure 2, p. 12).
Figure 1: The elements at risk questionnaire
(the buttons on the right are used to assign the calculated elements at risk to the areas concerned by different types of risk)
The vulnerability of an area is characterised by answering the following questions:
Vulnerability Questions to address
Technical vulnerability Industry: What type of structure is most representative of the exposed area?
Services: What type of structure is most representative of the commercial and service activity buildings in the exposed area?
Residential: What type of structure is most representative of the residential buildings in the exposed area?
Economic vulnerability Industry: What is the weight of industrial activity in the exposed area with respect to the rest of the community?
Services and commerce: What is the weight of service and commercial activity in the exposed area with respect to the rest of the community?
Exposed critical facilities: What is the weight of critical facilities in the exposed area?
Agriculture and natural environment: What is the
importance of the exposed area for agriculture and natural environment?
General economic activity: How would you describe the economic activity of the area?
Social vulnerability Social vulnerability: How would you describe the population in the exposed area?
Qualitative criteria can be applied to rank vulnerability for each of these themes on a scale of 1 to 5. Initially, the community’s vulnerability is assumed to be maximum for each aspect. Other choices could be made: for example, considering the average of vulnerabilities or some type of linear combination.
In the same way as for elements at risk, vulnerability can vary from one part of the community to another and the elements at risk - vulnerability questionnaire allows users to adapt their vulnerability assessments to different areas of the community in accordance with different types of risk.
2.1.7 PREVENTION (OF HAZARDOUS PHENOMENA)
It is possible to apply prevention strategies to attempt to reduce the probability of some hazardous phenomena. In industry, for instance, specific safety equipment or organisational measures can prevent failures likely to lead to an accident. In general, the CRP does not extend to assessment of specific preventive measures, but it does allow consideration of whether or not general prevention strategies are applied. These include, for example, the existence of legislation and its degree of enforcement or the existence of local monitoring and alert systems to provide early warning and allow for intervention before a major accident occurs.
In some risk assessment methods, safety barriers (i.e. prevention and protection measures) are assessed in terms of level of confidence and reliability, which has a direct quantitative impact on the probability of the accident scenario. However, such a quantitative link is not possible with the CRP, and the level of prevention is calculated very simply: a score of 1 is given if all prevention measures identified as possible are in place, 5 if there are none. For each prevention measure, CRP users are asked to answer ‘yes’ or ‘no’ for general measures, or to select a percentage of cases where the measure is actually in place. In many cases, the answer will not be obvious, and it is left to the user to decide on the answer that best characterises the community. The strategy employed can vary, depending on the CRP user’s objectives. However, a conservative approach is safer and should be applied in most of the situations, especially when the user is not a risk expert.
2.1.8 PROTECTION, MITIGATION
Protection and mitigation attenuate the effects of hazardous phenomena reaching vulnerable elements. Mitigation devices include dikes protecting against flooding or reinforced walls able to withstand the blast effect of an explosion.
Figure 2: The vulnerability questionnaire
(the buttons on the right are used to assign the calculated vulnerability to the zones concerned by different types of risk)
Mitigation also covers specific intervention plans and measures to reduce vulnerability or prevent it increasing. Land use restrictions or building regulations and standards are among the possible mitigation measures.
It is not possible to establish a quantitative scale for protective measures where prevention is
concerned. Assessment, in this case, is cumulative, going from 5 when no protection measures are in place, to 1 when all possible measures are present.
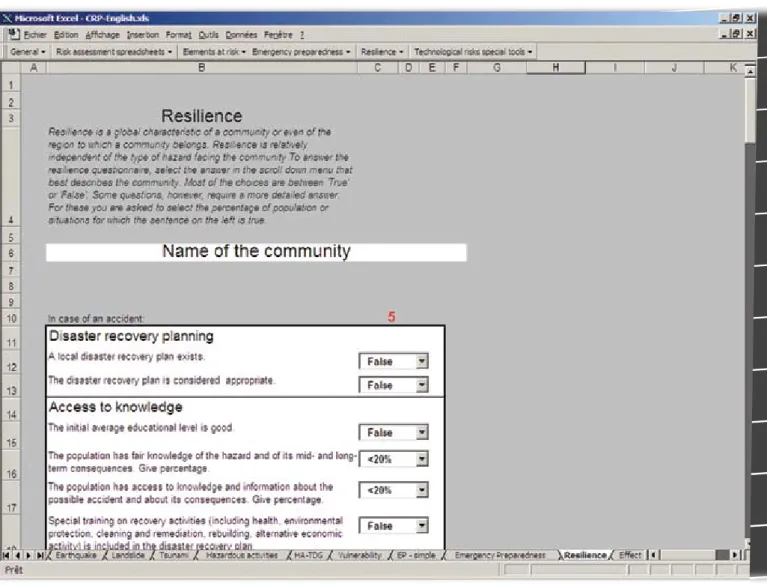
2.1.9 EMERGENCY PREPAREDNESS
Emergency preparedness—which is the core of the APELL programme—covers all of the technical and organisational measures that contribute to efficient intervention in the event of an emergency. Several booklets on this subject are available. In the CRP, this aspect is assessed via a questionnaire developed within the framework of the APELL programme .
The full questionnaire is, however, relatively long and complex and the CRP provides a simplified version, in the form of a subset of the complete questionnaire which, nonetheless, includes all of the essential questions (see Figures 3 & 4). The user is given the choice of: either filling in the complete questionnaire, which provides much useful information; or filling in the simplified one. Use of the full questionnaire is justified if emergency preparedness is the community’s main concern.
Emergency preparedness is assessed globally for the entire community and for all hazards, the assumption being that a single organisation will be involved in response to any of the hazards, and that good overall organisation will be beneficial in all situations. The ‘protection’ sections of each of the specific risk assessment sheets nevertheless ask questions to assess the specifics of emergency response in relation to a given type of hazard.
2.1.10 RESILIENCE
Resilience characterises the capacity of a community (or of a person) to recover after an accident. Several aspects of a community’s make-up contribute to its resilience, including: the existence of disaster recovery planning, access to knowledge, the community’s economic capacity and its health system, as well as the system’s learning capacity, local cohesion and the community’s technical capacity.
The CRP presents users with a set of questions on each of these themes (see Figure 5), to help them assess the community’s resilience. The overall score is a weighted sum of all of the answers, with the initial weighting being equal to 1. The weighting distribution is likely to change over time, as feedback is obtained from community users.
To fill in the resilience questionnaire, users are asked to select the answer from a scroll down menu that best describes the community. Most of the choices are between ‘True’ or ‘False’. Some questions, however, require a more detailed answer and, for these, users select a percentage of the population or of situations for which the sentence on the left is true.
The resilience questionnaire presents the following statements which are to be designated ‘True’ or ‘False’: Disaster recovery planning
• A local disaster recovery plan exists
• The disaster recovery plan is considered appropriate Access to knowledge
• The initial average education level is good
• The population has a fair knowledge of the hazard and of its medium and long term consequences
• The population has access to knowledge and information about the accident and its consequences
• Special training on recovery activities (including health, environmental protection, cleaning and remediation, rebuilding, alternative economic activity) is included in the disaster recovery plan
Economic capacity
• The initial economic level of the population is good • What percentage of the population has access to credit? • The population’s level of debt is low
• What percentage of the population has insurance cover?
• The insurance system allows for rapid reimbursement of populations affected • The general regional economy is good
• Public subsidies are available for reconstruction and economic recovery • Unemployment and welfare insurance are available to jobless people • The regional level of unemployment is low
• The regional economy is growing Health
• The initial health of the population is good
• A good health system is available in a nearby preserved area
• The population has access to the health system (even after having lost home and/or job) • Temporary shelters are available in case of an accident
Learning capacity of the system
• A learning-from-experience system exists Local cohesion
• Local participation in decisions is effective
• NGOs and associations are involved in the local social and economic life • The region is affected by conflict
Technical capacity
• Local construction and remediation companies exist • Materials for reconstruction are available at local level • Technologies for reconstruction and remediation are known • Technologies for reconstruction and remediation are available
3. THE COMMUNITY RISK PROFILE
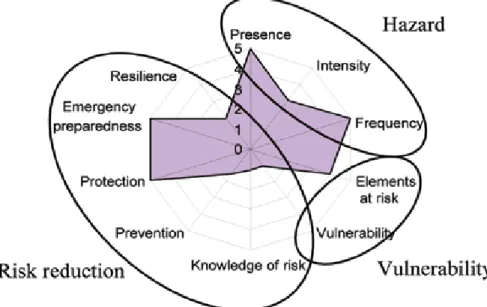
The CRP is produced automatically once the answers have been provided to the questions in the various spreadsheets. The CRP is in two parts: the CRP matrix (Figure 6), where all of the scores are summarised, and the CRP graphs (Figure 7), which provide a graphic representation of the different dimensions of each specific risk.
Figure 6: the CRP matrix
Figure 7 shows the CRP graphs for industry, transport of dangerous goods (TDG), tropical cyclones, floods, wildfires and volcanoes. For each type of risk, the greater the surface area of the CRP, the higher the risk and the greater the necessity for prevention and mitigation measures.
The CRP graphs can be divided into three main areas:
• The upper right portion, indicating the characteristics of the hazard in terms of the presence, intensity and frequency of a dangerous phenomenon.
• The lower right portion, giving an indication of the vulnerability of the community to the hazardous phenomenon.
• The remaining portion, the entire left half of the CRP, covering risk control activities.
3.1
INTERPRETING THE CRP GRAPH
All of the criteria are measured on a scale of 0 to 5, and always with the same orientation. If there is no hazard source present in the study area, the user will set the presence criterion to zero (0), indicating ‘absence’ of any hazard source. In this case, all of the other criteria are set to zero automatically, indicating that the study is not relevant.
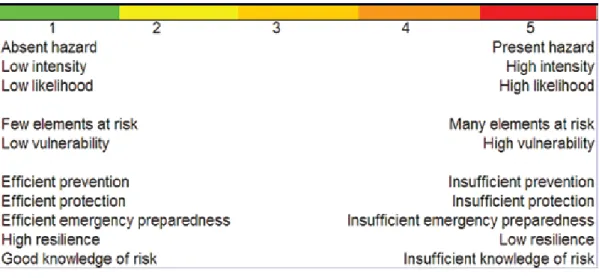
When a hazard source is present, the presence criterion is set to 5 and all of the other criteria are then assessed on a scale of 1 to 5. For criteria in the ‘Hazard’ and ‘Vulnerability’ categories (see Figure 8) a setting of 1 corresponds to low hazard, low level of elements at risk and low vulnerability. Conversely, 5 indicates a high hazard score, a high level of elements at risk and great vulnerability.
For the ‘Risk reduction’ criteria, a score of 1 indicates efficient prevention, protection and emergency preparedness, as well as high resilience and good risk knowledge. The situation for all of the criteria, illustrated by Figure 9, can be summarised as:
1 indicates a favourable situation, 5 an unfavourable one
Figure 9: interpretation of the scales
When interpreting the CRP graphs it is also important to bear in mind the definition of risk established at the start of Section 2.1.4. If the surface area of the upper right portion of the graph is large, then the hazard score is high. However, according to the definition, this does not necessarily mean that risk is high. If the area of the lower right portion is small there are few elements at risk and vulnerability is low. Risk is therefore low and, if an accident were to occur, it would cause only limited damage. In addition, if preventive measures are considered to be adequate, the probability of an accident occurring is also low.
3.2
RISK ASSESSMENT PROCEDURE
Risk assessment for a community is carried out by following the steps described below. 3.2.1 DEFINING THE DECISION CONTEXT FOR THE RISK ASSESSMENT
The purpose of risk assessment is to provide useful information to decision makers so that they can make sound decisions. Decision makers are, however, of different kinds, e.g. local authorities, NGOs, industry, etc., and the decisions they make based on risk assessment relate to a range of aspects: for example, to investment in a given community or to implementation of a new local safety regulation, etc. Risk assessment always therefore takes place within a given decision context.
It is essential that this context be known, so that the risk assessment results can be presented in terms that will be relevant and useful to the decision maker. However, the decision criteria should not influence the risk assessment outcome. Definition of the decision context has a direct influence on the next step: definition of the community area.
3.2.2 DEFINING THE COMMUNITY AREA
The second step in risk assessment is to define the system to be assessed. This will, usually, be described in terms of an area in which hazard sources and elements at risk are present. It may be a municipality or a larger or smaller area. The difficulty is in taking account of side effects. Hazard sources located outside of the area can nonetheless have an impact on elements at risk within the community. The community area must, therefore, be considered primarily in terms of a potential impact zone, and hazard sources must be sought both within and outside the community.
Users must be aware that the way in which they define the community will affect the risk estimate. The definition of the community should be in line with the decision context that initiated use of the CRP tool.
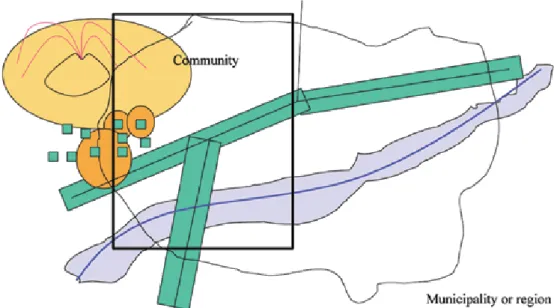
Figure 10 illustrates the concept of community. The largest contour will usually correspond to an administrative subset of a larger area, such as a municipality or a region. The community is the area within which risk has to be assessed. It can be an entire region or a municipality, but will be often a subset, e.g. a neighbourhood.
Figure 10: example of a community area within a larger administrative region
3.2.3 IDENTIFYING HAZARD SOURCES
In the example developed below (see Figure 11) there are a number of hazard sources within a community: a river (potential source of flooding); a road (potential source of transport accident involving hazardous substances); and an industrial zone (source of industrial accidents). The community is also close to a volcano and to other industrial plants, and these may also cause hazardous phenomena affecting the community.
The hazard sources to be considered are the following: • Industrial plants, including SMEs
• Transport infrastructure: roads, railways, waterways, pipelines • Volcanoes
• Rivers (potential sources of floods) • Slopes (landslides may occur)
• Forest and vegetation (may ignite and cause a wildfire) • Sea shore (a tsunami could occur)
• Earthquakes
• Storms (in particular tropical cyclones).
3.2.4 ESTIMATING THE RISK LEVEL ASSOCIATED WITH EACH TYPE OF RISK
The user is asked to respond to a set of questions for each type of risk in order to assess the risk level by assessing the risk criteria presented in Section 2: presence, knowledge, intensity, frequency, prevention, protection, elements at risk, vulnerability, emergency preparedness, resilience.
4. THE RISK ASSESSMENT SPREADSHEETS
This section presents and comments on the following risk assessment spreadsheets: • Industry
• Transport of dangerous goods • Tropical Cyclones • Flooding • Wildfires • Volcano • Earthquake • Landslide • Tsunami
Use of the ‘Industry’ spreadsheet is described in detail and will serve as an example for the other CRP tool spreadsheets.
4.1
INDUSTRY
The ‘Industry’ spreadsheet (Figure 12, previous page) covers major industrial risks in the community. It addresses only risks that can have an impact on the community beyond the industrial plants
themselves. In other words, occupational health and safety issues within plants are not addressed here. The potential accident events are fire, explosion, leaks of toxic gases or liquids, or loss of containment. PRESENCE
An Industrial risk is considered to be present if there are industrial plants within the community or in its immediate vicinity. (Remember, an industrial accident occurring in a plant in a nearby community can also have an impact on the community being assessed).
All types of plants are to be considered at this stage. The hazards associated with the industries are identified using the ‘Hazardous activities’ spreadsheet.
KNOWLEDGE
This section indicates how to characterise the quality of knowledge of a risk in a community, mainly by assessing whether risk analyses exist and whether or not they are of good quality. The answer is obtained by choosing the percentage of plants which have safety studies. The spreadsheet invites users to answer the following questions:
u Are there industrial safety studies or risk assessments available for these plants? National legislation in most industrialised countries requires safety studies with two objectives: assessment of the intensity and probability of potential accidents and a demonstration of the reduction in risk brought about by prevention and mitigation measures. If such safety reports exist and are available to the community representatives, knowledge of the risk is considered as sufficient. An additional set of questions then allows the quality of the safety studies to be characterised:
u Do the safety studies provide geographical representation of risk (risk maps)?
If they do, this can be used as a basis for the community to introduce additional risk reduction measures such as land use planning or emergency planning.
u Do the safety studies provide information on safety control by the company (safety measures, safety management system)?
This is essential from two points of view. Risk level is linked directly to prevention and protection measures (also referred to as safety barriers). Taking account of these helps to ensure that the risk assessment is truly representative. It also provides useful information for inspection authorities and for emergency planning.
u Do the safety studies provide information about emergency response?
Risk analysis is the basis for emergency planning. Emergency response is generally described in separate documents that include risk maps produced during risk analysis.
u Do the safety studies take into account possible interactions with other sources of hazard (natural or industrial)?
Industrial accidents can have a variety of causes, including natural events such as earthquakes, flooding or cyclones. The safety studies should include these scenarios.
INTENSITY
For industrial accidents, intensity is characterised by the area that would experience lethal effects in case of accident. The area can be estimated directly from safety studies or be obtained by using the relevant CRP spreadsheet. A scroll-down menu invites users to select how they want to proceed. If ‘guided risk assessment’ is selected, the user is redirected automatically to the ‘hazardous activities’ spreadsheet.
This sheet (Figure 13, next page) was derived from the Manual for the Classification and Prioritisation of Risks due to Major Accidents in Process and Related Industries (IAEA, 1996). It provides the user with typical effect distances for specific industrial activities.
The underlying principle is that each industrial activity is associated with typical substances. Users select the activities and substances present in their communities and provide the quantity stored at one single storage unit in a plant. For example, for an LPG transfer unit with three propane spheres each of 500 m3, the user is asked to enter the weight of one of the spheres, i.e. approximately 250 tonnes. In this case, the typical effect distance and surface area are 500 m and 80 ha, which correspond to an effect level of 5. The principle is to convert surface areas into intensity levels, in line with the following scale:
Surface Area Intensity Level
Between 0.02 and 0.2 ha Level 1
Between 0. 2 and 3 ha Level 2
Between 3 and 12 ha Level 3
Between 12 and 40 ha Level 4
Above 40 ha Level 5
The same scale of intensity levels and impacted surface areas has been used for all of the localised effects. The spreadsheet also gives information about maximum effect distance, which should be used as a reference for the estimation of elements at risk and of vulnerability.
Potential for domino effect
If other hazardous plants are present in the effect zone subject to thermal or overpressure effects, a domino effect is possible and intensity is accordingly raised by one level.
FREQUENCY
Assessing the frequency of major industrial accidents is not easy, for a variety of reasons. To begin with, such accidents are not frequent and the situations of the plants involved may differ widely from one accident to another. Technology also develops with time, making risk reduction easier; conversely, technological developments also bring new risks. And the economic situation of industrial plants changes, inducing organisational changes that may affect risk control positively or negatively. For all these reasons, assessing the frequency of future accidents on the basis of historical data is not an obvious choice.
In fact, the best solution is to perform a true risk analysis. This involves identifying potential accident scenarios and safety barriers and using them to estimate the frequency or the probability of an accident over a given period. If such studies already exist for the industrial plants in a community, or if some other estimate of the future frequency of accidents exists, users can enter the results into the CRP tool directly. Otherwise, they can proceed with a ‘guided risk assessment’. This approach consists in estimating the risk reduction factor induced by the prevention measures and in calculating a new frequency index by subtracting the risk reduction factor from an initial frequency level fixed arbitrarily at the maximum level of 5.
The approach assumes that probability is linked directly to the preventive measures introduced.
PREVENTION
The preventive and protective measures taken into account in the CRP can only be general in nature. The sentences listed below allow users to assess the preventive measures. They characterise good practice in terms of risk prevention by industry. For recommendations applying to individual plants, users are invited to select the percentage of situations where they believe a recommendation has been applied. When the entire community or country is concerned, the choice is between ‘Yes’ or ‘No’.
• The industrial plants base their risk prevention on risk analysis
• The industrial plants were designed according to state of the art codes • The industrial plants use state of the art safety devices
• The industrial plants apply state of the art maintenance procedures • The industrial plants apply state of the art safety management systems • Does legislation impose strict safety rules
• Is industrial safety enforced by the authorities?
• The industrial plants inform the authorities and the population about their safety policy and practice • The industrial plants make improvements after accidents or incidents
PROTECTION
The protective measures envisaged for industrial plants are described below. For all these
recommendations, users are asked to specify the percentage of industrial plants where they actually apply. • Collective protection works are in place (protection walls, shields)
• Local vulnerability reduction measures are applied (reinforced windows, fire resistant material used, etc)
• Land use restrictions prevent additional elements of the surroundings from being exposed to potential hazardous phenomena
• There is a monitoring and alert system
• Emergency plans are defined at the plant level
• Emergency plans are defined at community level (see emergency preparedness, below)
4.2
TRANSPORT OF DANGEROUS GOODS
The Transport of Dangerous Goods (TDG) spreadsheet covers the risks arising from the transport of dangerous goods in the community by different modes of transport: road, rail, waterways, pipelines. The events considered are those that are specific to the dangerous substances transported: fire, explosion, toxic release. Other consequences of traffic accidents (fatalities, injuries or material damage due only to vehicle impact) are not considered here.
PRESENCE
The presence of a hazard arising from the transport of dangerous goods is linked directly to the existence in the community of transport infrastructure likely to carry dangerous goods. Presence of this hazard can be characterised by answering the following questions:
u Are there roads in the community likely to carry dangerous goods?
u Are there one or several railways in the community likely to carry dangerous goods?
u Are there waterways in the community likely to carry dangerous goods?
u Are there pipelines in the community carrying dangerous gases or liquids?
u Are there parking areas or marshalling yards where hazardous substances are stored temporarily?
u Are there port areas where loading/unloading of dangerous goods takes place?
KNOWLEDGE
The identification and assessment of the risks related to transport of dangerous goods is essential if the community is to manage the risk. More than for any other type of risk, the geographical dimension is essential here and the risk analysis should produce risk maps on which the transport routes are clearly identified. The following questions are used to develop knowledge of the TDG hazard.
u Has a TDG risk analysis been done for the community?
u Does the study consider all the possible sources of hazard?
u Does the study provide geographical representation of risk (risk maps)?
u Does the study provide information on local vulnerabilities?
u Does the study provide information on emergency response?
u Are there specific safety studies on infrastructure (tunnels, bridges)? INTENSITY
The intensity level for TDG is calculated in exactly the same way as for industry.
Available safety studies can be used to characterise the intensity of potential accident scenarios. Intensity can be expressed in terms of:
• Maximum surface affected by an accident • Maximum effect distance from the source
As in the case of industrial risk, if such safety studies are not available, a specific spreadsheet—based on the Manual for the Classification and Prioritisation of Risks due to Major Accidents in Process and Related Industries (IAEA, 1996)—allows the identification and characterisation of hazardous activities which could be the source of a major accident. For vehicle transport (rail, road, waterway), calculation involves the quantities of hazardous substances. The figure used should be the average tonnage for a carrier of dangerous goods. Calculation for pipelines uses the pipeline diameter.
FREQUENCY
In line with its aims—i.e. to provide a qualitative estimate of risk on the basis of which further studies should be undertaken and to be usable in very diverse regions of the world where general statistical data on transport accident frequencies may not be available—the CRP proposes two ways of assessing frequency:
a) Direct use of the results of available TDG hazard studies.
b) Assessment of probability by means of a qualitative questionnaire, assuming that frequency is higher if overall traffic levels are higher, the number of transport routes is higher, traffic on these routes is intense and if the routes connect with hazardous plants or storage installations. The questions below reflect this approach. They are treated cumulatively as, in general, it is possible to answer ‘yes’ to several of them.
With the second approach (b), CRP users are invited to select the answers that best characterise the transport of dangerous goods in their communities by identifying whether a transport route (road, train, waterway or pipeline) or other transport related infrastructure exists and, if so, what type of dangerous goods traffic it represents (heavy, low, medium). Note: the result will remain zero if no hazard source is identified in the ‘Presence’ section.
Road
u Is there one road carrying DG in the community?
u Is there one terminal (fixed chemical plant or container terminal) in the community?
u Are there several terminals (fixed chemical plant or container terminal) in the community?
u Are there risk spots in the community (e.g. road crossings, bridges, tunnels, road shrinkage, slopes)?
Rail
u There is one railway carrying DG in the community. (Users select traffic level)
u There are several railways carrying DG in the community. (Users select traffic level)
u Are these rails connected to industries in the community?
u Are these rails connected to marshalling yards in the community?
u Are there risk spots in the community (e.g. turnouts (switches), level crossings, tunnels, unstable ground areas)?
Waterways
u A major navigable waterway crosses the community. (Users select traffic level)
u There is a sea channel near the community’s coast. (Users select traffic level)
u Is there is a port terminal in the community?
u Are there risk spots in the community (e.g. crossings, locks, mooring areas)? Pipeline
u Are there pipelines for local use (natural gas) in the community?
u Do major pipelines cross the community?
u Are pipelines connected to fixed chemical, petrochemical and oil plants in the community?
u Are pipelines above ground?
u Are there risk spots in the community (e.g. pipelines crossing over roads, unstable ground zones where major ground movements could impact the pipeline)?
PREVENTION
As for industrial risk, preventive measures are identified by pinpointing the existence and enforcement of regulations or rules that tend to limit the probability of an accident. These rules can be local (e.g. restrictions on dangerous goods traffic on a given local route) or national (e.g. generalised application of ADR to road transport). Some criteria concerning the quality of roads and environment are also taken into account.
Reduction in the frequency and consequences of accidents involving dangerous goods is achieved by introducing preventive measures. Most of these are described in international regulations on the transport of dangerous goods, such as the United Nations Recommendations on the Transport of Dangerous Goods (UNRTDG). Applying a regulation based on these or similar principles is a first step, but it is also essential to assess how many transport operators actually meet the requirements of the regulations. The CRP tool does this by inviting users to answer the questions below. In some cases they are asked to select the percentage of situations where recommendations apply, in others they will answer ‘Yes’ or ‘No’.
Prevention of road accidents involving hazardous goods
u Does the country apply regulations based on the United Nations Recommendations on the Transport of Dangerous Goods (UNRTDG, known as the ‘Orange Book’), e.g. European regulations based on ADR?
In the boxes below, select the percentage of situations where the legal requirements are actually applied. If you do not know the exact figure, apply a rough estimate based on expert judgement using a qualitative approach (good situation: 60−80%, intermediate: 40−60% and bad: <20%)
u What percentage of road transport operators apply the regulation requirements in terms of: • packaging, which must be suitable and adequate and must follow the requirements in
• vehicles, container, tank or wagon, which must meet special requirements in accordance with classification of the goods;
• labelling of packaging, so that people handling the goods—including the emergency services in case of incident—can take appropriate precautions;
• placarding and use of regulatory signs on vehicles or containers, which must bear the appropriate information;
• loading and unloading procedures, which must be suited to the classification of the goods; • safety equipment, such as fire extinguishers, which must be carried by the vehicles; • appointment of qualified dangerous-goods safety adviser, when required by regulations; • training of drivers, not just to drive their vehicle but also on what to do if an accident
occurs;
• notification of accidents and emergencies by drivers;
• appropriate documentation (as described in the UNRTDG), which must accompany the dangerous good; this contains information on the dangerous good and its hazards?
u Does the country or region apply more stringent regulations to vehicles dedicated to transport of dangerous goods (e.g. on the quality management certification, radio equipment, parking rules)?
u Are regulations enforced; are TDG vehicles inspected regularly?
u Do local regulations exist to limit the transit of hazardous goods in the community?
u Are alternative routes defined after risk analysis?
u Do local regulations exist to limit speed on hazardous pathways?
u Do local regulations prohibit transit on very hazardous pathways?
u Is the quality of roads good (road pavement, infrastructure)?
u Is the quality of road equipment (e.g. road marking and signs) good?
u Is the population (living close to roads, etc.) informed about risks arising from TDG?
u Are industry and the local authorities known to make improvements after accidents or incidents?
u Is the transport of high-risk materials during rush hours restricted, to reduce accident probability and the number of people exposed to risk?
u Is the transport of dangerous goods restricted during hazardous weather conditions: low visibility due to fog, high winds, or slipperiness due to snow or ice?
u Is parking of dangerous goods vehicles in the community restricted?
u Is there a security plan covering the prevention of ill-intentioned actions against dangerous goods vehicles?
PROTECTION
Protective measures are measures that can reduce the consequences of an accident should it occur. Below are some examples of possible protection measures or measures to reduce vulnerability. CRP users are able to assess such measures in the chosen community by responding to a set of questions on these themes.
Road
u Are local vulnerability reduction measures applied (reinforced walls or windows, etc.)?
u Are specific protective devices (such as water curtains or walls) in place where the risk is highest (e.g. parking areas)?
u Do land use restrictions prevent additional elements of the surroundings from being exposed to potential hazardous phenomena?
u Is there a monitoring and warning system?
u Are emergency plans developed at plant level?
u Are emergency plans developed at community level (see Emergency Preparedness, below)?
u Do special roadside constructions limit the potential for severe consequences of spills (e.g. drainage systems or impermeable layers where roads pass through or near environmentally sensitive areas, water reservoirs, etc.)?
4.3
TROPICAL CYCLONES
A tropical cyclone is a tropical storm with winds that reach a constant speed of 119 km/h (74 miles per hour) or more. Tropical cyclone winds blow in a large spiral around a relatively calm centre known as the ‘eye’. As they near land, these storms can bring torrential rains, high winds, and storm surges. Tropical cyclones can last from less than 24 hours to more than 2 weeks when over open waters, with an average duration of 6 days. They can follow a path of several hundreds of miles across a coastal line. Known as ‘hurricanes’ when they occur in the Atlantic Ocean, these extreme hydro-meteorological events are also called ‘typhoons’ in East Asia and in the north-western parts of the Pacific. The term ‘cyclonic storms’ is used in the Bay of Bengal, and ‘tropical cyclones’ for storms in South Indian, South Pacific and Australian waters.
PRESENCE
Tropical cyclones occur typically in areas located in the intertropical convergence zone. The
geographical location of the community is thus of primary importance in deciding whether or not the hazard is present. The fact that the region has been hit by a cyclone in the past is clear evidence of the hazard being present. The questions for characterising the presence of the tropical cyclone hazard are:
u Has the community already been affected by a tropical cyclone?
u Has the community’s region already been affected by a tropical cyclone?
u Is the community located on an identified cyclone path?
u Is the community in a seashore area in the intertropical convergence zone ?
u Is the community in the hinterland of a seashore area in the intertropical convergence zone? KNOWLEDGE
This section covers the identification of existing, appropriate, specific knowledge sources on which a risk reduction strategy for tropical cyclones could be based. Knowledge of the tropical cyclone risk is considered to be good if records are kept of historical events, of their intensity and of the damage they have caused, and also if vulnerability studies have been conducted to assess the need to reinforce buildings and organise emergency response to cyclones.
u Are there meteorological studies on cyclones that have affected the community?
u Are records kept of all cyclones?
u Do the records mention intensity, damage and cyclone paths?
u Are there vulnerability studies available to assess the quality of buildings and their ability to withstand cyclones?
u Are there studies that assess the need for emergency response in the community and its potential organisation?
u Are there studies that assess the quality of collective protection (dikes, shelters, emergency response system) with regard to the potential intensity of a cyclone?
INTENSITY
It is not easy to assess the intensity of wind events from an a priori analysis. Assessment of intensity for such events is therefore based on a historical approach to events that have affected the community or surrounding areas with similar geomorphological characteristics. There are two options for assessment of the intensity of the hazard, depending on the availability of measurements or ground observations. In the CRP tool, intensity can be qualified either in terms of wind speed or of ground damage. An
intensity scale is proposed, based on an interpretation of the Saffir Simpson scale used to rate cyclones, and the Fujita-Pearson scale used, since 1971, to rate intensity by examining the damage caused by a tornado after it has passed over a man-made structure and by measuring the approximate path length and width. The CRP presents a scale which results from a combination of these two scales. The relation between the two scales and CRP intensity levels is illustrated by Tables 4 and 5.
Category Central Pressure
Winds Surge Damage CRP tool
intensity level
millibars inches mph ft
Category 1 980 or over equal to or greater than 28.94 74−95 4−5 minimal 3 Category 2 965−979 28.50−28.91 96−110 6−8 moderate 4 Category 3 945−964 27.91−28.47 111−130 9−12 extensive 4 Category 4 920−944 27.17−27.88 131−155 13−18 extreme 5
Category 5 below 920 below 27.17 over 155 over 18 catastrophic 5
Table 4: the Saffir Simpson scale Category Wind speed Path length
and width Damage intensity levelCRP tool
F0 – Gale Tornado (40−72 mph) P0 PATH length: 0.3−0.9 miles / P0 PATH width: 6−17 yards
Light damage: some damage to chimneys; branches broken off trees; shallow-rooted trees pushed over; sign boards damaged. 2 F1 − Moderate Tornado (73−112 mph) P1 PATH length: 1.0−3.1 miles / P1 PATH width: 18−55 yards
Moderate damage: the lower limit is the beginning of hurricane wind speed; peels surface off roofs; mobile homes pushed off foundations or overturned; moving autos pushed off the road; attached garages may be destroyed.
3 F2 − Significant Tornado (113−157 mph) P2 PATH length: 3.2−9.9 miles / P2 PATH width: 56−175 yards
Considerable damage: entire roofs torn from frame houses; mobile homes demolished; boxcars pushed over; large trees snapped or uprooted; light-object missiles generated.
4 F3 – Severe Tornado (158−206 mph) P3 PATH length: 10−31 miles / P3 PATH width: 176−566 yards
Severe damage: walls torn from well-constructed houses; trains overturned; most trees in forests uprooted; heavy cars lifted off ground and thrown.
5 F4 − Devastating Tornado (207−260 mph) P4 PATH length: 32−99 miles / P4 PATH width: 0.3−0.9 miles
Well-constructed houses levelled: structures with weak foundations blown off some distance; cars thrown and large missiles generated.
5
F5 − Incredible Tornado
(261−318
mph) P5 PATH length: 100−315 miles / P5 PATH width: 1.0−3.1 miles
Strong frame houses lifted off foundations and carried considerable distances to disintegrate; automobile-sized missiles fly through the air 100 yards or more; trees debarked; steel-reinforced concrete structures badly damaged.
5
FREQUENCY
Frequency can be assessed on the basis of historical data, although it may be difficult to go very far into the past. Books on local history, local newspapers or municipal records should be used for this purpose.
As for many natural events, frequency of tropical cyclones cannot be separated from intensity and it is essential to consider frequency in terms of an event that is used as a reference for intensity.
PREVENTION
Tropical cyclones cannot be prevented and preventive measures cannot therefore be proposed. However, this does not mean that no preparedness or protection are possible. Relevant measures when cyclones occur are presented in the following section.
PROTECTION
Protective measures comprise all of the measures that can be taken to reduce the consequences of cyclones when they occur. Measures cover the ability of buildings to withstand an event as well as the capacity of the population to be aware of an oncoming cyclone and to react properly to it.
u Are buildings designed according to appropriate building codes?
u Is there well dimensioned protection infrastructure to protect the community from flooding that could result from a cyclone?
u Is there a national warning system?
u Is there a local warning system?
u Does the warning system take account of the specific nature of the local situation?
u If the warning system is local, are local authorities trained to operate it?
u Is the population informed as to how to behave in case of a cyclone?
u Are sufficient shelters available for the population?
u Are drills organised to test the warning system?
u Has the warning system been audited or assessed?
u Have end-users been involved in the design of the system?
u Do the local authorities encourage and help families to make their own emergency plans?
4.4
FLOODING
Flooding is the most frequent natural hazardous phenomenon. It can happen in a variety of circumstances and will differ according to the geographical characteristics of the area and
meteorological causes of the flooding. The CRP tool covers five different types of floods: river floods, caused by the progressive increase of the water height in a river valley; flash floods, caused by heavy rains in a steep river basin; urban floods, caused by intense rain episodes in urban areas; coastal floods, caused by cyclones or earthquakes; and dike or dam overflows. Specific questions are asked to help characterise the risks associated with these different types of floods.
PRESENCE
The presence of a flood hazard is linked directly to the geographical characteristics of an area, as illustrated by the following questions:
u Is the community in a river valley?
u Is the community located in a steep river basin?
u Is the community in a coastal area?
u Is the community in a tropical cyclone area?
u Is the community located below the water level of a large water reserve (lake or sea) contained by a dike or a dam?
u Is the community in an urban area (with large artificial impermeable surfaces)?
u Is the community located in a flood-prone area in the associated programme on flood management database (http://www.apfm.info/database_area.htm) or in the Dartmouth Atlas of Global Flood Hazard (http://www.dartmouth.edu/%7Efloods/Modis.html)?
KNOWLEDGE
The knowledge of this risk is provided by hydrological studies which, generally, map the height of the floods for a given return period, usually 10 or 100 years. If no such study exists, it is necessary to rely either on historical evidence or on geographical indices. Knowledge of flood risk is assessed via the following questions:
u Are there historical data or landscape indices to estimate the area of a potential flood?
u Has the flooding risk been studied; are there hydrological studies available?
u Are there flooding hazard maps showing the extent of potential flooding associated with a return period?
u Are there flooding risk maps identifying the elements at risk?
u Are there flooding emergency response plans? INTENSITY
The only way to estimate the potential intensity of a flood is to interpret past episodes or the results of hydrological studies. CRP users are therefore asked to provide the surface area of flooded zones. To be consistent with the definition of intensity for other hazards, this should correspond to the surface area of the flooded zone where lethal effect can be observed. This corresponds more or less to places where water speeds above 0.5 m/s and depths of more than 0.5 m can be observed. However, information on water depth and speeds is probably not easy to obtain. A default option is to enter the global flooded surface area measured on existing hazard maps or recalculated by transferring to a map of historical data on past floods.
u Basing your estimate on historical data, hazard maps or expert judgement:
u What is the area of the flooded zone for a reference potential flood?
Potential for domino effect
As for other hazards, the presence of dangerous goods in the flooded area can make the consequences more severe, notably in terms of water pollution.
u Are there hazardous chemicals stored in the floodable area? FREQUENCY
If historical data or hydrological studies are available, intensity and frequency are directly linked. Hydrological studies usually estimate water levels associated with a given return period (10 or 100 years). If such studies are not available, geographical indices will allow estimation of the likelihood of a flood. The result is not a real estimate of frequency, but it does give a useful indication of the flood hazard in the community.
Users thus have two possibilities to estimate frequency:
a) by providing the results of hydrological studies or indicating the frequency of the reference flood used to define the reference intensity; or
b) by answering the ‘risk factors’ questionnaire which uses qualitative indicators of flooding risk to estimate the likelihood (rather than the frequency) of a future flood.
The questions from the ‘risk factors’ questionnaire are given below. They are grouped in subsections corresponding to the different types of floods: river floods, flash floods, urban floods, coastal floods and dam or dike overflows. The risk associated with each of these flood types is assessed separately.
The final global score corresponds to the maximum of the risk scores.
u Has the community been flooded in the past?
u Is the region or upstream area subject to intense rain episodes?
u Is the region or upstream area subject to long periods of rain?
u Are there large snow reserves upstream that could add their contribution to a heavy rain episode?
u Are parts of the upstream soil naturally impervious? Give percentage.
u Has part of the upstream area been made impervious (e.g. by building or paving the ground)? Give percentage.
u Has upstream soil retention capacity been reduced by removal of vegetation (e.g. for agricultural purposes or to provide fire wood)? Give percentage.
River flood
u Does part of the community lie in the major bed (or flood plain) of a river?
u Is part of the community built on an unconfined aquifer? Flash flood
u Is part of the community built near a steep torrent or intermittent water stream in a steep river basin (slope >6%)?
Urban flood
u Does the community area include large impervious urban areas (built, paved)? Give percentage of impervious urban area.
u Are parts of the city able to concentrate water during heavy rain (roads or streets forming canyons)?
Coastal flood
u Is the community built near a seashore that is close to sea level?
u Is the community in a high seismic activity region?
u Is the community subject to tropical cyclones or extreme wind periods? Dam or dike overflow
u Is the community built below the water level of a lake, sea or river, contained by dikes or a dam?
u Are the dikes properly dimensioned for events that could lead to an overflow (heavy rain or wind episodes, potential combination with tide effects)?
u Are the dikes properly maintained?
u Is the community subject to heavy wind episodes?
u Is the community in a high seismic activity region? PREVENTION
Prevention measures for flooding aim to reduce the phenomenon by limiting the probability that heavy rain or a lengthy period of rain will produce a flood. This is done by creating obstacles that will slow the flow of water upstream of the area subject to flooding. Obstacles can be created by vegetation and by the absorption capacity of the ground, as well as by dams or expansion fields where the flood can be deviated and retained upstream of the community. On the other hand, it is essential that the water is able to flow away easily downstream, and that no obstacles form to retain the water and cause its level to rise.
Managing the water flow
u Are there plans to maintain appropriate vegetation upstream (to slow the water flow)? Is part of the upstream area reserved for expansion fields (using empty areas as retention areas)?
u Is there a plan to prevent upstream areas from becoming impervious?
u Are there upstream dams with appropriate management plans to reduce floods?
u Is the urban wastewater and rain collection network dimensioned for heavy rain episodes?
u Are there structures in the wastewater and rainwater collection system to absorb excess flow (collection basins)?
u Is there a possibility of flow diversion?
Limiting the obstacles to water flow in the potentially flooded areas (to prevent local level rise due to obstacles)
u Are there rules to prevent the building of obstacles (buildings, structures) in the potentially flooded area?
u Are structures such as bridges or narrow passages dimensioned for a flood and to let the water flow?
u Is vegetation managed to prevent piling up of floating or displaced material (e.g. wood, branches or stones)?
u Is the river bed properly managed (i.e. cleared of materials that could form obstacles to flow)?
u Is there a plan to stabilise materials (ground, stones, mud) upstream (without making the soil impervious)?
PROTECTION
Protective measures for flooding are all of the measures that protect people and their property from damage. They are not intended to prevent the water from rising. Flood protection measures