Introduction
Derivative instruments, such as interest rate swaps and credit default swaps, are mainly traded in over-the-counter (OTC) markets, meaning dealers and clients trade bilaterally. As part of a G20 commitment to improve transparency and mitigate systemic risk in these markets, many OTC derivatives will be required to be traded on exchanges or electronic platforms by the end of 2012. It is important that liquidity on the new trading platforms is resilient, both during normal and stressed market conditions. This article explains how liquidity is provided in different trading models and how resilient liquidity provision is likely to be in stressed market conditions.
Derivatives play a key role in the financial system as hedging instruments, allowing businesses and financial institutions to reduce their risk exposures. Trading of derivatives creates a network of counterparty credit risk exposures between market participants. These interconnections also create fragilities in the system (Tucker (2011)).
Trading in OTC derivatives markets is facilitated by dealers at global banks who act as market makers and provide liquidity to end-users. In stressed market conditions, market participants may be inclined to scale back their trading, resulting in reduced liquidity, and consequently greater cost to end-users seeking to hedge risks.
Liquidity will be more resilient in a market where participants have confidence in their ability to manage counterparty
exposures. And, if the network of exposures is well
understood, both the risks to individual participants and the risk of system-wide contagion can be mitigated more effectively. The Bank’s new Financial Policy Committee (FPC) is charged with identifying, monitoring and taking action to remove or reduce systemic risks with a view to protecting and
enhancing the resilience of the UK financial system.(2) Hence,
the FPC has an interest in promoting the robustness of systemically important markets. Trading models are an important component of the infrastructure supporting those markets.
In January 2009, the G20 asked for substantial reforms to OTC derivatives markets in order to ‘improve transparency, mitigate systemic risk, and protect against market abuse’. The G20 reform agenda requires standardised OTC derivatives to be cleared through central counterparties (CCPs) so they can benefit from consistent and transparent risk management. It calls for the establishment of trade repositories that will collect detailed transaction data, thus providing valuable information about both individual and aggregate exposures. The G20 reform agenda also mandates that OTC derivatives be traded on exchanges or electronic trading platforms. In the United States, the trading requirement is being implemented as part of the Dodd-Frank Act, with the Commodity Futures
As part of a G20 commitment to improve transparency and mitigate systemic risk in derivatives
markets, many OTC derivatives will be required to be traded on exchanges or electronic platforms
by the end of 2012. It is important that liquidity on the new trading platforms is resilient, both
during normal and stressed market conditions. This article discusses how liquidity is provided in
different trading models and how liquidity resilience can be achieved. The article shows that
liquidity provision depends on many factors, including the willingness of dealers to provide
continuous prices, their ability to manage the inventory risk arising from their role as market
makers, and the ability of customers to execute large or sensitive trades with minimum price
impact. The article also suggests that conceptually, liquidity resilience can be achieved in a variety
of trading models.
Trading models and liquidity provision
in OTC derivatives markets
By Nick Smyth of the Bank’s Foreign Exchange Division and Anne Wetherilt of the Bank’s Payments and Infrastructure Division.(1)
(1) The authors would like to thank Evangelos Benos and David Norcross for their help in producing this article.
(2) Record of the interim Financial Policy Committee meeting held on 20 September 2011, published 3 October 2011.
Trading Commission and the Securities and Exchange Commission in charge of rule making; in Europe it is part of the Markets in Financial Instruments Directive (MiFID) review led by the European Commission. The requirements will apply to the most actively traded instruments. Less actively traded derivatives may continue to be traded bilaterally.
Trading of OTC derivatives instruments currently relies on bilateral relationships between a relatively small group of dealers who act as liquidity providers for their customers. Transactions are often bespoke and may be of a very large size. Dealers may need time to offset the customer trades they take
on.(1) Exchange-based trading of derivatives remains relatively
low (Chart 1) and is limited to highly standardised futures and
options contracts. Most OTC derivatives transactions are executed using so-called voice-based methods, either via the telephone or internet messaging. Electronic trading of OTC derivatives remains limited in its uptake, although it is growing rapidly.
The remainder of this article is organised as follows. The second and third sections describe trading arrangements in OTC derivatives markets. The fourth section discusses how various trading models differ in terms of transparency, access, and ability to customise client trades. Drawing on the academic literature, it analyses whether these differences matter for liquidity and liquidity resilience, highlights where there are trade-offs, and describes the specific role of dealers. The final section concludes.
OTC derivatives markets: general features
Dealers and their clientsTraditionally, most derivatives have been traded over the counter, meaning that dealers and clients trade bilaterally. The OTC derivatives markets have evolved in this way because
clients have historically wanted to trade bespoke products, that is derivatives that are tailored to the specific requirements of the client. For instance, a firm wanting to hedge the interest rate risk on a two-year loan that it is due to take out in six months’ time, may want to use an interest rate swap specifically customised to these dates. Standardised products, such as interest rate futures, may not perfectly match the client’s requirements, exposing them to residual interest rate risk that they are unprepared to take on. Similarly, an asset manager may want to hedge the interest rate risk associated with a specific bond they own, and may want to use an interest rate swap with the same maturity date and fixed-coupon rate.
As each client has their own unique hedging requirements, it is highly unlikely that two clients will want to trade the exact same derivatives contract with each other at the same time. So these dealers act as intermediaries, allowing clients with diverse requirements to trade in a timely fashion. Clients often have long-standing relationships with several dealers.
When trading with a client, the dealer takes on the other side of the client trade. The dealer may hold this position in his inventory until he finds a broadly offsetting trade with another client or with another dealer(s) in the interbank market, also referred to as the inter-dealer market. Here dealers trade with one another only.
Dealers often hedge their market risk on bespoke client trades with more liquid market-standard contracts. In the example above, the dealer might hedge the two-year interest rate swap starting in six months’ time with a ‘vanilla’ two-year or three-year interest rate swap in the interbank market. This leaves the dealer with residual interest rate risk, which they are better placed to monitor and manage than their clients. In Europe, dealers also use Euribor futures contracts and German bund futures contracts to hedge client positions. These futures markets are highly liquid and allow dealers to hedge their interest rate risk quickly and at low cost. They are usually closely correlated with interest rate swaps. Because dealers have confidence they can hedge their interest rate risk in these futures markets, they are more willing to provide liquidity to clients in the swaps market.
Other factors affect the intermediation services that dealers provide to their clients, besides their ability to hedge in related markets. One factor is the competition for client business (see also the section on dealer competition). Dealers with a greater market share tend to earn more from trading, gain more information on trading flows (including from those clients who are perceived to have greater ability to forecast price movements), and have a greater ability to cross-sell or
(1) See for example Chen et al(2011).
FX swaps and options
Interest rate swaps and options Equity-linked contracts OTC Exchange traded(b) 0 100 200 300 400 500 600 US$ trillions
Chart 1Gross notional amount outstanding of OTC and exchange-traded derivatives by asset class(a)
Source: BIS. (a) As at June 2011.
cross-subsidise different investment bank business (such as syndicated primary debt issuance).
Dealers’ willingness to act as intermediaries also depends on the volatility of market prices and dealers’ own risk appetite. Dealers accumulate positions by virtue of their trading with clients, and these positions fluctuate in value. In volatile markets, dealers tend to quote wider bid-ask spreads to protect themselves against the possibility that prices may move sharply after they trade with a client (but before they
have had the chance to hedge).(1)
Size of the market
According to the Bank for International Settlements (BIS), the total notional amounts outstanding of OTC derivatives as of June 2011 was just over US$700 trillion, with interest rate swaps accounting for US$554 trillion, followed by FX swaps (US$65 trillion), credit default swaps (US$32 trillion), and equity and commodity derivatives (US$6.8 trillion and
US$2.7 trillion, respectively) (Chart 2).(2) Average daily
turnover in OTC interest rate derivatives was US$2.1 trillion in April 2010, with interest rate swaps accounting for US$1.3 trillion.(3)
Trading in OTC derivatives tends to be dominated by the large
global dealers. As an example, Chart 3shows that interest
rate swap transactions between the major OTC derivatives dealers (commonly referred to as the G14 dealers) make up around 57% of all outstanding contracts.
Competition among dealers is typically higher for the more liquid products; for less liquid, less actively traded contracts, dealer concentration tends to be higher and competition
lower. This is illustrated in Chart 4which shows that as the
number of credit default swap trades per day declines, the number of participating dealers also falls.
Finally, trading volumes in OTC derivatives are skewed, with only a few contracts attracting high trading volumes. As an
illustration, Chart 5shows that just over 90% of all credit
default index transactions trade fewer than 50 times a day, and just below 90% of all single-name credit default swaps trade less than 50 times a week.
How OTC derivatives are traded
Currently, OTC derivatives are mainly traded in so-called
quote-driven markets. In these markets, dealers quote prices at
Interest rates FX Credit derivatives Equities Commodities 0 100 200 300 400 500 600 700 1998 2000 02 04 06 08 10 US$ trillions
Chart 2 Gross notional amounts outstanding of OTC derivatives(a)
Source: BIS. (a) As at June 2011. 0 50 100 150 200 250 300 350 400 450
Sep. Nov. Jan. Mar. May July G14 dealer
Non-G14 dealer
US$ trillions
2010 11
Chart 3 Gross notional amount outstanding by counterparty type(a)(b)
Source: TriOptima.
(a) G14 dealers are the group of fourteen international banks that have signed up to meet the Federal Reserve Bank of New York’s regulatory commitments.
(b) CCP-cleared trades counted as G14 dealer trades.
0 2 4 6 8 10 12 14 16 18 0 50 100 150 200 250
Average monthly clearing dealers
Average number of trades per day
Chart 4Trading frequency of CDS index entities against average number of dealers(a)(b)
Source: DTCC Trade Information Warehouse.
(a) Each marker represents a single reference entity of index credit default swaps (CDS) plotted against the average number of dealers clearing the entity per month (y-axis) and the average number of trades per day (x-axis).
(b) From 20 December 2010 to 19 March 2011.
(1) The bid-ask spread, also referred to as the bid-offer spread, is defined as the difference between the prices at which the dealer is willing to buy and sell.
(2) The total amount outstanding of OTC derivatives also includes other unallocated contracts with a notional value of US$46 trillion as at June 2011.
(3) Numbers for daily turnover differ from the printed version of the Bulletin, which reported the incorrect numbers.
which they would be willing to trade with their counterparts. A trade takes place when a counterparty (a customer or another dealer) contacts the quoting dealer and they both agree to the deal — often the quoted price is merely indicative and may be improved upon through bilateral negotiation. OTC derivatives share this market structure with foreign exchange, government and corporate bond, and structured product markets.
In contrast to OTC derivatives, most stocks and futures are
traded in so-called order-driven markets. In these markets,
orders are submitted to a central limit order book which lists all outstanding buy and sell orders. A trade is executed if it can be matched against an existing order in the book; if not, the order will join the list and wait for a new offsetting trade to
arrive.(1) The two market structures overlap, however, with
some government bonds trading in an order-driven
environment, and many stock exchanges offering quote-driven segments, for example for less liquid, smaller-capitalisation stocks.
Historically, most trading of OTC derivatives has taken place via voice execution, which refers to both telephone and internet-based messaging. With the increase in electronic trading of other products (notably foreign exchange, equities and highly liquid government bonds), some OTC derivatives trading has started to gravitate towards electronic trading venues, some relying on quote-driven models, others on order-driven models. IOSCO (2011) estimates that in June 2010 around 12% of interest rate swaps and just below 17% of all credit default swaps were traded electronically. The transformation mandated by the G20 has two dimensions — a technology dimension and a market structure dimension. The former involves automating aspects of the trading process.
The latter involves changes in the trading model: whether to replace bilateral trading with multilateral trading and whether to choose a quote-driven or an order-driven model. These choices are facilitated by technology and are evident in the variety of trading models that are being developed.
The remainder of this section describes a variety of electronic trading models for OTC derivatives. Some are currently in use, others are still being developed. The discussion starts with a model that mimics many of the features of bilateral voice trading — the single-dealer platform — and ends with inter-dealer platforms that are very close to the central limit order book operated on exchanges.
What are the main trading models?
Single-dealer platforms (SDPs): These are proprietary electronic trading systems offered by individual dealers for trading with their clients. Dealers display firm buy and sell prices for various standard swap maturities which are tradable up to a certain trading volume. The client can trade by selecting the desired maturity shown on screen, whether they want to buy or sell, and the size of the trade. This is the ‘click to trade’ method of execution.
Clients may also use SDPs to trade bespoke interest rate swaps, ie those instruments that are not market standard and therefore not shown on screen. To do so, the client must key in the desired maturity dates, along with other customisable fields, and their intention to buy or sell. The client’s enquiry is sent to the dealer who provides a price in response. This is the ‘request for quote’ (RFQ) method of execution: clients ask the dealer for a quote and can then choose whether or not to trade.
Operators of SDPs grant access to clients on request (and by the same token, can restrict access to select clients). As the name suggests, clients only see a single dealer’s prices. Trading a swap via an SDP is similar in many ways to trading by voice, in that it represents a bilateral trade agreement between two participants that is not observed by the rest of the market. Hence, the SDP is an example of a quote-driven model. Dealers are also able to tailor the pricing they show to different customers.
A client with access to more than one SDP will need to contact each platform individually to find a suitable quote. Electronic solutions are being developed to reduce the resulting search costs. So-called aggregation tools allow clients to view the prices of all the dealers whose individual platforms they are allowed to access in an easy to use format.
Under proposed US and European regulations, SDPs in their current form may no longer be eligible to trade standardised
(1) There is a parallel with auction theory with the quote-driven model corresponding to a uniform-price auction, and the order-driven one to a discriminatory-price auction.
30 40 50 60 70 80 90 100 0 50 100 150 200 CDS index (daily)
Single name (weekly)
Average number of transactions
0 Per cent
Chart 5Cumulative distribution of average number of trades for CDS index(a)and single name(b)(c)
Source: DTCC Trade Information Warehouse. (a) Average daily transactions for 125 CDS index contracts. (b) Average weekly transactions for 1,000 single-name CDS contracts. (c) From 20 December 2010 to 19 March 2011.
OTC derivatives. Instead, market participants may need to trade eligible instruments on multi-dealer trading platforms described next.
Multi-dealer request for quote (RFQ) model: These are systems that provide buy and sell prices to clients for various standard swap maturities. The user’s screen looks similar to the single-dealer’s screen, except that the prices are based on submissions from a number of contributor dealers. Trade volumes are also not shown and prices are not attributable to a certain dealer. Clients may send requests to several dealers for firm quotes and then select the most favourable price. Like the single-dealer platform, the multi-dealer RFQ is an example of a quote-driven model. Existing multi-dealer RFQ systems allow customers to request a quote from only one dealer, if they do not wish to reveal their trading intentions too widely. This allows the customer to transact in a similar way to how they would on a single-dealer platform, although the customer retains the ability to trade with more than one dealer if they wish to.
Multi-dealer limit order book model:These systems allow dealers to post firm buy and sell limit orders at various standard swap maturities. Customers can trade if they find a suitable limit order in the book, but cannot enter limit orders themselves. The full depth of the book is visible, so customers can view all the limit orders at a point in time, not just the best bid and offer. Customers need permission from the respective dealers to access the platform. This model is still being developed for trading OTC derivatives. It is an example of an order-driven model, but as will be explained below, differs from the central limit order book model operated on exchanges.
Inter-dealer limit order book model: In the interbank market, a limit order book model, operated by interbank brokers, has emerged. Dealers provide continuous prices in the form of limit orders for standard swap maturities, and these form the basis of a centralised order book. Access to the electronic trading platform is limited to dealers only, so clients can neither post, nor trade on outstanding limit orders. As in the multi-dealer limit order book model described above, the full depth of the limit order book is visible, so dealers can view all outstanding limit orders. After trades are executed, the traded price is shown to all participants but not the volume traded. And unlike the multi-dealer limit order book model outlined above, orders displayed are anonymous. Another difference with the multi-dealer limit order book model is that the users of the system — exclusively dealers in this case — can both post limit orders to the limit order book and trade on existing orders.
At present, this inter-dealer limit order book complements voice trade execution offered by the interbank brokers,
effectively creating a hybrid model. Dealers can submit their orders to the limit order book, trade via voice, or do both. Market participants note that smaller and more standardised inter-dealer trades are increasingly executed on limit order books, whereas larger or more bespoke trades continue to be done via voice. Indeed, a distinguishing feature of the inter-dealer market is the flexibility to trade large sizes bilaterally, away from the screens. These trades are known as ‘block trades’. Regulators are currently debating where the block-trade threshold should be set for OTC derivatives.
Central limit order book: Finally, on futures exchanges, so-called central limit order books provide full and open access to all interested trading parties. Trading is anonymous, with the order book showing firm prices and trade sizes to all participants. Dealers are no longer the sole liquidity providers — both dealers and their clients can submit limit orders and thus add liquidity to the market. There is no price
discrimination and no opportunity to customise trades. But as in other exchange-type environments, liquidity depends on the timely arrival of orders from market participants. Hence, this model critically relies on the existence of a deep pool of buyers and sellers — conditions likely to be the case in only the most liquid contracts (IOSCO (2011)). And in stressed market conditions, liquidity may be less resilient as trading interest may be thinner. For this reason, some futures exchanges rely on designated participants to provide continuous quotes and/or liquidity.
To summarise, the OTC derivatives market is characterised by a variety of trading models. These include quote-driven models (single-dealer platforms and multi-dealer request for quote models) and order-driven models (the inter-dealer limit order book), alongside voice-based trading. The multi-dealer limit order book model is under development as banks prepare for the implementation of the G20 commitments.
Table Aprovides a brief summary of the trading models discussed in this section.
Trading models and liquidity
This section discusses how the various models differ in terms of pre and post-trade transparency, access, and ability to customise client trades. It further assesses whether these differences matter for liquidity and liquidity resilience. In doing so, the section draws on the academic literature on dealer markets.
Pre-trade transparency
Pre-trade transparency refers to the information available to market participants prior to executing a trade, including price quotes and trade sizes. Pre-trade transparency differs across trading models. It is highest in the central limit order book, followed by inter-dealer and multi-dealer limit order books
which display tradable prices and sizes from a number of market participants simultaneously. It is a little lower on multi-dealer RFQ models, where participants need to contact several dealers in order to compare price quotes. And it is lowest on single-dealer platforms and in bilateral trading since market participants only see the prices or quotes of one dealer at a time, although earlier-mentioned search tools help participants bring together information from different sources.
Hence, the G20 mandated move from bilateral voice-based trading to electronic platform trading is likely to entail an increase in pre-trade transparency. While this reduces search costs and in turn the cost of trading, it may also have implications for liquidity provision. Here the academic literature usefully highlights the various incentive effects at play.(1)
First, the literature makes a distinction between informed and uninformed traders (see the box on page 337). Uninformed traders tend to benefit from seeing prices and trade sizes, as it reduces their adverse selection risk — namely the risk of losing money in a trade with a better informed counterparty. Hence, everything else equal, uninformed traders will prefer to trade in the more transparent setting, in turn contributing to liquidity.
Greater pre-trade transparency can, however, affect the incentives of informed traders who often act as liquidity providers. Market structure theory shows that greater pre-trade transparency can deter these traders from providing liquidity, for example if it reduces the returns they earn on their research. Yet, the theory also shows that greater pre-trade transparency reduces strategic behaviour among informed dealers, encouraging them instead to compete more
and improve upon each others’ quotes, thus reducing transaction costs and improving liquidity.
In sum, the impact of increased pre-trade transparency remains ambiguous, with some empirical studies showing a
reduction in liquidity, and others the opposite.(2) While
increased use of electronic trading platforms is likely to entail an increase in pre-trade transparency, it is difficult to predict its precise impact on liquidity provision.
Post-trade transparency
Post-trade transparency refers to the information about executed trades made available to market participants other than the two parties involved in the trade, or a narrow set of dealers. This typically includes prices and volumes, and may involve a reporting delay. In quote-driven markets, post-trade transparency has traditionally been low, although there are notable exceptions, such as US corporate bond markets. In contrast to pre-trade transparency which is an intrinsic characteristic of the trading model (see the section on pre-trade transparency above), post-trade transparency can be achieved in the form of reporting requirements, independent of trading venue.
Greater post-trade transparency is generally considered to reduce information asymmetries, thus contributing to improved price discovery and liquidity. At the same time, greater disclosure of trade information may discourage informed traders from trading, which could reduce liquidity. In common with pre-trade transparency, greater post-trade transparency may also reduce incentives for informed market participants to gather information (eg by conducting research) and bring their trades to the market, thus weakening price discovery.
An additional consideration in dealer markets is that
post-trade transparency may reveal information about dealers’ inventory positions. This in turn makes it more difficult for
dealers to unwind their positions.(3) Hence, the concern that
greater transparency may lead to an increase in inventory risk and in turn to a deterioration in liquidity provision in the customer-to-dealer market (Gravelle (2002)).
Inventory risk is a particular concern in less-actively traded contracts, as it may take the dealer longer to unwind his inventory. It is also more pronounced for large trade sizes. Recognising these issues, many reporting regimes allow for the delayed reporting of large, so-called block trades.
Table A Summary of trading models
Single-dealer models
Click-to-trade model: an electronic platform which allows clients to execute trades against firm prices posted by a single dealer.
Request for quote model: an electronic platform which allows clients to request firm quotes from a single dealer for a specific transaction. Multi-dealer models
Limit order model: an electronic platform which lists buy and sell orders in a limit order book — only dealers are allowed to enter limit orders; participating clients may trade against posted orders. Request for quote model: an electronic platform which allows clients to request firm
quotes from multiple dealers simultaneously. Inter-dealer limit order book model
a limit order book model, operated by interbank brokers; no client access.
Central limit order book model
a limit order book model which provides full and open access to all interested trading parties.
Hybrid model
a trading model which combines electronic platform trading with bilateral voice-based trading.
(1) See Biais et al(2006) for a useful overview of transparency studies considered in this section.
(2) See for example Gravelle (2002). (3) See for example Chen et al(2011).
Platform access, price discrimination and customisation
Electronic platforms also differ in terms of access, with many platforms limiting access to selected market participants. Access to a SDP is often part of the trade execution services offered to clients (alongside pre-trade research and post-trade processing). Likewise, multi-dealer platforms can set access restrictions. Moreover, both models allow dealers to use their discretion and offer different prices to different customers. They can also customise trades, giving clients flexibility (eg in terms of contract size, maturity or other trade characteristics). In sum, access criteria, price discrimination and customisation options feature in both single and multi-dealer models, and it
is not clear ex antehow much the two models differ in this
respect.
In the inter-dealer market, current electronic models restrict access to dealers only. But a distinct feature of the inter-dealer limit order book model discussed in the third section is that trading is anonymous, so there is no price discrimination. As mentioned earlier, current inter-dealer limit order books list the more standardised swap contracts only. Trading of bespoke contracts continues to be done almost exclusively via voice execution.
Finally, central limit order book models, as used on futures exchanges, offer unlimited access, limited customisation and no price discrimination.
On the one hand, broad access has so-called liquidity-pooling benefits, bringing together a larger number of actual (or potential) buyers and sellers. On the other hand, broad access
Market microstructure theory
(1)Market microstructure theory aims to understand the process of price formation by modelling the trading process, ie the precise mechanism by which buyers and sellers meet and agree on a price. In doing so, market microstructure theory recognises that prices may not just reflect fundamentals, but also the characteristics of buyers and sellers (their risk preferences and individual knowledge), the characteristics of the trading rules (ie how buy and sell orders are matched), and the characteristics of trading venues (ie where buyers and sellers meet).
In a liquid market, buyers and sellers can trade with minimal delay. Both large and small orders can be accommodated and without causing large price swings. A market has resilient liquidity if these properties are maintained, even when prices become more volatile and/or investors more risk-averse. Market makers contribute to market liquidity by their willingness to buy and sell, building up and running down an inventory of positions. In return, they expect to earn the bid-ask spread. But markets are not always liquid, and some are more liquid than others. The market microstructure literature attributes these differences to information asymmetries on the one hand, and execution uncertainty on the other.
Information asymmetries
These can give rise to adverse selection risk: when trading with better informed counterparts, uninformed participants are at risk of making the wrong trading decision. An uninformed market maker faces this risk too, but can protect himself by widening his bid-ask spread.
Informed traders may reveal some of their private information through their trading actions. It follows that uninformed
traders can learn valuable information simply by observing the order flow (defined as the sum of all trades during a given time interval).
The order flow is a noisy indicator though, so uninformed traders are unlikely to discover the precise trading intentions of their informed counterparties. Moreover, if informed traders can keep some of their informational advantage, they will have incentives to acquire such information in the first place (eg through research) and be more willing to contribute to liquidity.
Market microstructure theory shows that increasing disclosure in the form of greater pre-trade or post-trade transparency may have ambiguous effects on liquidity (see the sections on pre and post-trade transparency).
Execution costs and uncertainty
This may result from the fact that buy and sell orders are often not perfectly synchronised. Market makers can reduce the costs to market participants arising from execution uncertainty by allowing market participants to trade immediately rather than having to wait for a counterparty. But in doing so they will incur inventory risk (or market risk). Bid-ask spreads provide a compensation for this risk.
During periods of increased price volatility, market makers may widen their bid-ask spreads or even refrain from providing sufficient liquidity. In turn, market participants may decide to stay away, as execution risk is higher. In other words, liquidity is less resilient in markets that see sharp falls in participation during volatile market conditions.
rules are less effective in a model that relies on dealers’ willingness to commit their own capital. Regulators also allow platform operators to use access rules as a risk management tool, for example to ensure that participants meet the credit standards of the platform operator, provided the rules are objective and transparent (IOSCO (2011)). They further specify conditions under which platform operators can set discretionary execution rules that allow price discrimination.
Dealer competition
In principle, increased use of multi-dealer platforms will make it easier for clients to compare multiple price sources. This in turn could lead to greater competition between dealers, which in turn might affect liquidity provision. Again, academic work provides useful insights on the factors at work.
Early theoretical papers assumed dealers were competing for
client orders.(1) In these, typically quite stylised, models,
liquidity improves (in the form of narrower bid-ask spreads) as the number of market makers increases. Prices reveal available information more readily and adverse selection risk is reduced.
Later theoretical models show that dealers may quote wider bid-ask spreads (see for example Viswanathan and Wang (2002)), or reduce the amount of liquidity they supply to the market (Biais, Martimort and Rochet (2000)), when
competition is reduced. These models suggest that competitive behaviour is restored as the number of dealers increases, with volumes increasing and bid-ask spreads narrowing. Empirical research supports these findings, although some papers find the effect to be small, suggesting that it is relatively difficult for new dealers to capture market
share from the incumbents.(2)
But matters become more complicated when introducing more institutional detail. Theoretical work shows that quote-driven models (such as the RFQ model) and
order-driven models (such as the inter-dealer limit order book) have very different properties in terms of liquidity, thus providing theoretical support for a trading environment that offers choice to market participants.
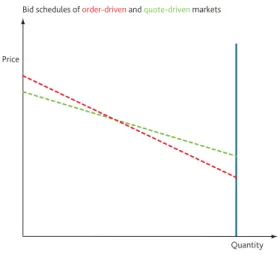
Viswanathan and Wang (2002) show that in a market with many dealers, small orders fetch better prices in the order-driven market, whereas large orders do better in the
quote-driven market. Their insights are illustrated in Figure 1,
which depicts the demand schedules of dealers in a quote-driven market (the green line) and in an order-driven market (the red line). For every quantity of the asset that a customer wants to sell, these lines give the price at which the dealer is willing to buy the offered quantity. For a small order, the customer will get a higher price when selling in the order-driven market (the red line lies above the green one), for a large order, he will prefer the quote-driven market.
The intuition is that an order in the quote-driven setting is typically executed at a single price (which only reflects the size of the trade in question), whereas in the limit order book, a customer order will travel down (or up if buying) the limit order book, starting from the highest posted bid (or lowest posted ask) and picking up successively worse prices to complete the order.
Viswanathan and Wang (2002) also show that when the number of dealers is small — eg when a stock is less actively traded — dealers (quoting a single price) will no longer provide competitive quotes. But for the limit order book to be a viable alternative, it needs to be supported by a sufficient number of liquidity providers. In other words, a limit order book can only support a market with few dealers if total trading activity is sufficiently high.
The authors conclude that their results provide justification for a hybrid model, which offers customers a choice between quote-driven and order-driven trade execution.
Although stylised, the model illustrates that it is difficult to predict how a move from bilateral voice trading to electronic trading, or from single-dealer to multi-dealer trading, will affect the liquidity-competition relationship. The precise effect may depend on the number of dealers, on the trading model and on trade sizes. These factors are relevant in derivatives markets where average trade sizes can be large, and where the number of dealers varies with trading interest (Chart 5).
Quantity Price
Bid schedules of order-driven and quote-driven markets
Figure 1 Stylised demand schedules in order-driven and quote-driven markets
Sources: Bank of England and Viswanathan and Wang (2002).
(1) These early models assume Bertrand-type competition, with free entry and exit and dealers earning zero profits.
(2) See Biais, Glosten and Spatt (2005) for a survey. It should be noted, however, that many of the empirical studies are carried out in the context of quote-driven equity markets (such as NASDAQ or the London Stock Exchange prior to 1997).
Inter-dealer trading
A recent study of credit default swaps (Chen et al(2011)) finds
that dealers often need several days to hedge their large customer trades. Thus dealers in this market are subject to significant market risk. As explained in the third section, the inter-dealer segment of OTC derivatives markets provides dealers with an opportunity to rebalance their positions after trading with their customers. In doing so, dealers can reduce their own market risk, and will be more inclined to provide liquidity to their customers.
Viswanathan and Wang (2004) model the interaction between the customer and dealer segments of the market as a
two-stage game, showing that inter-dealer trading can improve liquidity. In the first stage, dealers compete with one another for customer business, and one dealer ‘takes it all’. In the second stage of their model, when trading in the inter-dealer market, the winning dealer attempts to maximise revenue. Being a monopolist (or having market power in general) she achieves that by restricting quantities. The authors show that this in turn encourages all dealers to behave competitively in the first round, resulting in better prices for customers.
Viswanathan and Wang (2004) also find the inter-dealer limit order book model to be robust in a market with high
information asymmetries. Having obtained an order from an informed customer, a dealer using the order book can submit a series of small orders and trade at multiple prices, as explained earlier, starting from the best outstanding quotes. In contrast, a quote-driven market exacerbates adverse selection because it restricts dealers to trading the entire order at a single price. When worried about adverse selection risk, counterparties may be unwilling to take the other side of the trade. Hence the authors find liquidity resilience to be higher in an inter-dealer market which relies on a limit order book.
Electronic platform trading and liquidity
resilience: key challenges and concluding
remarks
As market participants prepare for the G20 mandated transition from bilateral voice-based trading to electronic platform trading, the nature of liquidity provision is likely to change. Given the systemic role of OTC derivatives, it is important that liquidity on the trading platforms supporting trading in this market is resilient, both during normal and stressed market conditions.
Moving trading from the bilateral environment to an exchange or electronic trading platform represents a significant change.
It may include changes in transparency, in the relationship of dealers with their customers, and in the liquidity available, particularly during periods of market stress.
This article has described a variety of models for OTC derivatives trading. Some already exist and their volumes are increasing, others are still being developed. The article has shown that liquidity provision depends on many factors, including the willingness of dealers to provide continuous liquidity, their ability to manage the inventory risk arising from their role as market maker and the ability of customers to execute large or sensitive trades with minimum price impact.
Drawing on the academic literature, this article has shown that trade-offs may arise between increasing transparency and/or widening access on the one hand, and maintaining liquidity on the other hand. It has also shown that inter-dealer trading supports liquidity provision to end-users. And it has illustrated how the relative benefits of quote-driven and order-driven models may depend on several factors, including trade frequency and dealer concentration.
Liquidity resilience, or the ability of a market to attract buyers and sellers at all times, requires a model where the main liquidity providers are willing to quote continuous prices, even during periods of market stress. For a platform to be liquidity resilient, it needs liquidity providers who are confident that they can manage their inventories without incurring undue execution delays or adverse selection risk, compared to bilateral trading, even as prices become more volatile. Conceptually, such resilience can be achieved in different trading models. Academic studies show that liquidity provision is more robust when market participants have a choice between trading models. In other words, liquidity resilience is greater when liquidity providers have a choice on how to trade. This includes the ability for dealers to manage their inventory risk via inter-dealer trading.
Anecdotal evidence from market participants indicates that liquidity resilience can be maintained on electronic trading platforms during periods of market stress, even though bid-ask spreads may widen. But market participants also underline the need for flexibility, including the ability to trade via voice execution methods or in a dealers-only
environment.(1)
As regulators and market participants are preparing for the implementation of the G20 objectives, it is important that the trade-offs inherent in the different trading models are recognised.
References
Biais, B, Declerck, F, Dow, J, Portes, R and von Thadden, E (2006), ‘European corporate bond markets: transparency, liquidity, efficiency’, CEPR working paper, May.
Biais, B, Glosten, L and Spatt, C (2005), ‘Market microstructure: a survey of microfoundations, empirical results and policy implications’, Journal of Financial Markets, Vol. 8, No. 2, pages 217–64.
Biais, B, Martimort, D and Rochet, J-C (2000), ‘Competing
mechanisms in a common value environment’, Econometrica, Vol. 68, No. 4, pages 799–837.
Chen, K, Fleming, M, Jackson, J, Li, A and Sarkar, A (2011), ‘An analysis of CDS transactions: implications for public reporting’,
Federal Reserve Bank of New York Staff Report No. 517.
Gravelle, T (2002), ‘The microstructure of multiple-dealer equity and government securities markets: how they differ’, Bank of Canada
Working Paper No. 2002-9.
IOSCO (2011), Report on trading of OTC derivatives, February. Madhavan, A (2000), ‘Market microstructure: a survey’, Journal of
Financial Markets, Vol. 3, pages 205–58.
O’Hara, M (1995), Market microstructure theory, Blackwell Publishers, Cambridge, Mass.
Tucker, P (2011), ‘Building resilient financial systems:
macroprudential regimes and securities market regulation’, available at www.bankofengland.co.uk/publications/speeches/2011/
speech498.pdf.
Viswanathan, S and Wang, J (2002), ‘Market architecture: limit-order books versus dealership markets’, Journal of Financial
Markets, Vol. 5, pages 127–67.
Viswanathan, S and Wang, J (2004), ‘Inter-dealer trading in financial markets’, Journal of Business, Vol. 77, No. 4, pages 987–1,040.